Large-scale Observability platform
End-to-End Observability of Applications
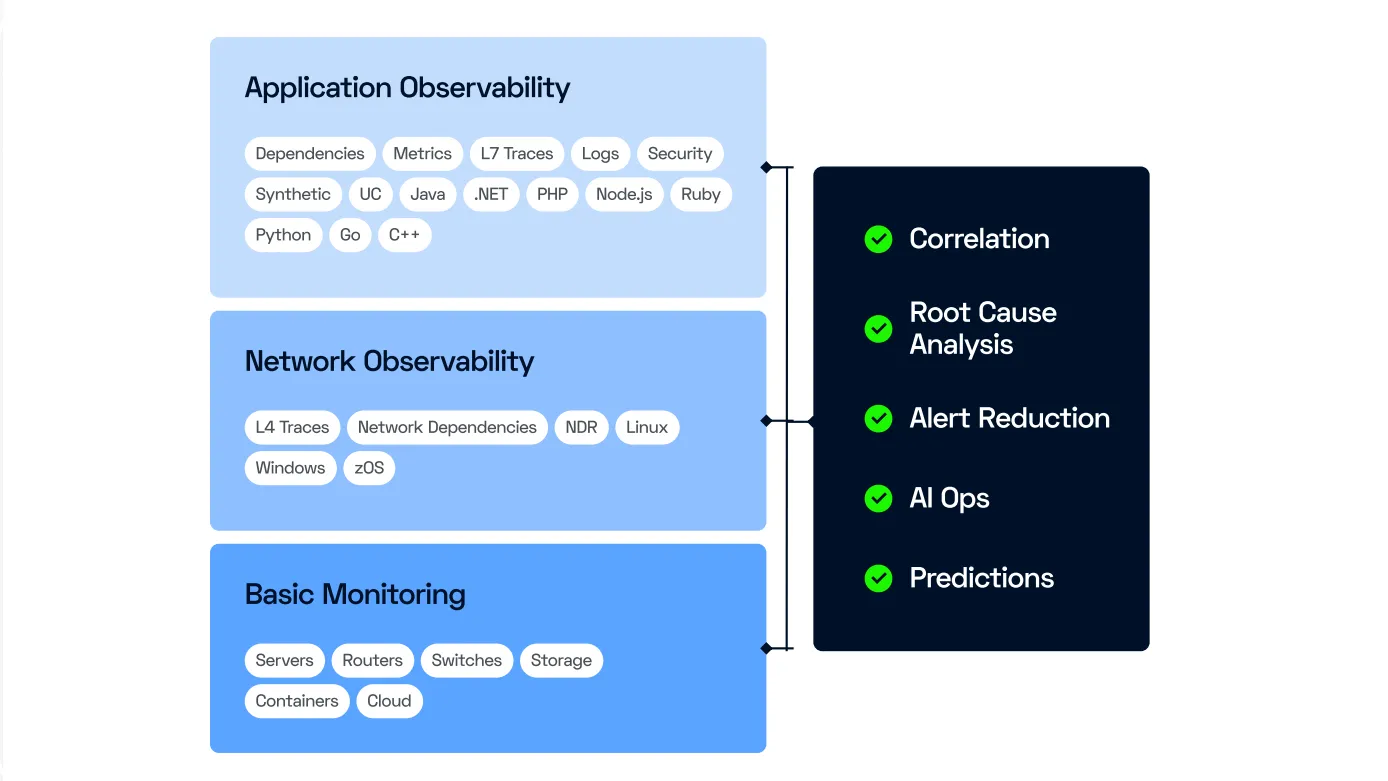
Learn how our platform provides comprehensive observability for your IT systems.
Learn moreObservability of Mainframes
Monitor and manage your mainframes effectively with our advanced L3/L4 flow analysis and OTEL trace solutions.
Learn moreObservability of Unified Communications
Ensure seamless and secure communication with our Unified Communications observability.
Learn more
Enterprises, governments and Fortune 500
powerful platform
Top features
Designed to work with Open Source software such as OpenTelemetry, Kubernetes, Grafana, and many others.

Analyze and automate with the power of AI.

Reduce the number of alerts to simplify their management and analysis.
A trusted SaaS platform for your observability needs.

Easy on-premises deployment with ServicePilot: Zero risk.

Keep your data for as long as necessary.

meet our customers
What our users say
"Dynatrace is too complex and too expensive. ServicePilot was fully operational in just five days, and the teams embraced it immediately."
"We installed ServicePilot in a matter of days and after several weeks of use, the software became indispensable to operators to ensure the performance of internal contact centers and anticipate incidents."

"For nearly 15 years, ServicePilot Technologies has been accompanying Naval Group, a world-class French leader in naval defense."
IT Operations Manager
Naval Group - Military Observabilityblog
Learn more about observability with ServicePilot
ServicePilot IT Monitoring Blog
An overview of ServicePilot features, feedback, discussions on monitoring topics and more.
Learn more

ServicePilot Documentation
A unified analysis platform that supports observability and full-stack monitoring with metrics, traces and logs.Learn more
Integrations and Technologies
Discover our packages: ready-to-use technology-based monitoring templates to get your monitoring up and running instantly.Learn more
Monitoring Orange Service Centers
The teams in charge of performance in Orange service centers around the world use ServicePilot on a daily basis, find out why...Learn moreLearn more
Free installation in
a few clicks
SaaS Plateform
Flexible deployment according to your needs (SaaS, hybrid, on-premise) to speed up supervision implementation.
- No on-premise software setup, servicing and configuration complexity
- Instant setup, complete and pre-configured to ensure robust monitoring
OnPremise Plateform
Flexible deployment according to your needs (SaaS, hybrid, on-premise) to speed up supervision implementation.
- Contracts and commitments over time ( > 1 year)
- Performance, Data Storage and Infrastructure Management
- 2 additional solutions: VoIP and Mainframe monitoring
