What is Java?
Java is a high-level, class-based, object-oriented programming language that is designed to have as few implementation dependencies as possible. It is a general-purpose programming language intended to let programmers write once, run anywhere meaning that compiled Java code can run on all platforms that support Java without the need to recompile. Java applications are typically compiled to bytecode that can run on any Java virtual machine (JVM) regardless of the underlying computer architecture. The syntax of Java is similar to C and C++, but has fewer low-level facilities than either of them. The Java runtime provides dynamic capabilities (such as reflection and runtime code modification) that are typically not available in traditional compiled languages. Java applications typically rely on Java Virtual Machines (JVM), classes (applet, servlet, jsp...) and provide garbage collection mechanisms.
Java was originally developed by James Gosling at Sun Microsystems. It was released in May 1995 as a core component of Sun Microsystems' Java platform. The original and reference implementation Java compilers, virtual machines, and class libraries were originally released by Sun under proprietary licenses. As of May 2007, in compliance with the specifications of the Java Community Process, Sun had relicensed most of its Java technologies under the GPL-2.0-only license. Oracle offers its own HotSpot Java Virtual Machine, however the official reference implementation is the OpenJDK JVM which is free open-source software and used by most developers and is the default JVM for almost all Linux distributions.
It is one of the world's most used enterprise programming language, powers every Android smartphone using the Android SDK and it offers several popular application servers like Apache Tomcat, JBoss, Weblogic, WebSphere...
Java application instrumentation
The appservice-java package along with a Java instrumentation library collects performance metrics and errors from the application server.
Automatic instrumentation uses a Java agent JAR that can be attached to any Java 8+ application. It dynamically injects bytecode to capture telemetry from many popular libraries and frameworks. It can be used to capture telemetry data at the “edges” of an app or service, such as inbound requests, outbound HTTP calls, database calls, and so on.
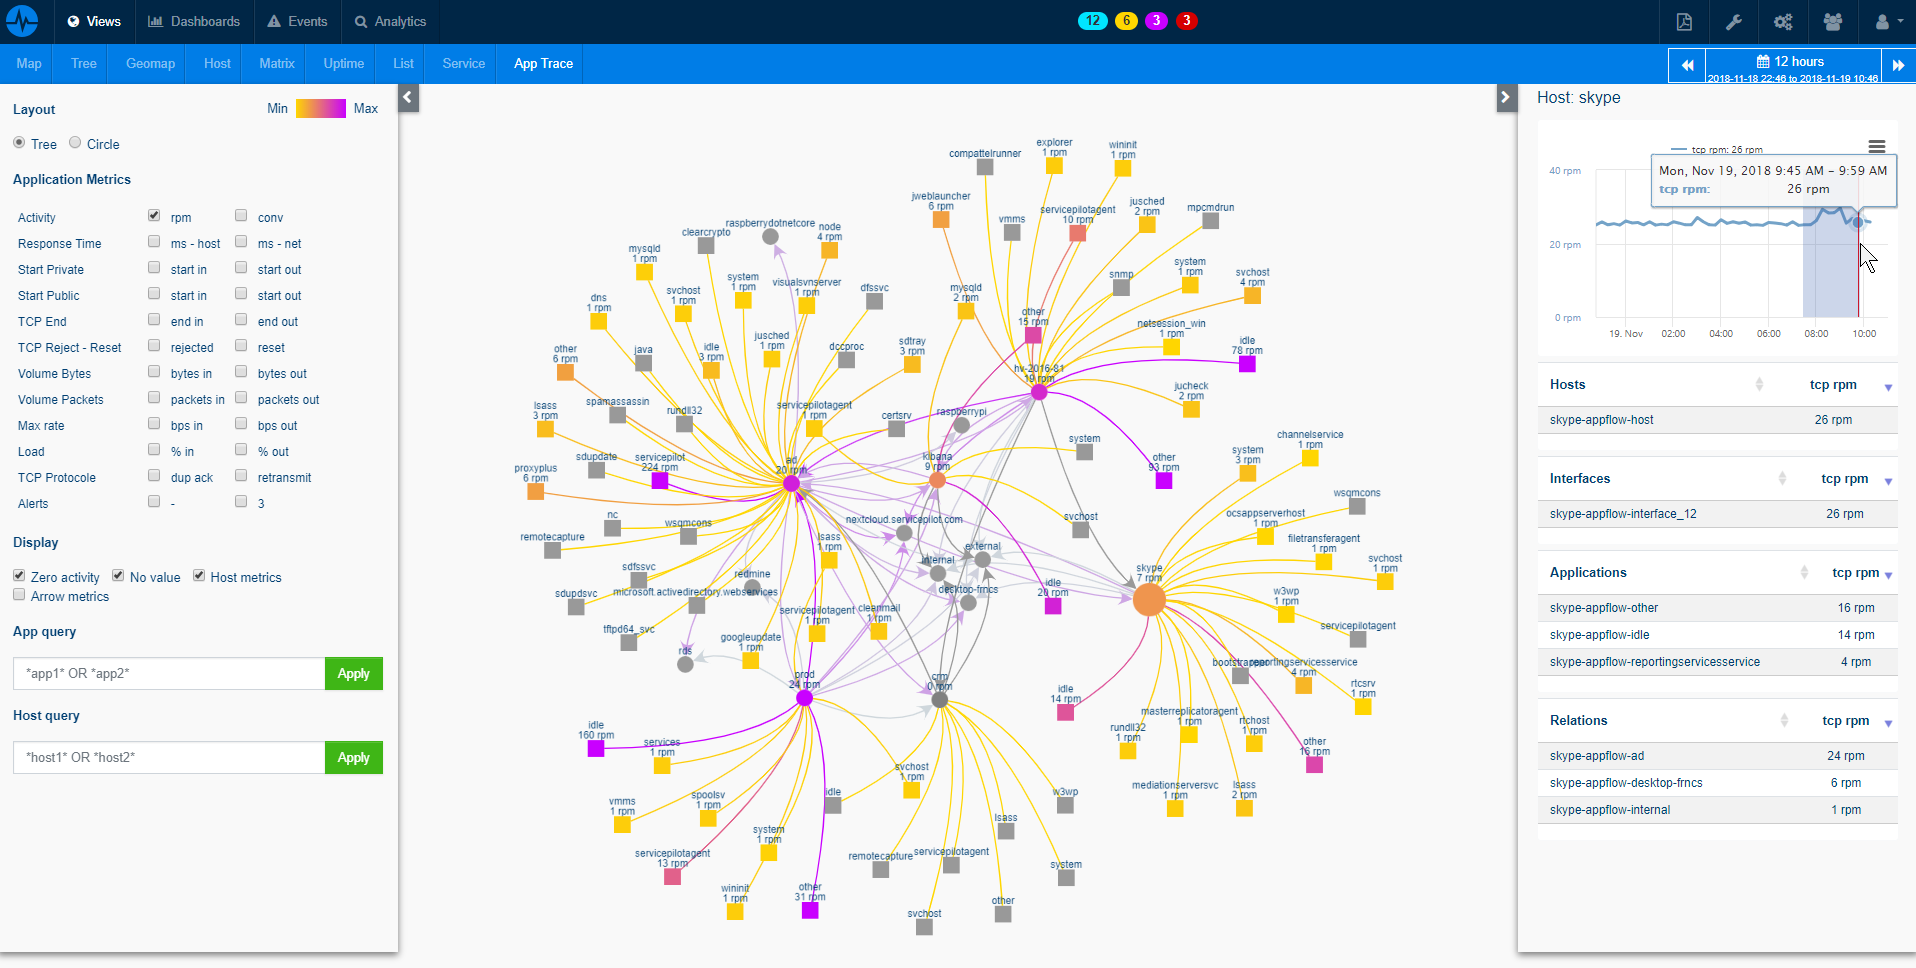
Java application traces monitoring
Resources are automatically created from this package after having deployed the ServicePilot Agent along with the proper Java APM library configuration. It monitors HTTP(S) web requests from Java processes.
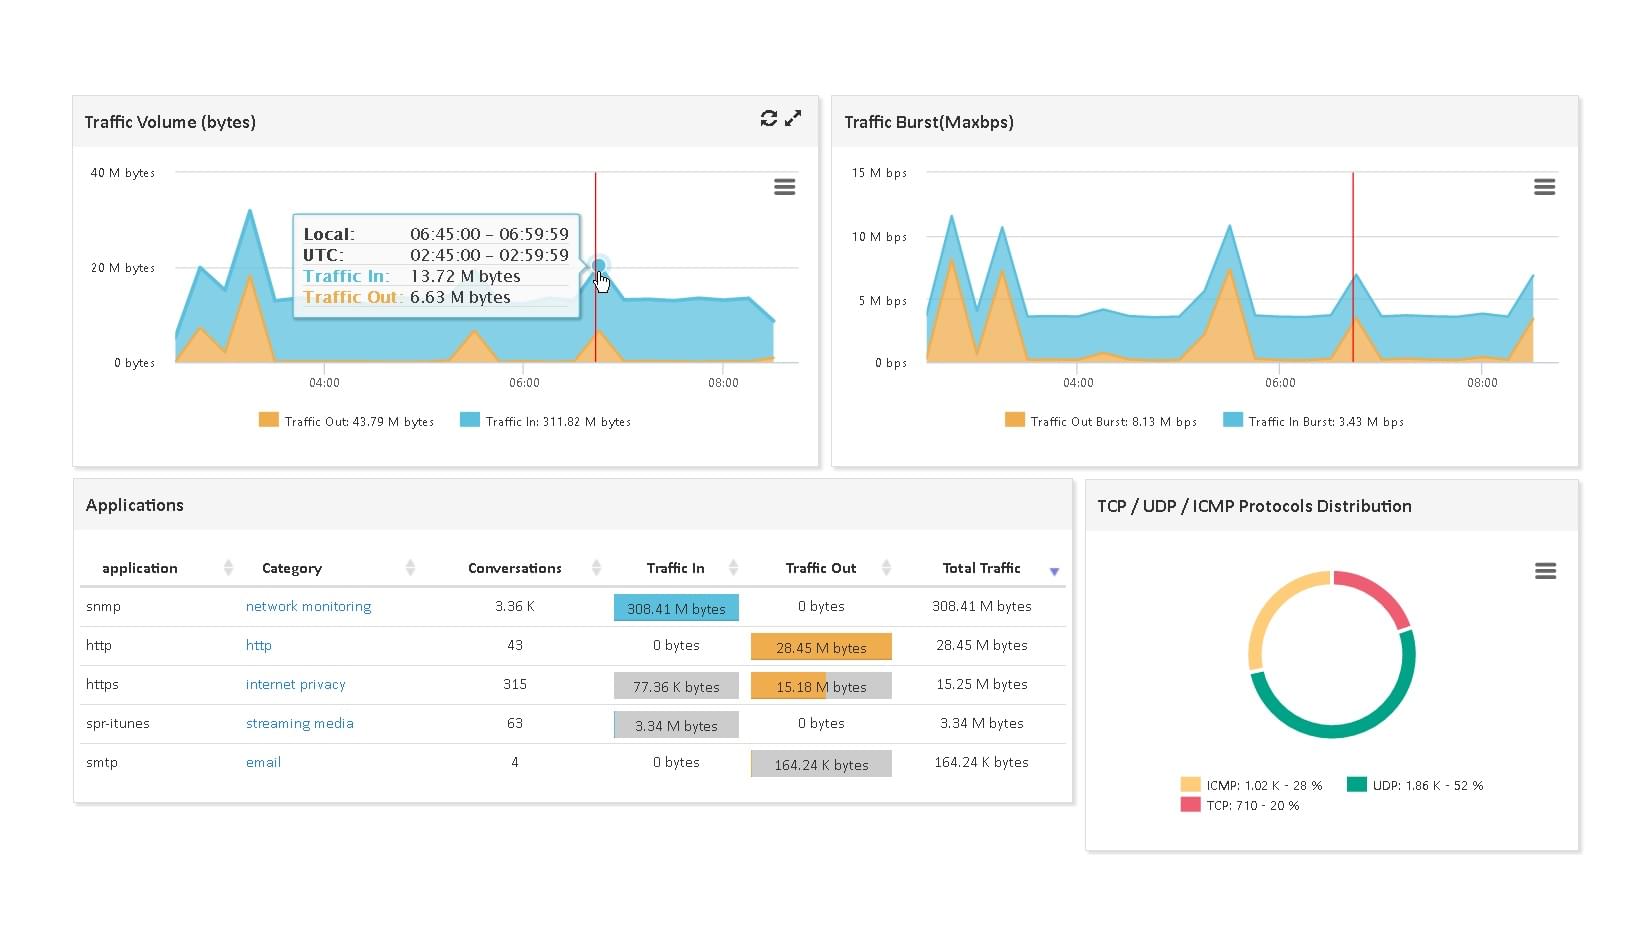
This gathers summarized statistics (min,max,avg...) per Java application such as:
- Requests per minute
- Sum of requests by HTTP return codes and methods
- Number of requests in each response time range
- Established vs. Timed-out requests
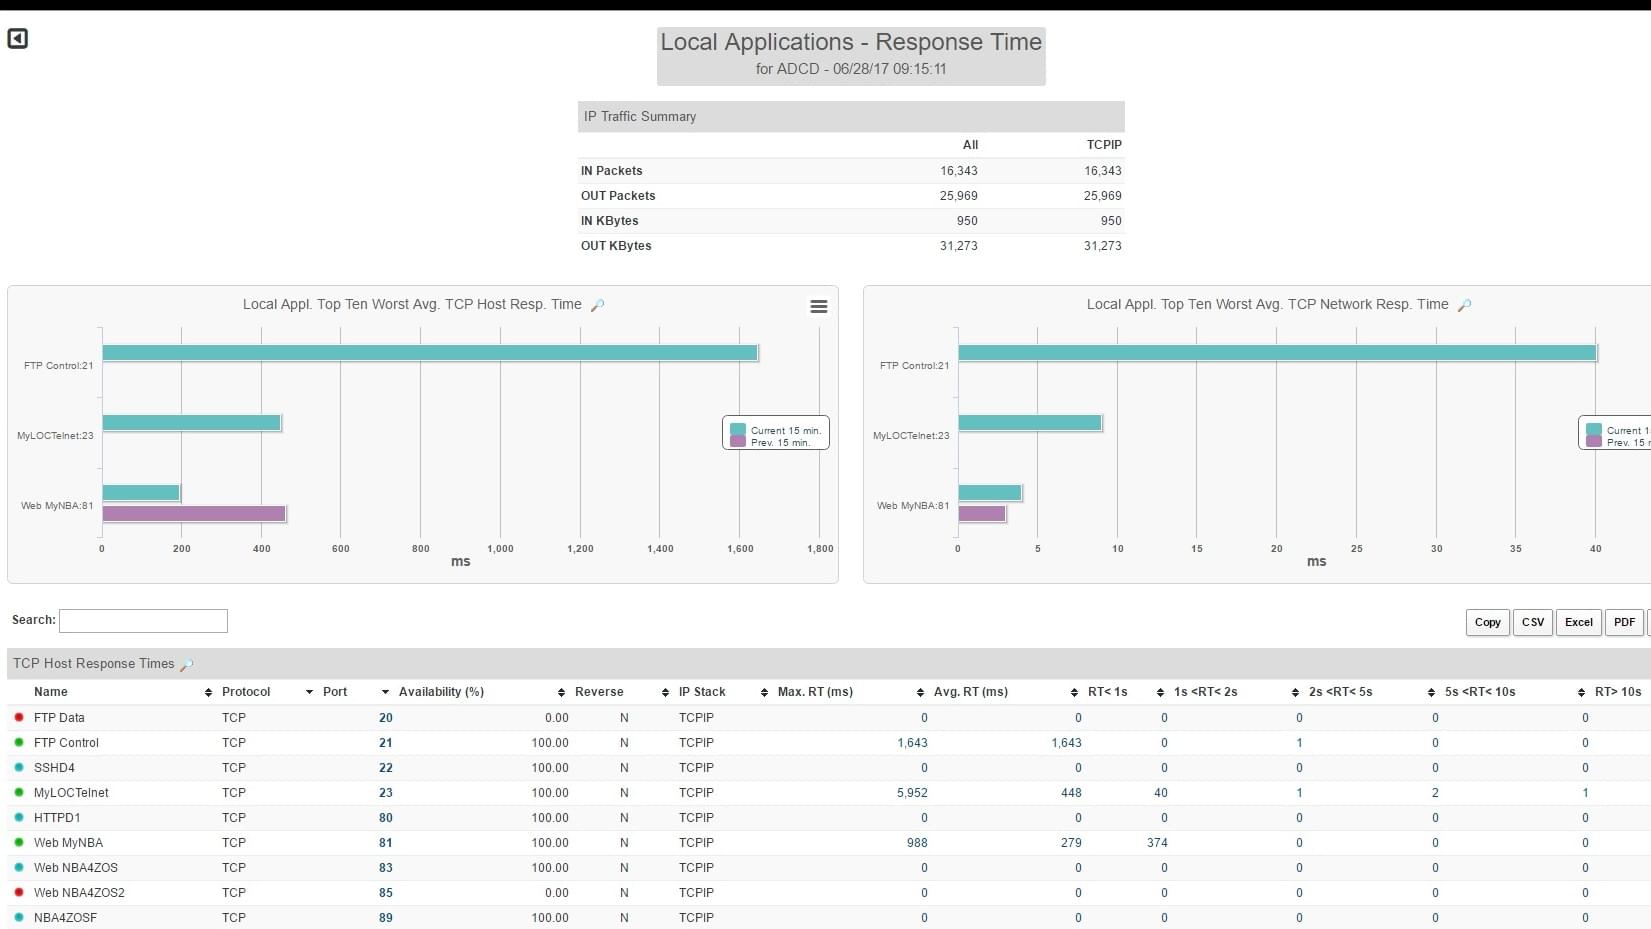
In order to provide deep Java application insights, details collected per request include:
- Host and web page path
- Server and client IP
- Real User Response time
- HTTP Return code and method
- Client country and geolocation for public IPs
How to install a appservice-java resource?
- Use your ServicePilot OnPremise installation or a SaaS account.
- Add a new appservice-java resource via the web interface (
/prmviewsor/prmresources) or via API (/prmpackagespage), the default ServicePilot agent or another agent will be provisioned automatically.
Details of the appservice-java package are located in the
/prmpackagespage of the software.
Benefits
ServicePilot enables you to deliver IT services faster and more securely with automated discovery and advanced monitoring features.
By correlating the technology JAVA APM with APM and infrastructure monitoring, ServicePilot is able to provide a more comprehensive view of an organization's IT environment.
This allows IT teams to quickly identify and diagnose issues that may be impacting application performance, and take corrective action before end-users are affected.
Start with a free trial of our SaaS solution. Explore our plans or contact us to find what works best for you.