All-in-one APM monitoring for databases, servers and applications
How does it work?
ServicePilot discovers and monitors standard SQL databases (Oracle, MySQL, PostgreSQL, MSSQL...) as well as new NoSQL databases (SolR...) in order to collect all key performance indicators (tablespace or index occupancy, blockages, workloads, queries per minute...).
In addition to the KPIs specific to each database technology, the monitoring agent can perform individual SQL queries to collect information, measure response times, .... ServicePilot automatically observes each transaction for databases that perform web queries.
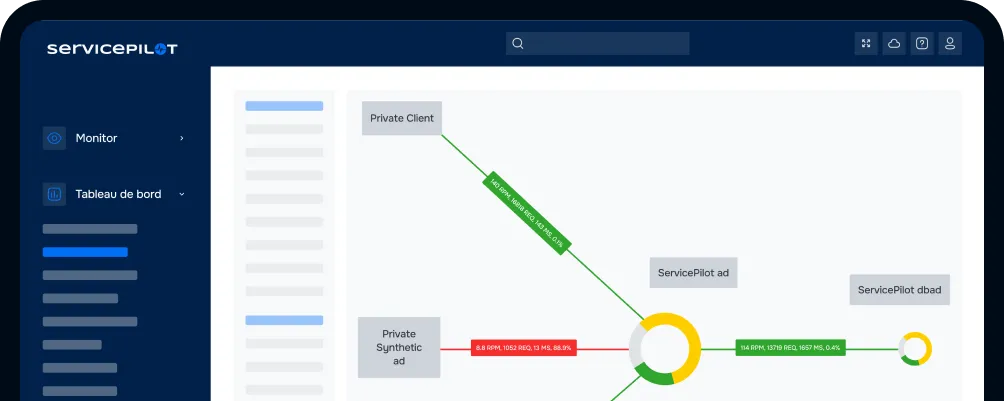
ServicePilot's dashboards, PDF reporting and mapping allow you to analyze monitoring data to quickly visualize key information and provide management with a service health dashboard weather indicators.
With advanced Machine Learning, ServicePilot efficiently identifies unusual availability or performance issues. By significantly cutting down the number of alerts, it allows for quicker diagnosis of problems, focusing your attention on critical incidents. This not only speeds up response times but also lightens the workload for operators.
Experience a monitoring platform that's ready to go in no time and straightforward to set up. ServicePilot is ideal for everything from servers and applications to network infrastructures. It offers automatic or semi-automatic deployment and seamlessly adapts to your IT infrastructure's diverse technologies.
What our users say


Free installation in
a few clicks
SaaS Plateform
- No on-premise software setup, servicing and configuration complexity
- Instant setup, complete and pre-configured to ensure robust monitoring
