Service mapping and application monitoring
Discovery and monitoring of applications
Automatically discover and monitor all applications by observing TCP/UDP service traffic on each server. ServicePilot offers several complementary interfaces to help you make decisions about the performance of your IT services: Automatic live mapping, customised mapping, historical dashboards, live tables with PCAP trace, alerts, PDF reports, Machine Learning...
Learn moreMonitoring and Netflow trafic analysis
Understanding who does what and when on your network infrastructure is critical to aligning bandwidth requirements with applications. By enabling the NetFlow or jFlow protocol on routers and switches, these devices send Layer 3 and Layer 4 information (IP addresses, TCP/UDP ports) of IP traffic. ServicePilot collects this network information using Netflow, jFlow or other protocols to create protocol distribution and flow matrix reports and to understand in detail the use of network resources. With ServicePilot, network flow analysis is simple and allows you to size your infrastructure by just analyzing a few dashboards.
Learn more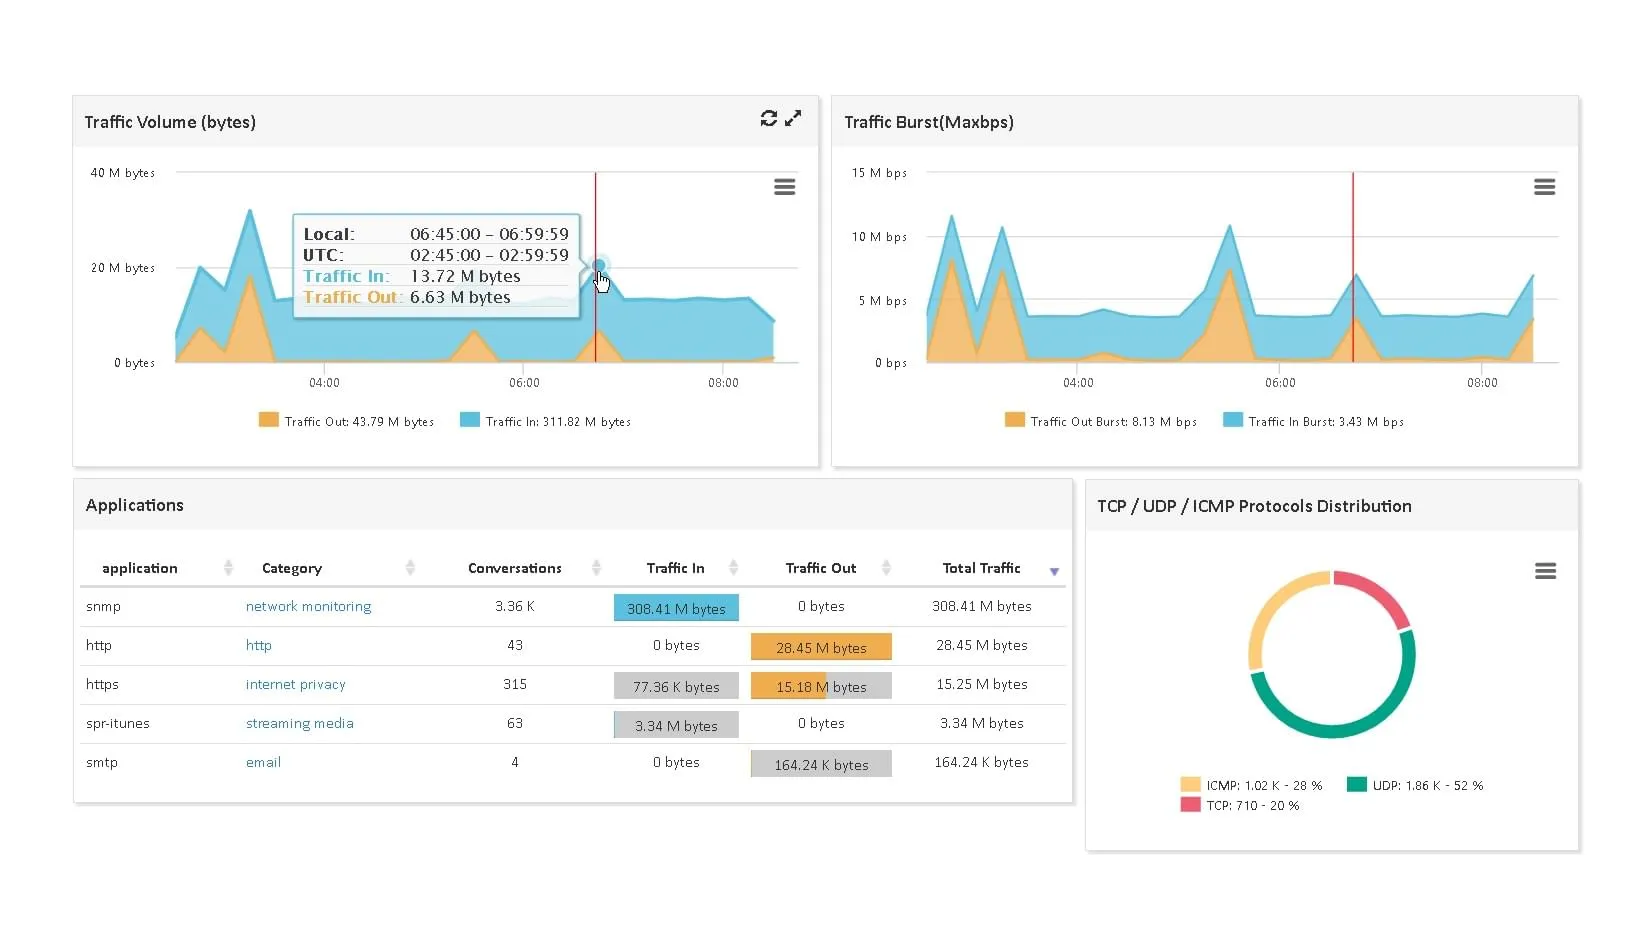
IBM z/OS Mainframe flow traces
ServicePilot NBA for z/OS is an easy-to-use, easy-to-deploy product that provides you with a comprehensive view of IP traffic. It allows you an end-to-end and real time monitoring of the network and application performance in a IBM z/OS environment. NBA for z/OS captures flows from traffic, analyzes them and issues alerts on abnormal network behavior, such as poor application response times or excessive bandwidth consumption. This innovative tool uses Deep Packet Inspection (DPI) technology. Network and host indicators are collected in detail to accelerate problem identification and resolution while minimizing the risk of potential outages. The tool correlates and consolidates complex transactions by presenting them in intuitive reports with the ability to review detailed statistics.
Learn more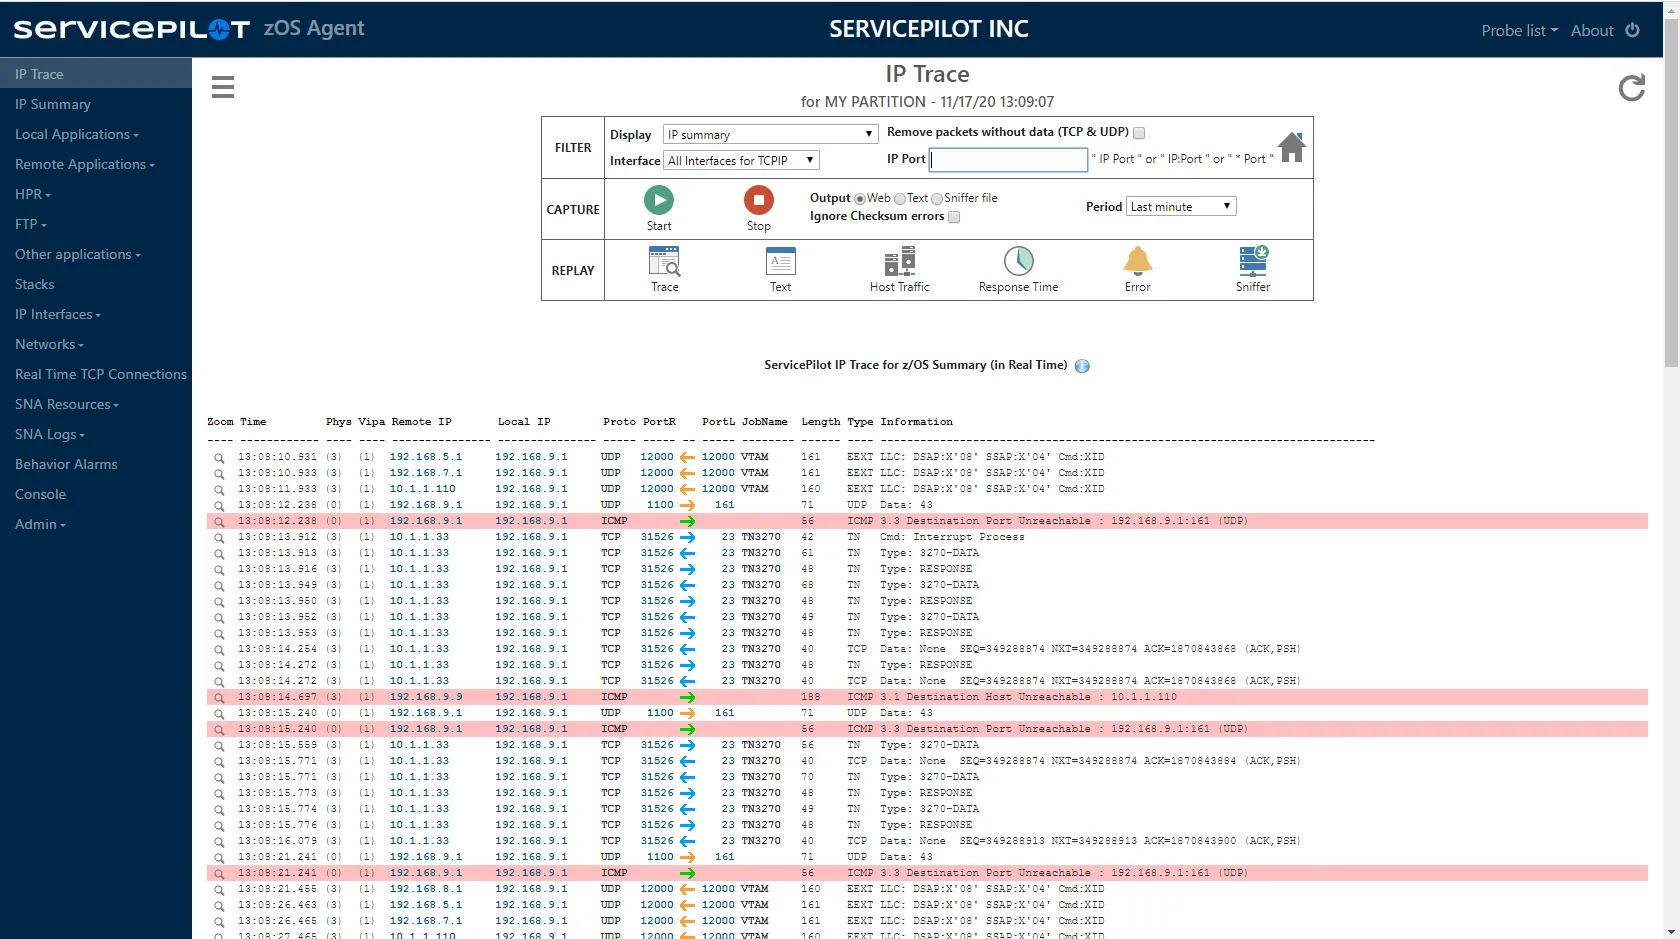
Collecting Netflow flows produces a network map of applications: this helps with decision-making.
WHO uses the bandwidth? Access to our remote sites is all too often SATURATED.
Real-time flow collection
Use the Netflow, jflow, ... collector or directly collect network interface flows from your servers and mainframes. Network flow analysis gives you visibility of the behavior and the performance of your applications.
Discovery of applications and servers
Analyze application flows and automatically monitor applications and servers in interactive maps and dashboards.
Identification of critical applications
Identify at a glance the TCP indicators of critical applications, traffic volumes and the most heavily loaded servers to understand service degradation.
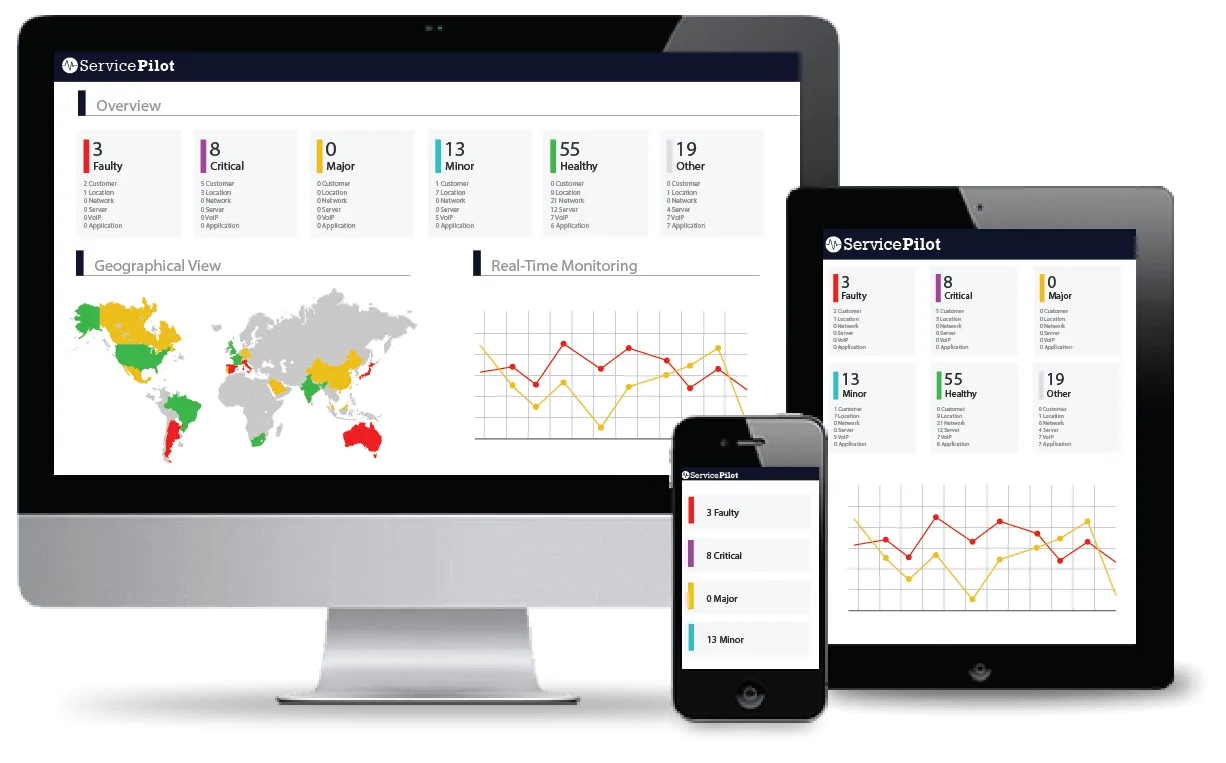
The power of an end-to-end monitoring solution
Add the monitoring of servers and networks with applications to get the end-to-end vision you need to understand the service delivered to users and to locate incidents.
Free installation in
a few clicks
SaaS Plateform
- No on-premise software setup, servicing and configuration complexity
- Instant setup, complete and pre-configured to ensure robust monitoring
OnPremise Plateform
- Contracts and commitments over time ( > 1 year)
- Performance, Data Storage and Infrastructure Management
- 2 additional solutions: VoIP and Mainframe monitoring
