IBM z/OS Mainframe Network Observability
Plug-and-play Mainframe TCP/IP Packet Tracing
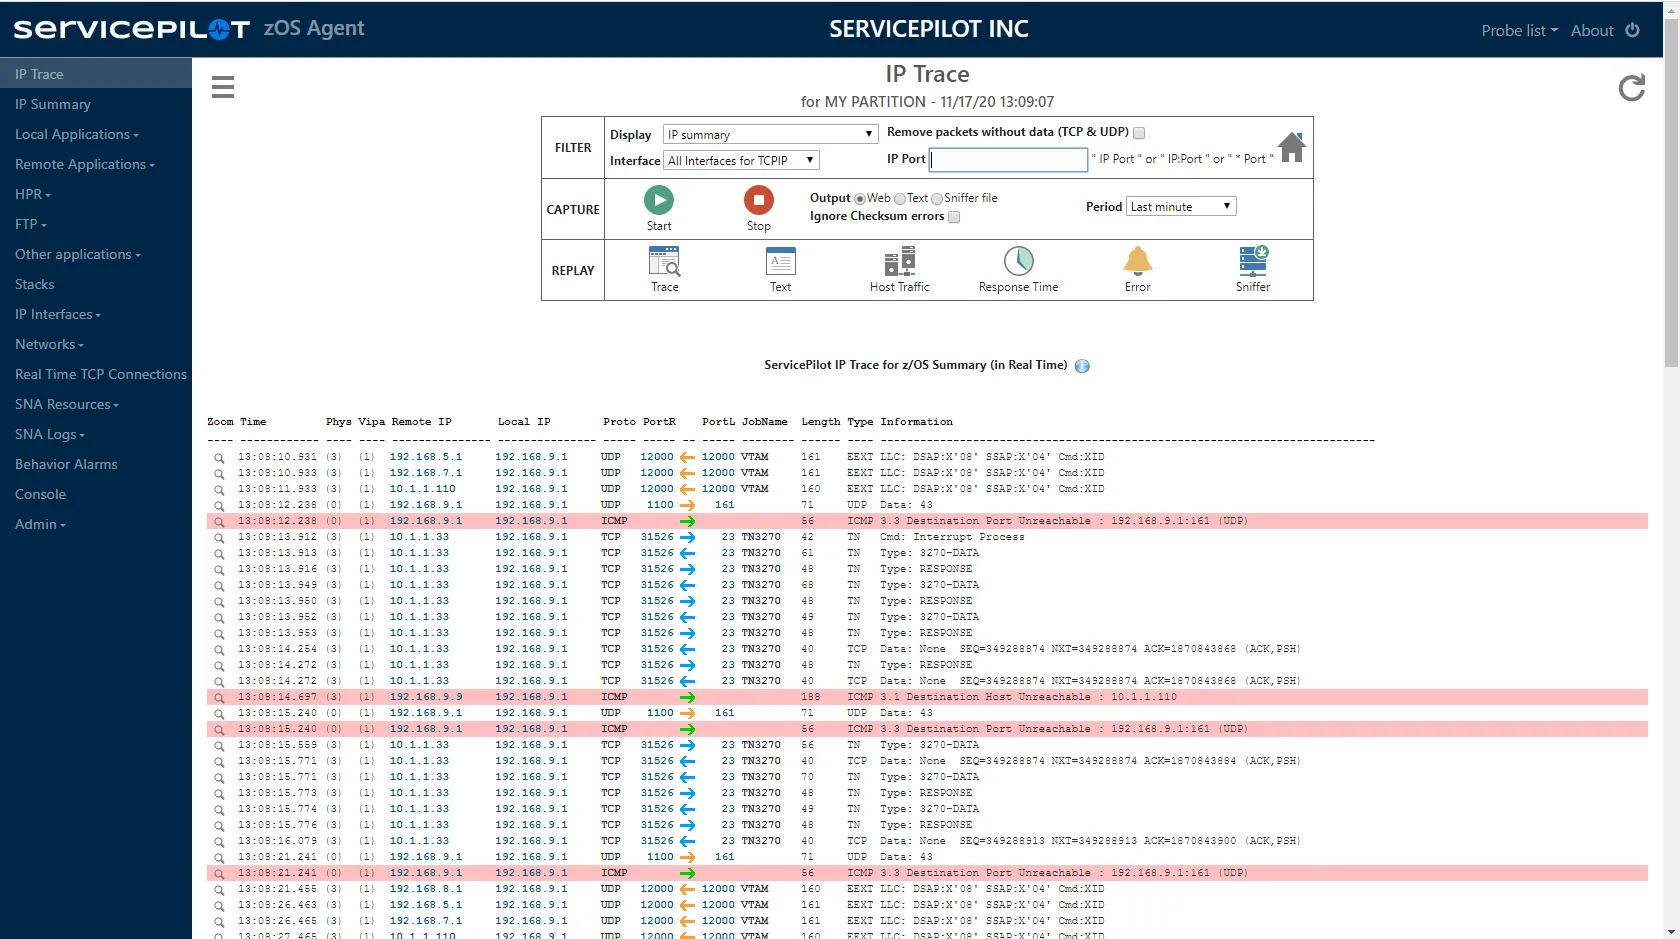
Experience the ease of z/OS mainframe network performance analysis with our plug-and-play TCP/IP Packet Tracing solution. A single click in a modern web interface starts a trace on the mainframe, capturing all the IP traffic flowing through the IP dataspace. It offers invaluable insights into your IBM mainframe's connectivity and network efficiency.
RACF compliant and supporting multiple IP stacks, traffic can be viewed while the trace is running, or once it has been archived. A user-friendly interface displays meaningful presentations of the trace with filtering feature on IP address, port number, interface. Trace data can also be saved in PCAP or text format for 3rd party tool analysis.
- Effortless Setup: Configure under 2 minutes, quick start-up
- Immediate Value: Real-time analytics with visual presentations
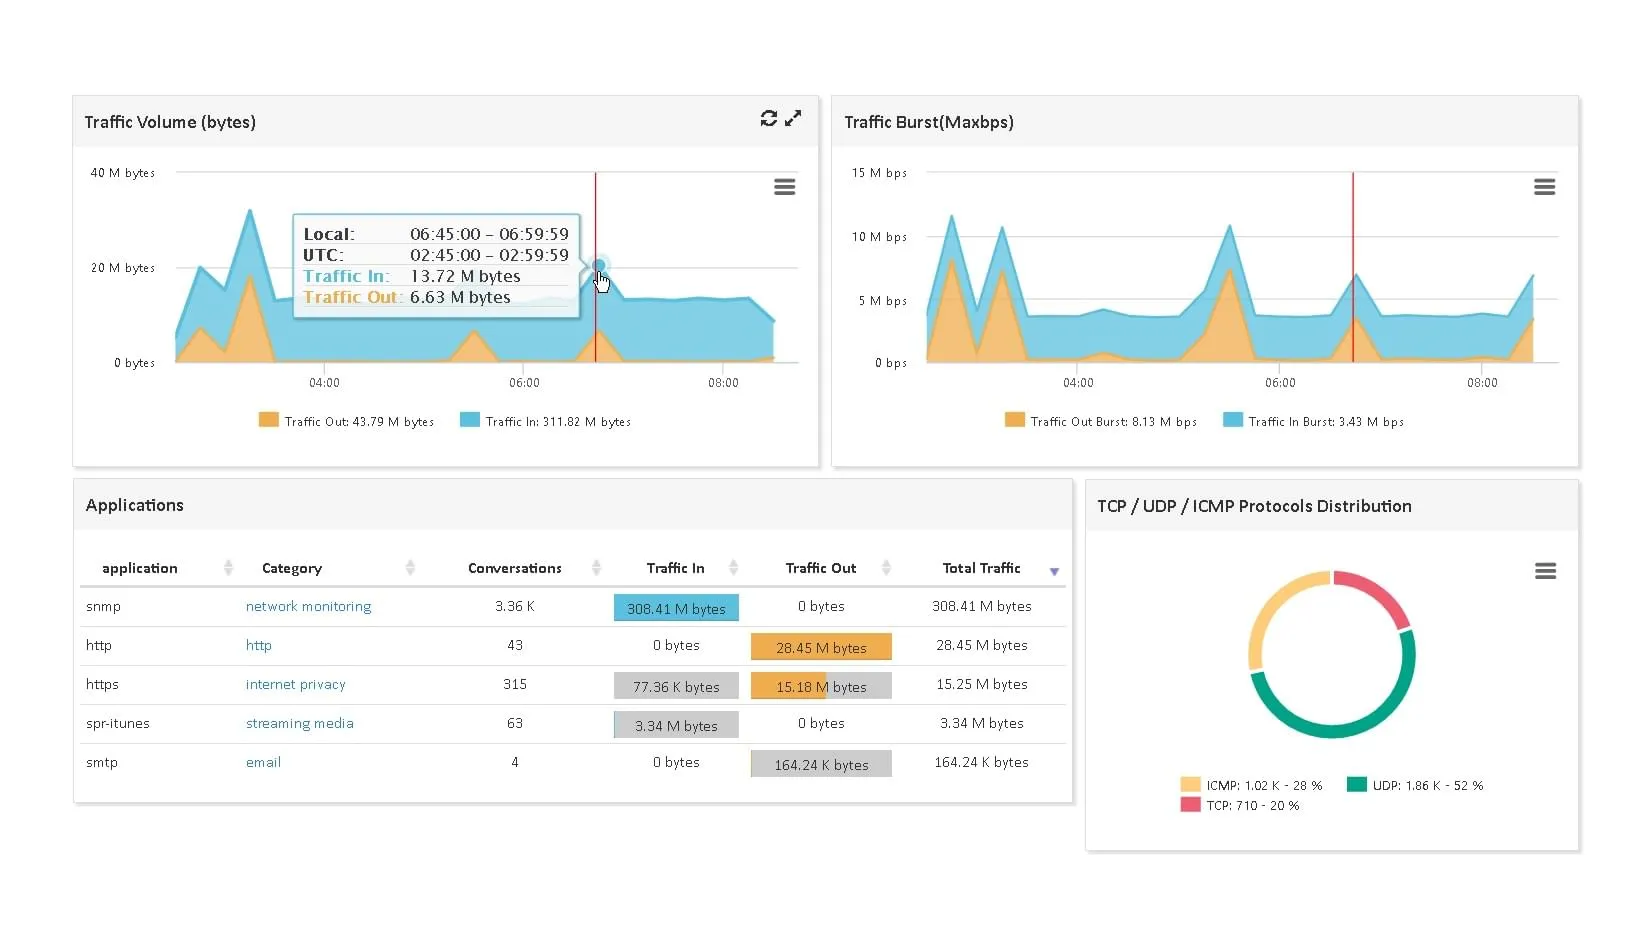
Detailed z/OS Data Analytics to Improve Performance
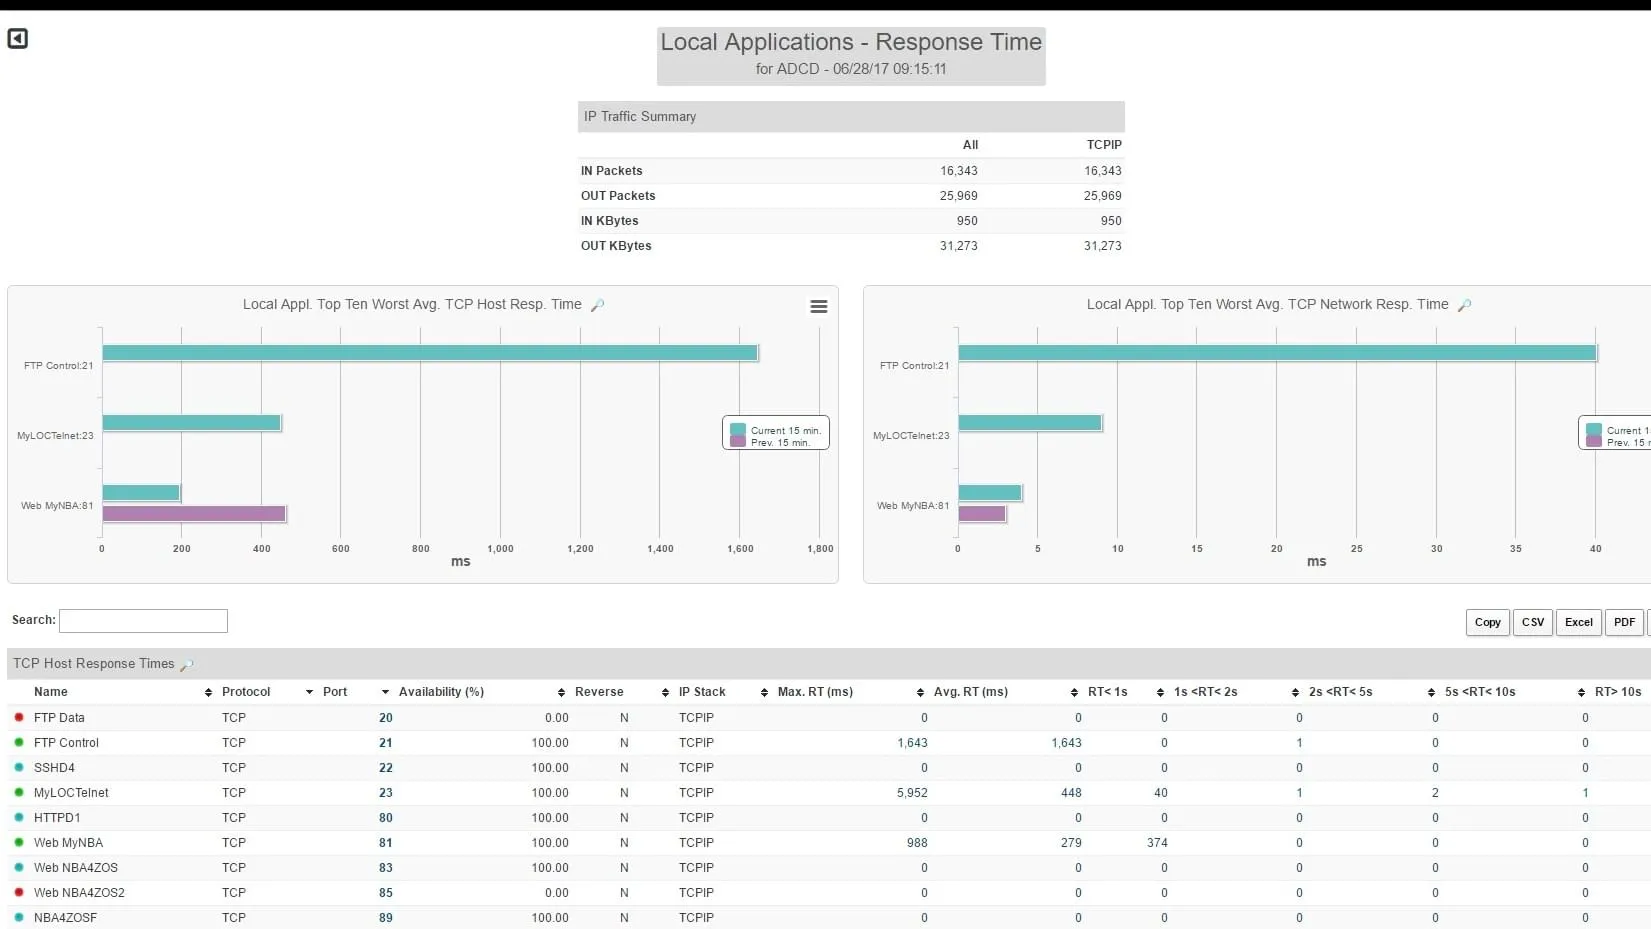
Unlock the full potential of your IBM mainframe data with NBA for z/OS. This advanced version supports z/OS latest releases and provides comprehensive data analytics, tailored to enhance the performance and efficiency of your z/OS environment. Dive deep into detailed metrics and leverage these insights for strategic decision-making.
Our solution can decode many high-level protocols (such as HTTP, SMTP, FTP, Enterprise Extender (EE), Telnet or MQSeries), gather detailed network statistics and provide individual socket details. The combination of network and application data helps ensure the IT team can promptly address potential issues or bottlenecks.
- In-depth Metrics: Wide range of performance data, allowing for thorough analysis and optimization
- NBA for z/OS: Tailored to your specific needs, the most relevant information at your fingertips
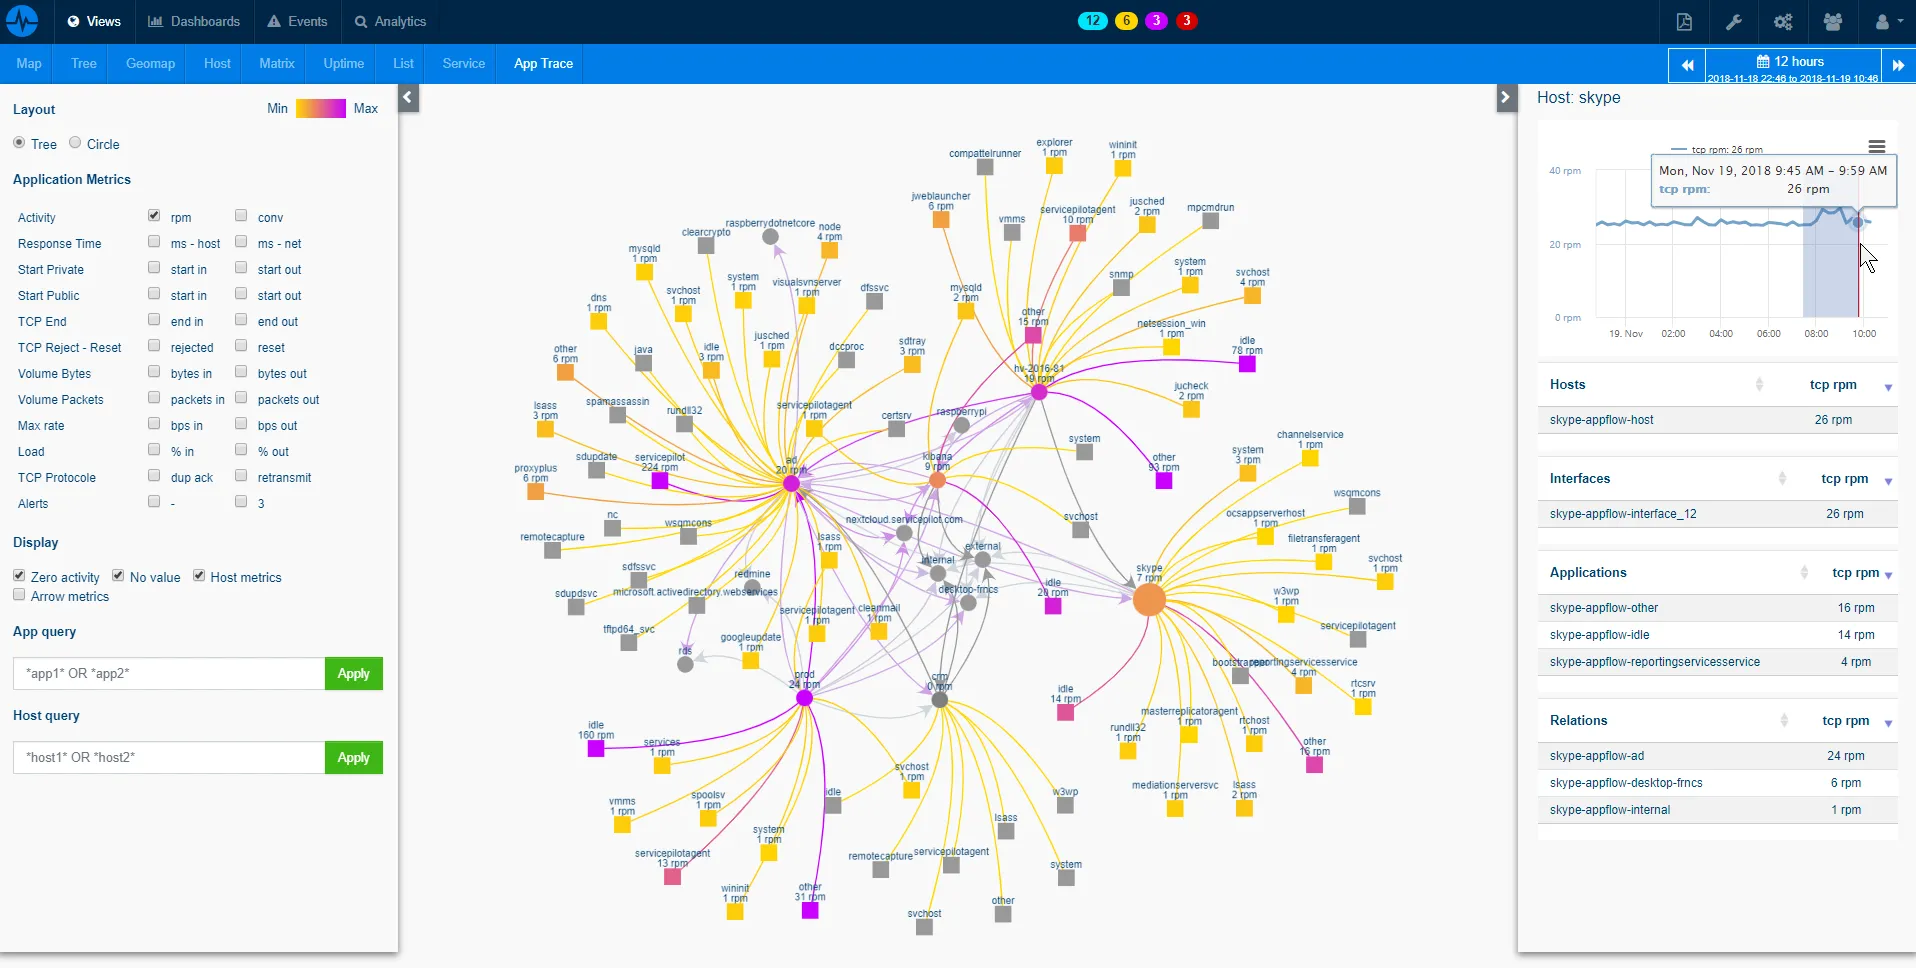
Dynamic Observability with Automatic Dependency Maps
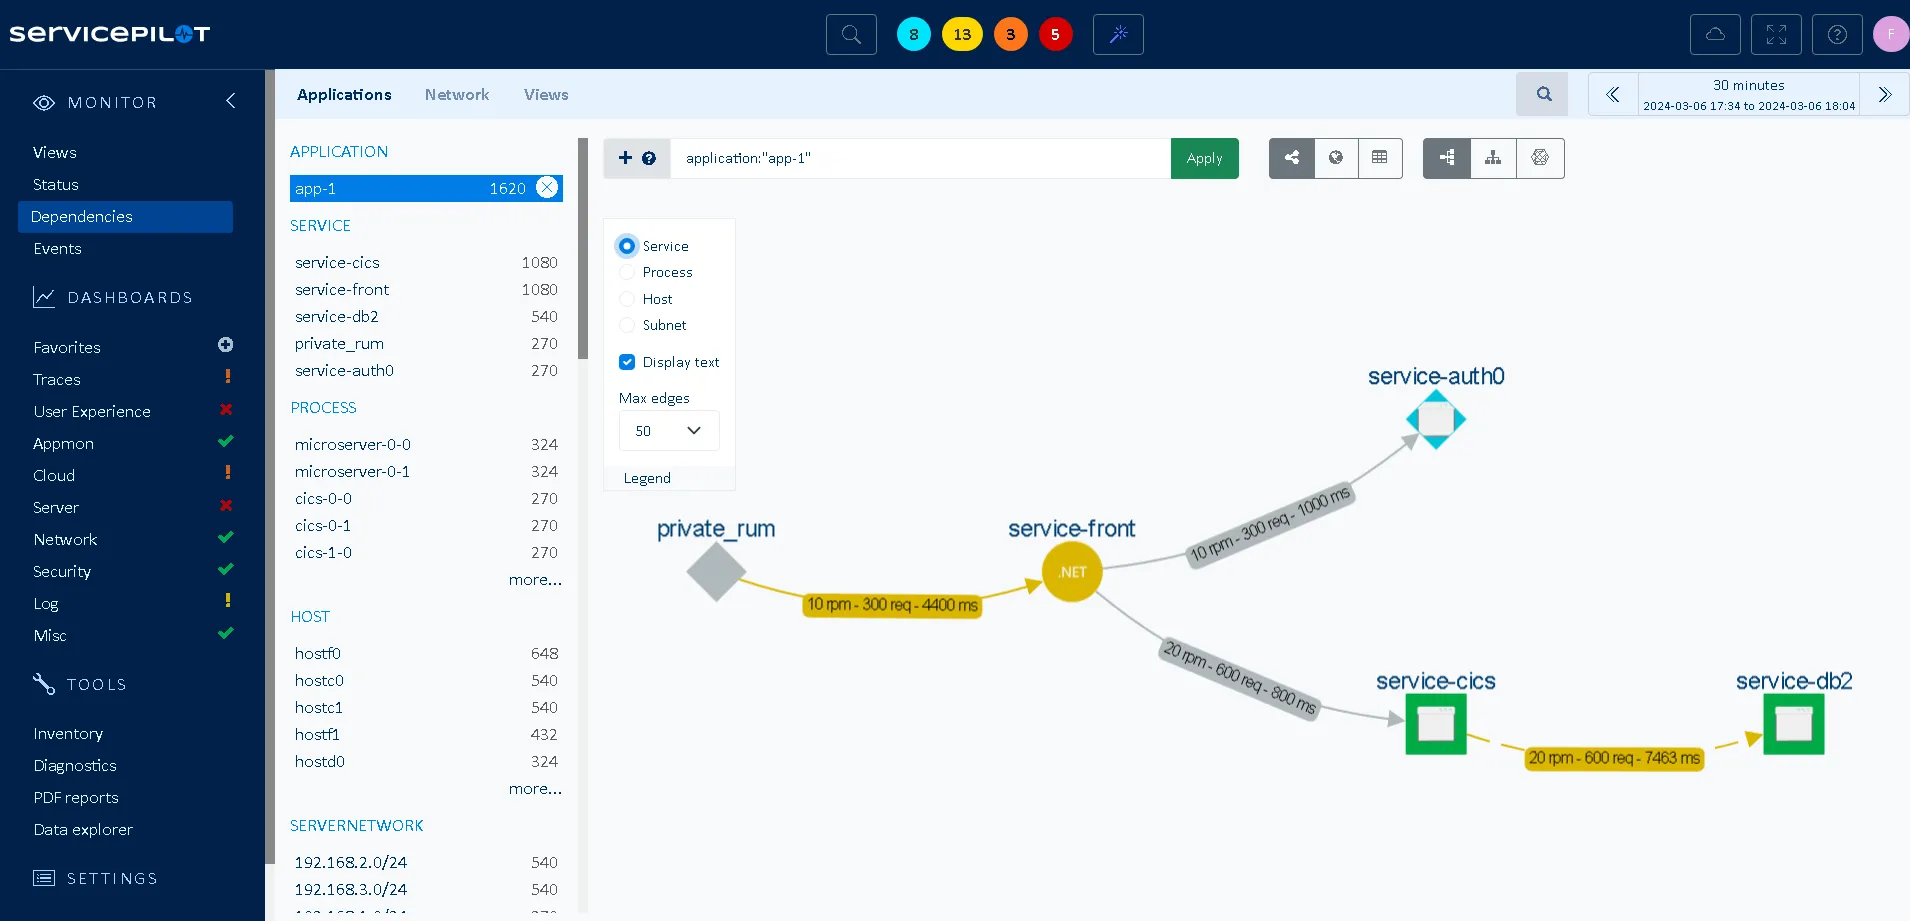
Discover the power of dynamic observability with our automatic dependency mapping feature. By automatically mapping relationships between applications, databases and network components, it enables quick identification of performance bottlenecks and optimization opportunities.
This dynamic observability is crucial for maintaining a high-performing, agile mainframe environment, especially in complex systems involving application components like CICS, DB2, etc. Our automatic dependency maps provide a visual representation of your system's components and their interconnections. It offers an easy way to understand and monitor your mainframe environment more effectively.
- Visual System Overview: Instantly grasp the structure and status of your mainframe components through a clear, graphical interface
- Proactive Management: Use the dependency maps to anticipate issues and optimize system interactions for better performance
Automated Root Cause Analysis
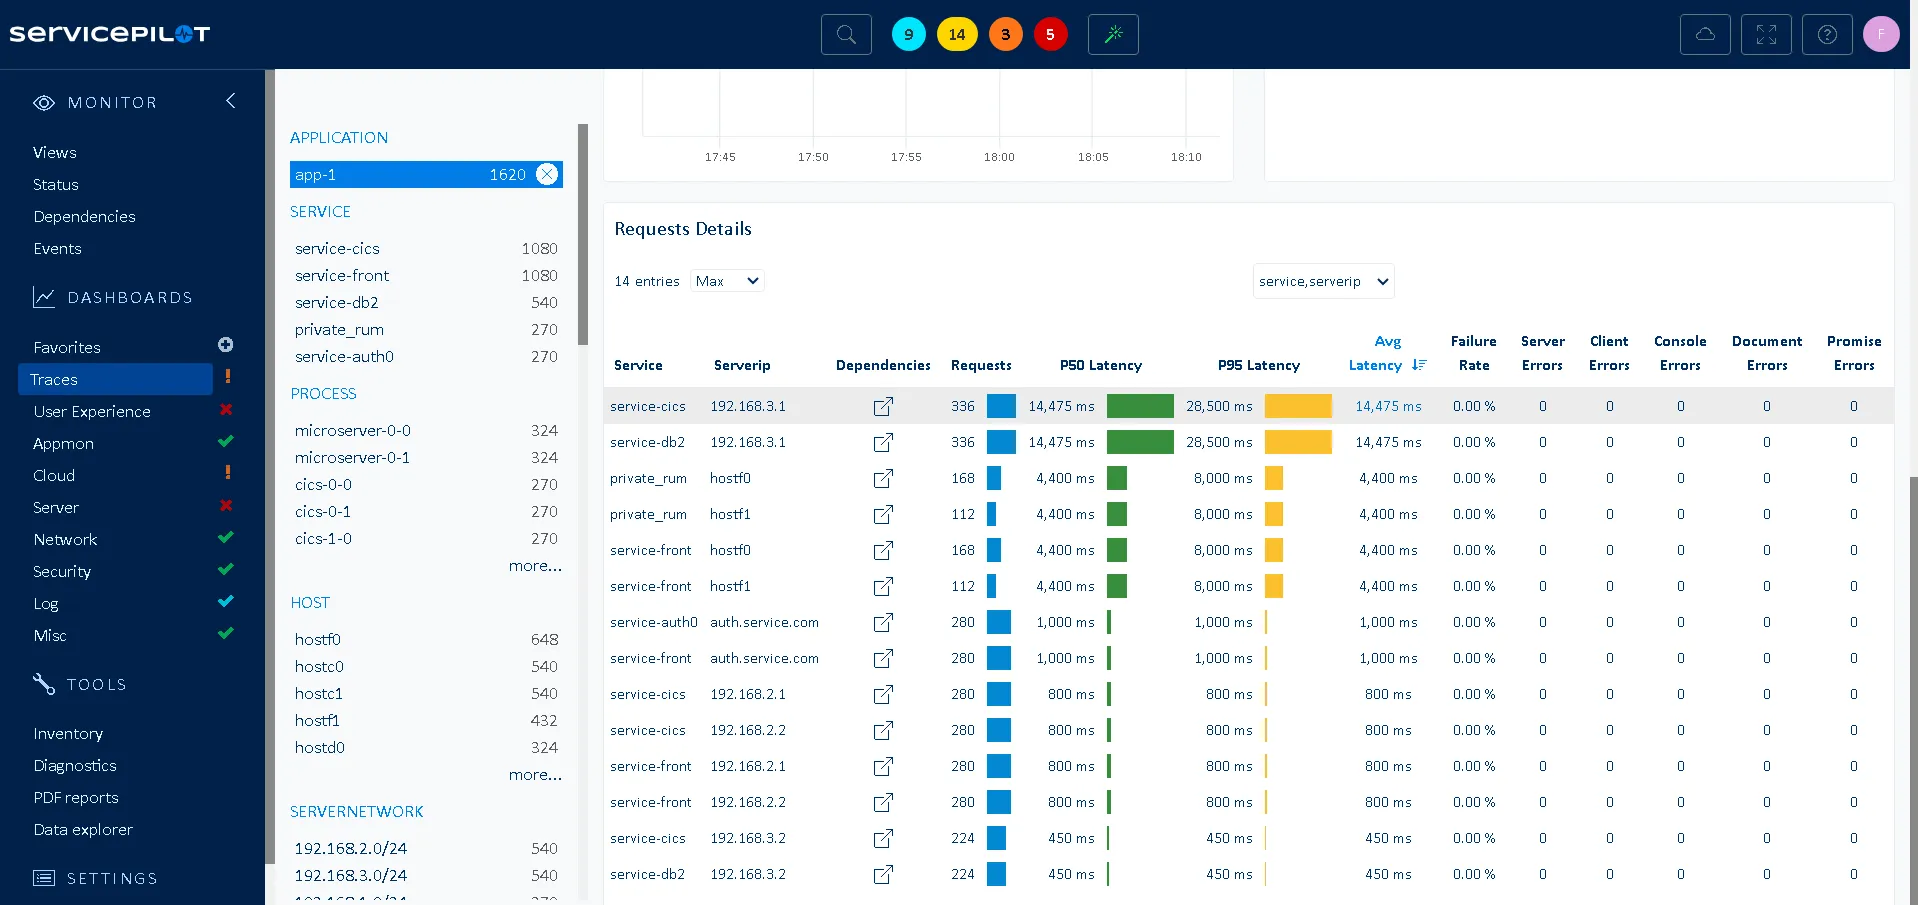
Accelerate issue resolution with our automated Root Cause Analysis (RCA) feature. It offers a quick way to identify the source of problems within your mainframe environment, significantly reducing the time needed for diagnostics and enhancing system reliability.
Centralizing data in ServicePilot allows you to make informed decisions quickly and keep your system running smoothly. It quickly pinpoints anomalies and inefficiencies, whether in transaction processing or database operations. Especially effective in large z/OS environments, targeting the right host and component causing the performance degradation helps minimize impact on critical mainframe operations and maintain continuous system performance.
- Quick Problem Identification: Automatically pinpoint the root cause of issues, saving valuable time and resources
- Informed Decision-Making: With clear insights into the underlying causes, take effective and timely actions to resolve problems
We take a close look at the performance of our applications: to acquire a real vision of the quality of service, to better understand and to have a historical statistical record
Observability made easy for complex mainframe environments
Intuitive and User-friendly
Our top-down dashboards offer a comprehensive overview at a glance, with detailed information accessible in a single click. ServicePilot NBA for z/OS is easy to use, requiring no specialized training.
Dashboards and PDF reports
Our dashboards and reports can be fully customized to match your environment, ensuring a personalized and efficient monitoring solution.
Automatic APM maps
We provide end-to-end, real-time and historical performance mapping of your z/OS application environment.
Alerting, ML and AI
ServicePilot NBA for z/OS captures, analyzes and alerts on abnormal network behaviors such as poor application response time or bandwidth issues.
Application trace APM integration
Other Application trace APM Solutions
Free installation in
a few clicks
SaaS Plateform
- No on-premise software setup, servicing and configuration complexity
- Instant setup, complete and pre-configured to ensure robust monitoring
OnPremise Plateform
- Contracts and commitments over time ( > 1 year)
- Performance, Data Storage and Infrastructure Management
- 2 additional solutions: VoIP and Mainframe monitoring
