Improve your Monitoring with Comprehensive Dashboards
Extensive Integrated Dashboards for Comprehensive Monitoring
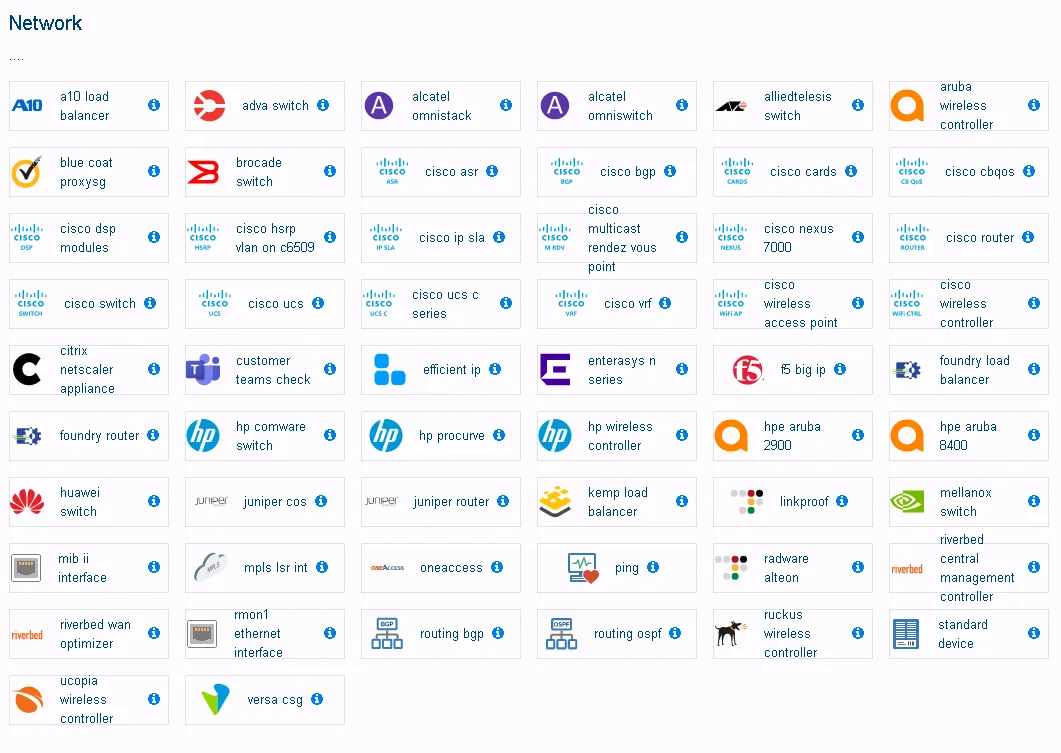
ServicePilot's Dashboard feature provides over 500 built-in and standard automatic dashboards, each meticulously designed for various monitoring needs. From basic analytics to complex data visualizations, these dashboards cover an extensive range of metrics and scenarios.
Users can easily navigate through a wealth of information, ensuring they have all the necessary tools at their disposal for effective monitoring and analysis.
- Plug-and-Play Functionality: Access a wide array of dashboards instantly, tailored for numerous monitoring scenarios
- Comprehensive Coverage: Each dashboard is designed to provide detailed insights, catering to specific monitoring requirements
Easy Customization with a Flexible Visual Editor
Modify any standard dashboard with ease using ServicePilot's versatile widget library. This flexibility allows you to tailor your monitoring experience to your specific needs.
Whether it's adding new metrics, changing visualizations, or integrating unique data points, our widget library makes customization straightforward and user-friendly.
- Intuitive Customization: Easily modify dashboards with a drag-and-drop interface
- Diverse Widget Library: A vast selection of widgets to choose from, ensuring you can display your data precisely how you need it
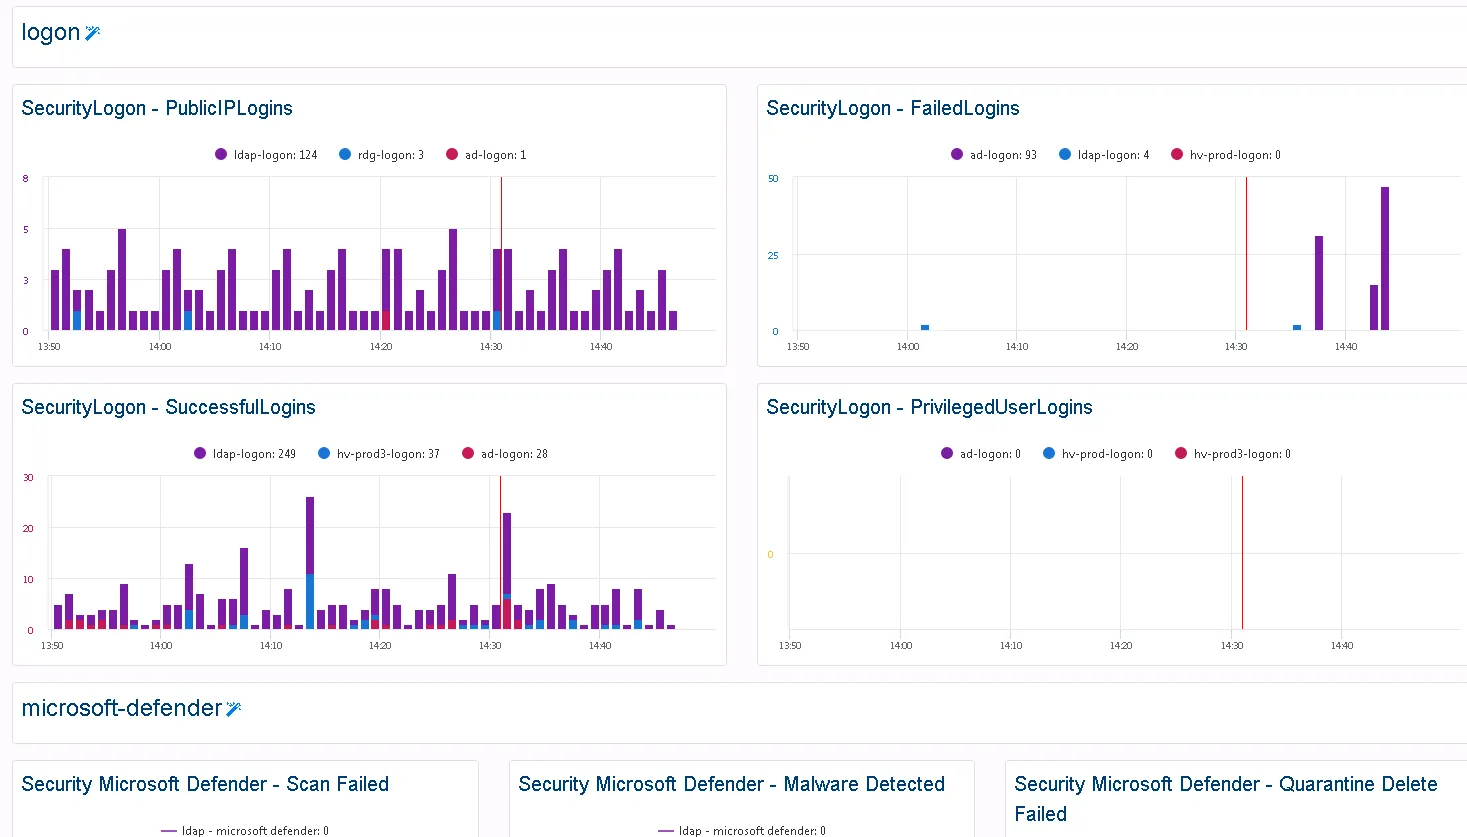
Advanced Data Analytics with Custom Widgets
For specialized data analytics and visualization needs, ServicePilot offers custom widgets. These widgets enable you to dive deep into your custom data, presenting it in an insightful and meaningful way.
Whether unique KPIs, specialized data points, or complex analytics, these custom widgets enhance your data visualization capabilities significantly.
- Tailored Analytics: Create widgets for specific data types, offering deeper insights into your unique datasets
- Versatile Visualization: Present your data in various formats, from simple charts to complex graphs, aligning with your analytical needs
Disparate Source Correlation in Specialized Dashboards
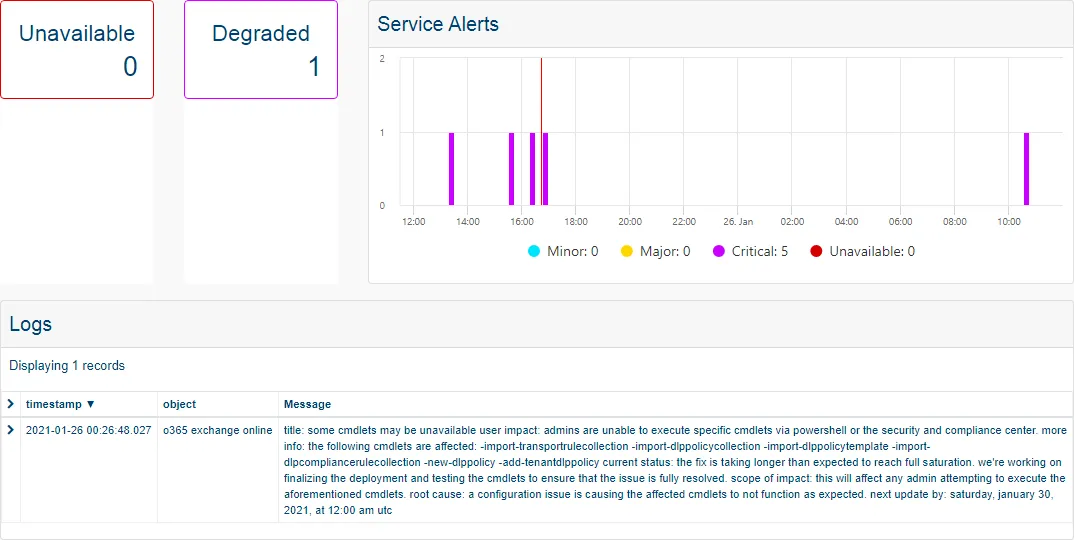
ServicePilot elevates application monitoring by offering specialized dashboards, like the Application dashboard divided into three integral parts: APM, System and Logs. This tripartite structure provides a comprehensive view of your application's performance, system health and log data in a single dashboard.
This holistic approach simplifies monitoring and can be applied to other solutions (network device SNMP + NetFlow + Syslogs or Site Network + Infra + Applications, etc.) making it more efficient and effective.
- Integrated Monitoring Experience: Combine different aspects of application monitoring in one streamlined dashboard
- Enhanced Operational Insights: Get a 360-degree view of your application's health, from performance metrics and traces to system logs
Free installation in
a few clicks
SaaS Plateform
- No on-premise software setup, servicing and configuration complexity
- Instant setup, complete and pre-configured to ensure robust monitoring
OnPremise Plateform
- Contracts and commitments over time ( > 1 year)
- Performance, Data Storage and Infrastructure Management
- 2 additional solutions: VoIP and Mainframe monitoring
