Sovereign GenAI: Securing DevOps diagnosis
GenAI: Transforming observability into operational diagnosis
Observability platforms can collect vast amounts of data. They enable users to measure latency, trace distributed paths, collect logs, monitor Kubernetes pods, analyze TCP connections and map dependencies between components.
However, during an incident, an engineer does not need to consult a multitude of charts. They need a clear answer to a simple question: Why did this service slow down and what should we do now?
Even though the question is simple, it is essential to understand the context:
- What happened
- When it happened
- Which users or services are affected
- What is the most likely cause
- Which actions are a priority
- How much confidence can be placed in the diagnosis
Generative AI can play a pivotal role in this transformation. By leveraging collected data and causal analysis, it can explain an incident in natural language, summarize its impact and suggest next steps.
However, observability data is particularly sensitive. It can reveal network topology, the names of critical applications, internal dependencies, traffic volumes and infrastructure characteristics. Sending this data to an external service can therefore raise concerns about security, compliance and sovereignty. On-premise or edge AI provides a solution to this challenge. The language model, observability data and analysis context can remain within the enterprise environment, while still providing a conversational interface for technical teams.
A LLM is not a causality engine
It is important to distinguish between two functions. The observability and analytics engine must establish the facts:
- Observed metrics
- Events
- Dependencies
- Changes
- Correlations
- Causal hypotheses
The language model can then transform these results into plain language. This distinction limits the risk of a plausible but incorrect response. The LLM must not invent a cause based on a simple summary. It must rely on the data and relationships produced by the analytical engine.
A robust architecture can therefore follow this flowchart: Telemetry → Normalization and Enrichment → Topological Correlation → Anomaly Detection → Causal Analysis → Structured Context → Local LLM → Natural Language Diagnosis.
The generative model then serves as an interface for understanding and interaction. It does not replace either the observability data or the mechanisms that analyze it.
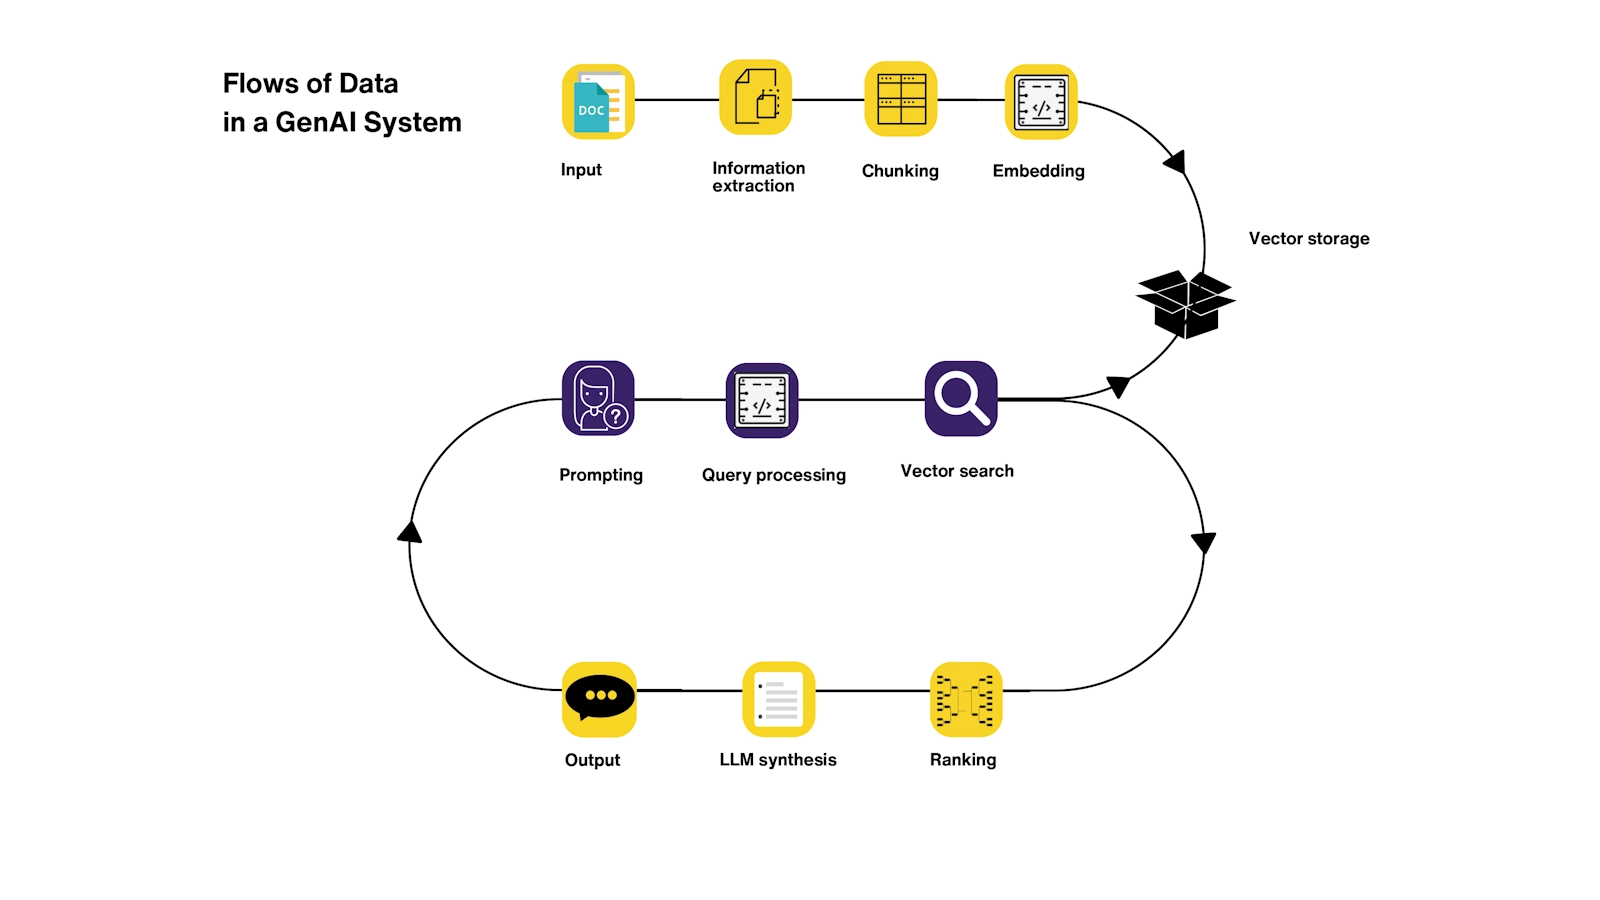
Providing the model with verifiable context using RAG
A RAG (Retrieval-Augmented Generation) approach involves selecting information that is relevant at the time of responding, rather than relying solely on the model's general knowledge. The context may include:
- The current incident and associated metrics
- The affected resources and services
- Relevant topological relationships
- Recent changes
- Internal procedures
- Approved recommendations
A RAG can help ground the response in context-specific information. However, it does not, on its own, guarantee the accuracy of the diagnosis. Quality depends, in particular, on the relevance, recency and consistency of the data collected.
To facilitate verification, a response should clearly distinguish between observations (directly observed data), hypotheses (possible explanations, accompanied by supporting evidence), missing information (verifications needed to reach a conclusion) and proposed actions (next steps, along with their potential risks). This presentation helps the operator evaluate the response rather than treating it as an indisputable conclusion.
Deploy locally: Control the scope of processing
Observability data can reveal network topology, versions of critical applications, internal addresses, dependencies between services, customer information and more. Depending on the organization's policies, transferring this data to an external service may raise concerns regarding security, compliance and data control.
An on-premises or edge deployment allows the language model and the context used to generate responses to be processed locally. This can reduce reliance on an external service for each request and keep processing within an environment controlled by the company.
With laws such as the American FISA Section 702, however, the term "local" is not sufficient to describe the full scope of control. It is also necessary to examine data collection, transmission, storage, indexing, access management, logging, updates and dependencies on third-party components. Sovereignty therefore depends on the architecture and its governance as a whole, not solely on where the model is executed.
Beyond isolating the processing of sensitive data, a local GPU infrastructure can be used to:
- Serve the language model
- Accelerate response generation
- Analyze large volumes of context
- Maintain low latency
- Reduce ongoing costs
Integrating on-premise GenAI into the observability pipeline
Deploying an on-premises model involves more than just installing an LLM on a GPU-equipped server. It requires organizing the interactions between the observability platform, the analytics components and the assistant, while determining which data the assistant can access and which operations it is authorized to perform.
An architecture can separate these responsibilities into several components: the platform collects and normalizes telemetry, detection and correlation engines identify relevant signals, a search layer selects data relevant to the query, and finally, the on-premises model formulates a response based on this context. This separation facilitates the evolution of each component and prevents the model from being tasked with duties for which it is not designed, such as establishing causality on its own from raw data.
The scope of the assistant must also be defined. Depending on the needs, it can access incidents, metrics, recent changes or internal procedures. Access can be restricted by role, department or environment, so that a response does not reveal information to which the user does not have access in standard operational tools. Logging and credential management must adhere to the same requirements as for the platform's other components.
The decision to deploy locally also affects operations. The team must plan for the availability of the inference service, model version management, updates, monitoring of GPU usage and fallback mechanisms in case the assistant becomes unavailable. In the event of an incident, the assistant should not become a new point of failure: standard diagnosis tools must remain accessible.
Finally, integration can be done gradually. One can start with a read-only assistant that summarizes verifiable information and suggests lines of investigation. Once its quality has been evaluated on representative incidents, it can be integrated into operational procedures and eventually authorized to trigger certain controlled actions. High-impact operations, such as restarting a service, moving pods or modifying a configuration, can remain subject to human validation.
The local model then becomes a building block of a controlled AIOps architecture, rather than a standalone solution. Its value depends as much on the quality of the data and access controls as it does on the model itself.
Sizing the model and infrastructure
A model with approximately 24 billion parameters can be considered for technical diagnosis tasks, subject to testing in the target environment. Its performance will depend on quantization, context length, the quality of the data provided and the available computing power.
Model size is just one factor among many. A more compact model, fed with relevant and up-to-date information, may be more useful than a larger model receiving incomplete context.
The sizing of a GPU infrastructure depends, in particular, on:
- The size and quantization of the model
- The context length
- The number of concurrent users and requests
- The available video memory
- The expected response time
- Availability and scalability requirements
Performance must be measured using representative use cases: type of queries, volume of data retrieved, number of users, latency and quality of responses. Without these metrics, hardware configuration alone cannot predict the operational experience.
Data sovereignty is therefore not limited to installing a local model. It requires control over the entire chain: Collection → Transport → Storage → Indexing → Analysis → On-premises model → DevOps interface.
AIOps: From detection to remediation
The ultimate goal of AIOps is not merely to produce a diagnosis. It is to reduce the time required to restore service when an incident occurs.
A complete operational loop can be represented as follows: Observe → Detect → Correlate → Troubleshoot → Decide → Act → Verify.
In a network contention scenario, the platform can detect an increase in retransmissions, identify the affected services and pods and then correlate these signals with the topology and recent events. The assistant can summarize the available information, propose a hypothesis and suggest the checks to be performed.
After an intervention, the same metrics can help verify whether the situation is improving. Remediation can be manual, semi-automated or automated, depending on the level of risk and confidence. For actions with a significant impact, human validation is generally recommended: moving pods, for example, may resolve contention on one node while creating it on another.
Safeguards complement this approach: access rights control, logging of requests and actions, regular evaluation of responses, limitations on automated actions and the option to revert to human decision-making when data is insufficient or contradictory.
AI at the service of operations teams
The value of generative AI in DevOps lies not simply in producing a summary. It stems from its ability to make an investigation more accessible, to highlight connections between scattered signals and to guide next steps without obscuring uncertainty.
To achieve this, the assistant must rely on verifiable data, distinguish facts and assumptions, acknowledge its limitations and leave high-risk decisions to the teams.
On-premise deployment complements this approach. Sensitive data remains within the company's controlled environment, while teams benefit from a conversational interface capable of quickly answering their questions. Data sovereignty then becomes an integral part of the AIOps architecture, rather than a constraint added as an afterthought.
With ServicePilot, the goal is to align observability analysis with operational needs: to help teams understand what is happening, verify possible causes and take informed action. The objective is not simply to generate text, but to reduce the time required to resolve production incidents.
