Quick start
To start your monitoring project, you will need access to a ServicePilot server. ServicePilot can be deployed in three different ways depending on your infrastructure, connectivity constraints and scalability needs:
Software as a Service : Cloud-hosted ServicePilot Web interface fully managed by ServicePilot Technologies. Only an Agent needs to be installed to start monitoring, with no server to maintain.
On Premise offline standalone: ServicePilot is installed locally on a Windows server, operating fully offline. This mode is ideal for isolated environments or customers requiring full data control without external connectivity.
On Premise offline cluster: An unlimited high‑availability deployment using ServicePilot cluster appliances (appliances with preinstalled and preconfigured software) and S3‑compatible storage. Designed for large infrastructures, redundancy and long‑term data retention in offline environments.
Each deployment option provides the same monitoring capabilities.
ServicePilot SaaS platform
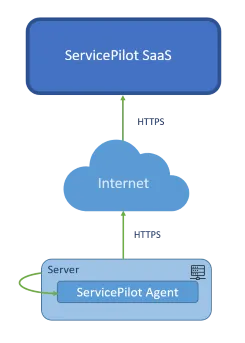
To use the ServicePilot SaaS platform, 3 steps are essential to get started:
- Create a ServicePilot account to log in to the ServicePilot web pages.
- Install a ServicePilot Agent to collect data (downloadable from the ServicePilot web interface).
- Start monitoring equipment by adding provisioning rules and resources to monitor your environment.
Set up a ServicePilot SaaS account
Before being able to access ServicePilot web pages, a customer account will be required. Go to the ServicePilot SaaS Login page and use the Sign up link to create an account.
Once you have your login Username and Password you can use these to open your ServicePilot web pages.
To manage your account and create other users and groups, see the Users documentation.
ServicePilot On-Premise deployment
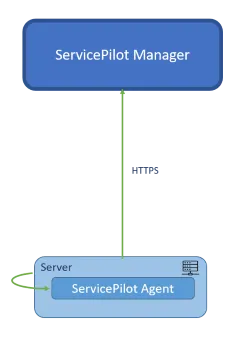
ServicePilot On Premise only requires a few steps to get started:
- Obtain the ServicePilot installer by contacting ServicePilot Technologies to get the software: Support ([email protected]).
- Install ServicePilot by following the installation guide.
- Obtain a ServicePilot license by contacting ServicePilot Technologies to get a trial license.
- Start monitoring equipment by adding provisioning rules and resources to monitor your environment.
Organize the view hierarchy
The view hierarchy in ServicePilot serves as the primary structure for visually representing and organizing all monitored elements. It functions as a logical tree in which each view can contain other views, resources, objects or graphical elements, thereby enabling progressive navigation from the general to the specific.
ServicePilot allows users to freely create their own views to structure the monitored infrastructure according to each organization’s specific needs and operational reality.
This flexibility offers the ability to represent your information system from different perspectives: geographical organization (sites, regions, data centers), business (applications, critical services, functional chains) or even by technical silos (applications, network, servers, databases, cloud, security).
- Using a user with admin privileges, log in to ServicePilot.
- Open SETUP > Provisioning.
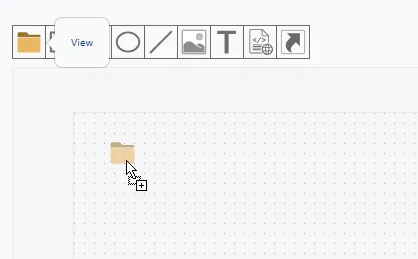
- Navigate in the existing view hierarchy in the left hand pane and click on the view in which you wish to create your new view.
- Drag and drop the view icon into the view pane.
- Give the new view a unique name and click on OK.
- Click on Save to confirm the changes.
ServicePilot views are explained in more detail in the Monitoring hierarchy documentation.
Install a ServicePilot Agent
ServicePilot Agents are designed to collect monitoring data from various sources and send this data to ServicePilot. ServicePilot Agents require minimal configuration. All they need is web access to ServicePilot and an API key to secure the communication. All further configuration is done through the ServicePilot web interface. There are a number of different ServicePilot Agents. You can download and install the Agent you need from the ServicePilot web pages.
- Using a user with admin privileges, log in to ServicePilot.
- Click on SETUP > Agents > Install an agent.
- Select the Agent to install and follow the instructions under Get started.
ServicePilot Agents are explained in more detail in the Agents documentation.
Start monitoring equipment
A ServicePilot Agent may be able to collect data but ServicePilot still needs to be told what each Agent should do. There are two main ways in which equipment may be added to the configuration:
- Rules to provision resources automatically when an agent is discovered.
- Adding resource configuration manually.
The provisioning required will depend on the type of resource monitored. See Packages documentation for details when adding a resource manually.
ServicePilot provisioning is explained in more detail in the Data collection documentation.
Setup
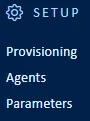
As an admin user of ServicePilot, configuration may be changed under the Setup menu items. Start with Users, Agents, Data collection and Policies documentations for more details.
| Menu item | Data display | |
|---|---|---|
| Provisioning | Modify resources to be monitored using the View editor, of via the Resources list. Packages and How to documentation is provided to automate provisioning and provide data to ServicePilot. | 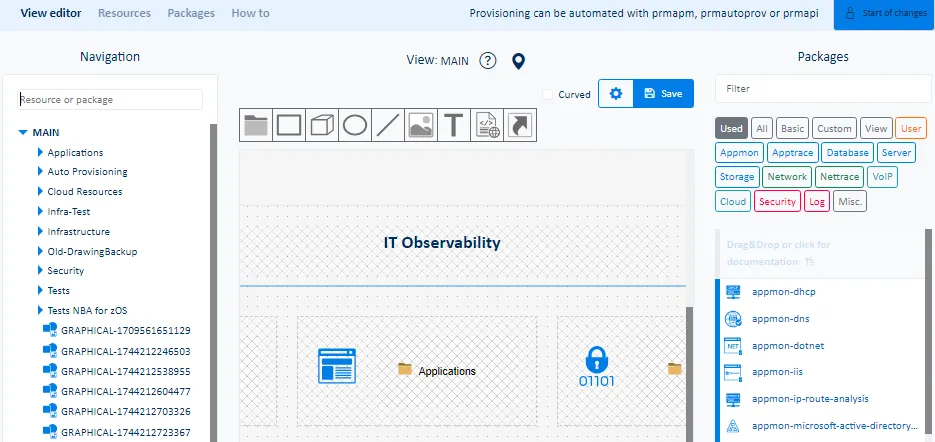 |
| Agents | View, install and manage ServicePilot Agents. | 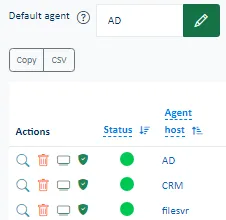 |
| Parameters | Landing page for ServicePilot Administration and settings. | 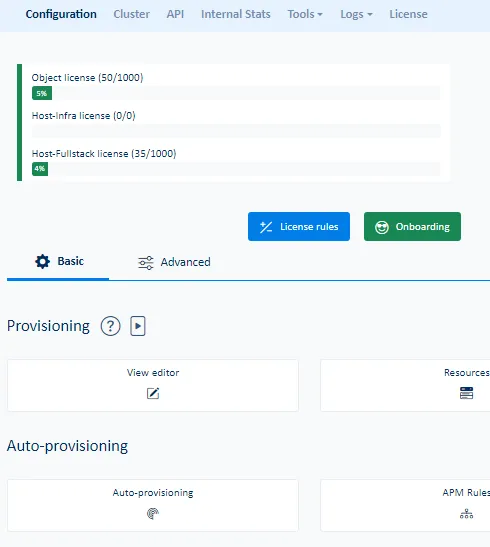 |
Further information
The ServicePilot web interface contains texts and descriptions to help use the tool.
![]()
In many places a question mark icon provides further information, either as a tooltip or as more detailed web pages.
