Network Flow Monitoring for Servers
Automatic Application Flow Discovery and Mapping
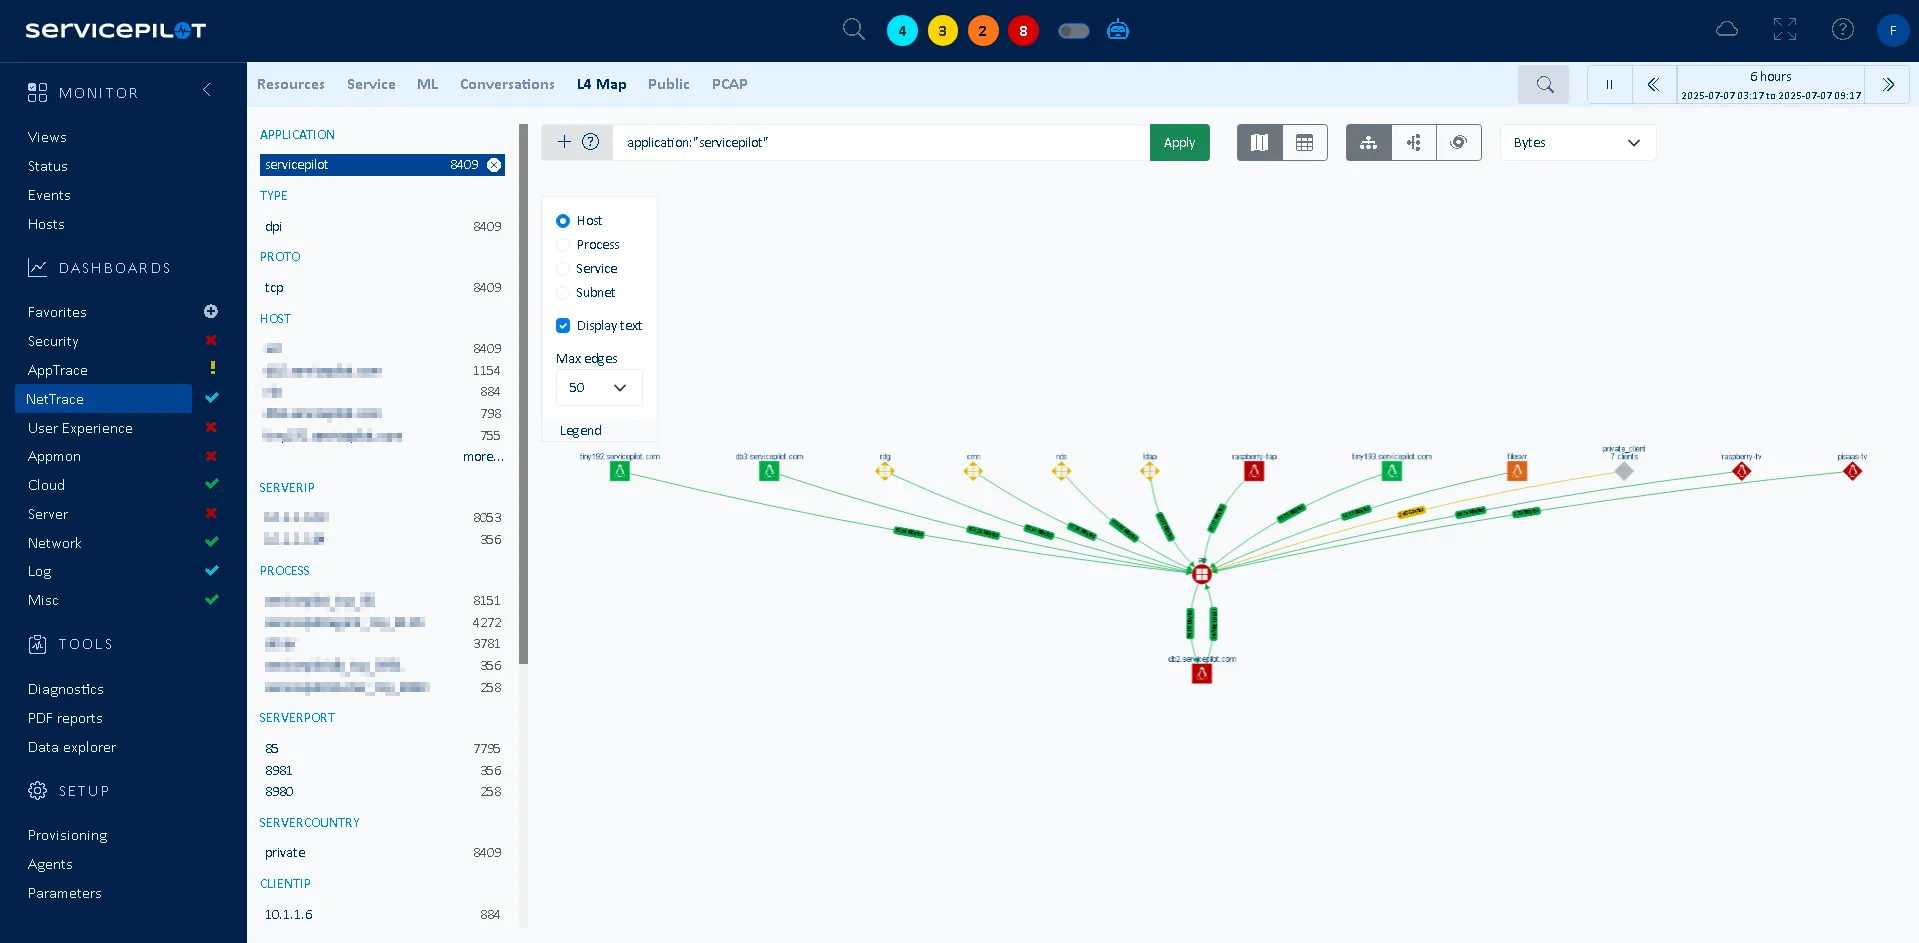
With NetTrace technology, ServicePilot offers automated discovery of servers, applications, services and network flows. Right from deployment, the lightweight Windows, Linux or z/OS agent enables dynamic mapping of application flows and dependencies between services and hosts.
Whatever their location (cloud, on-premise, hybrid), you can easily identify critical dependencies in the actual topology and communication paths to better understand the real life of your information system.
Real-time and Historical Visibility on OSI Layers 3 & 4
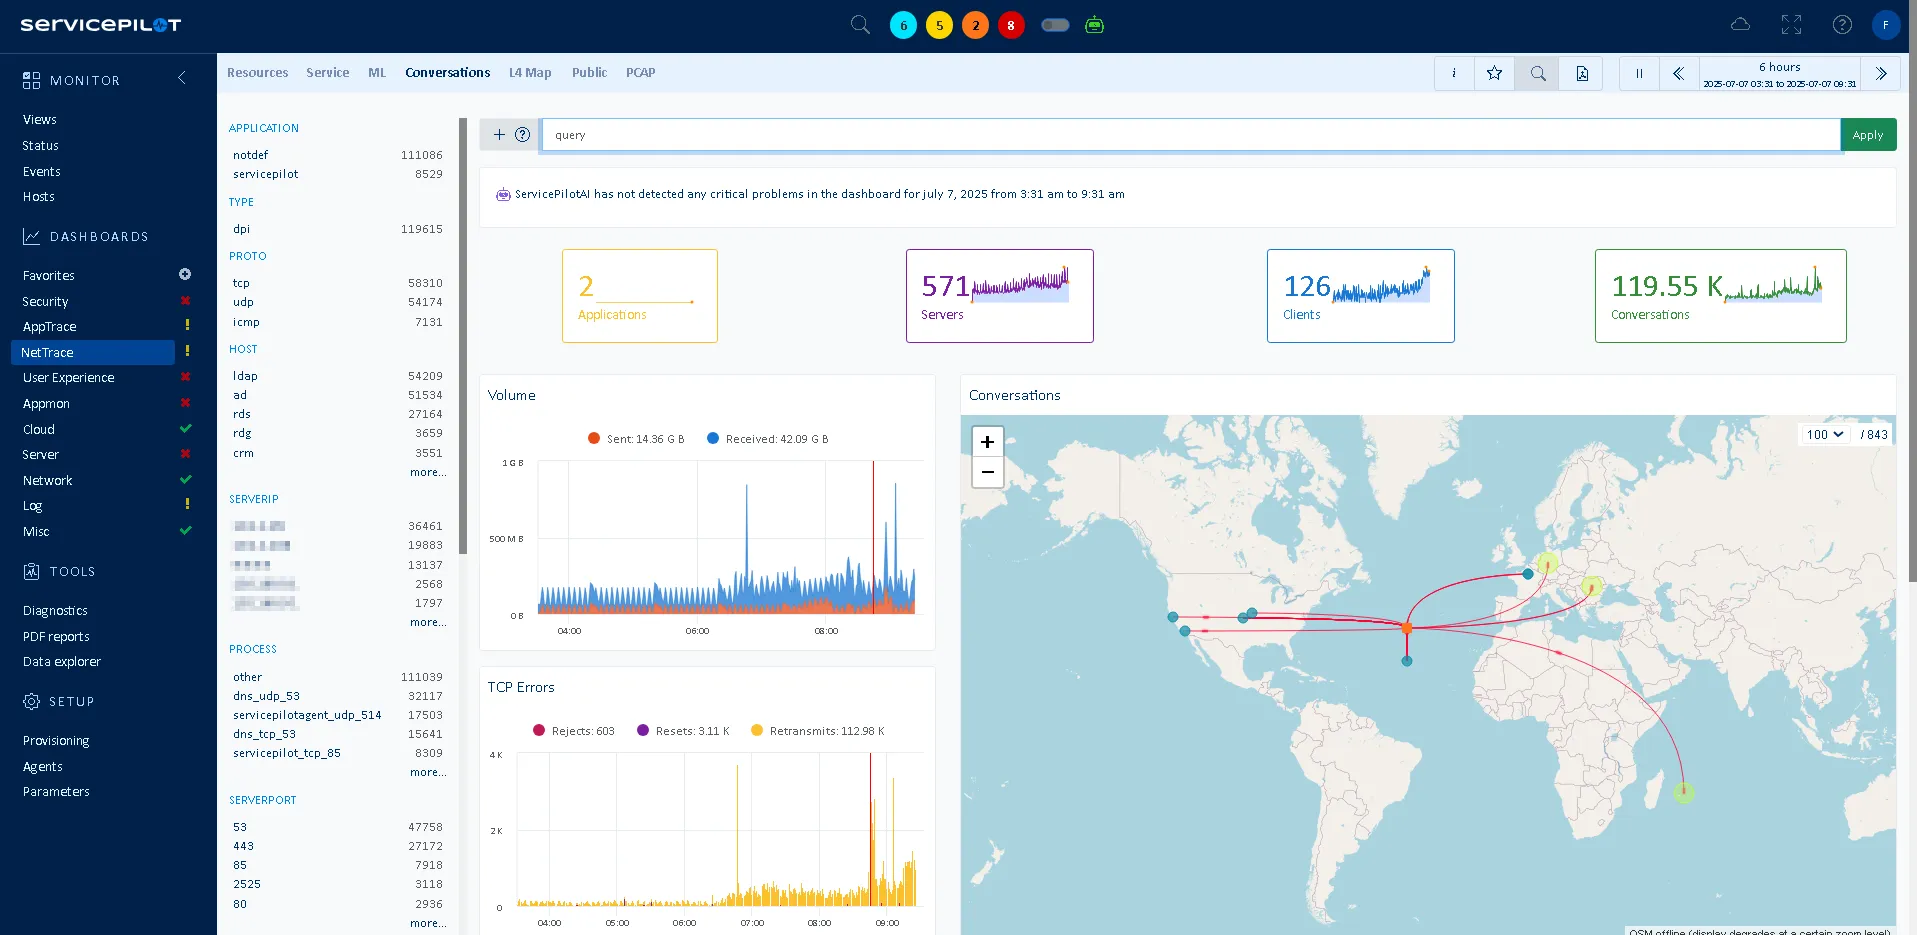
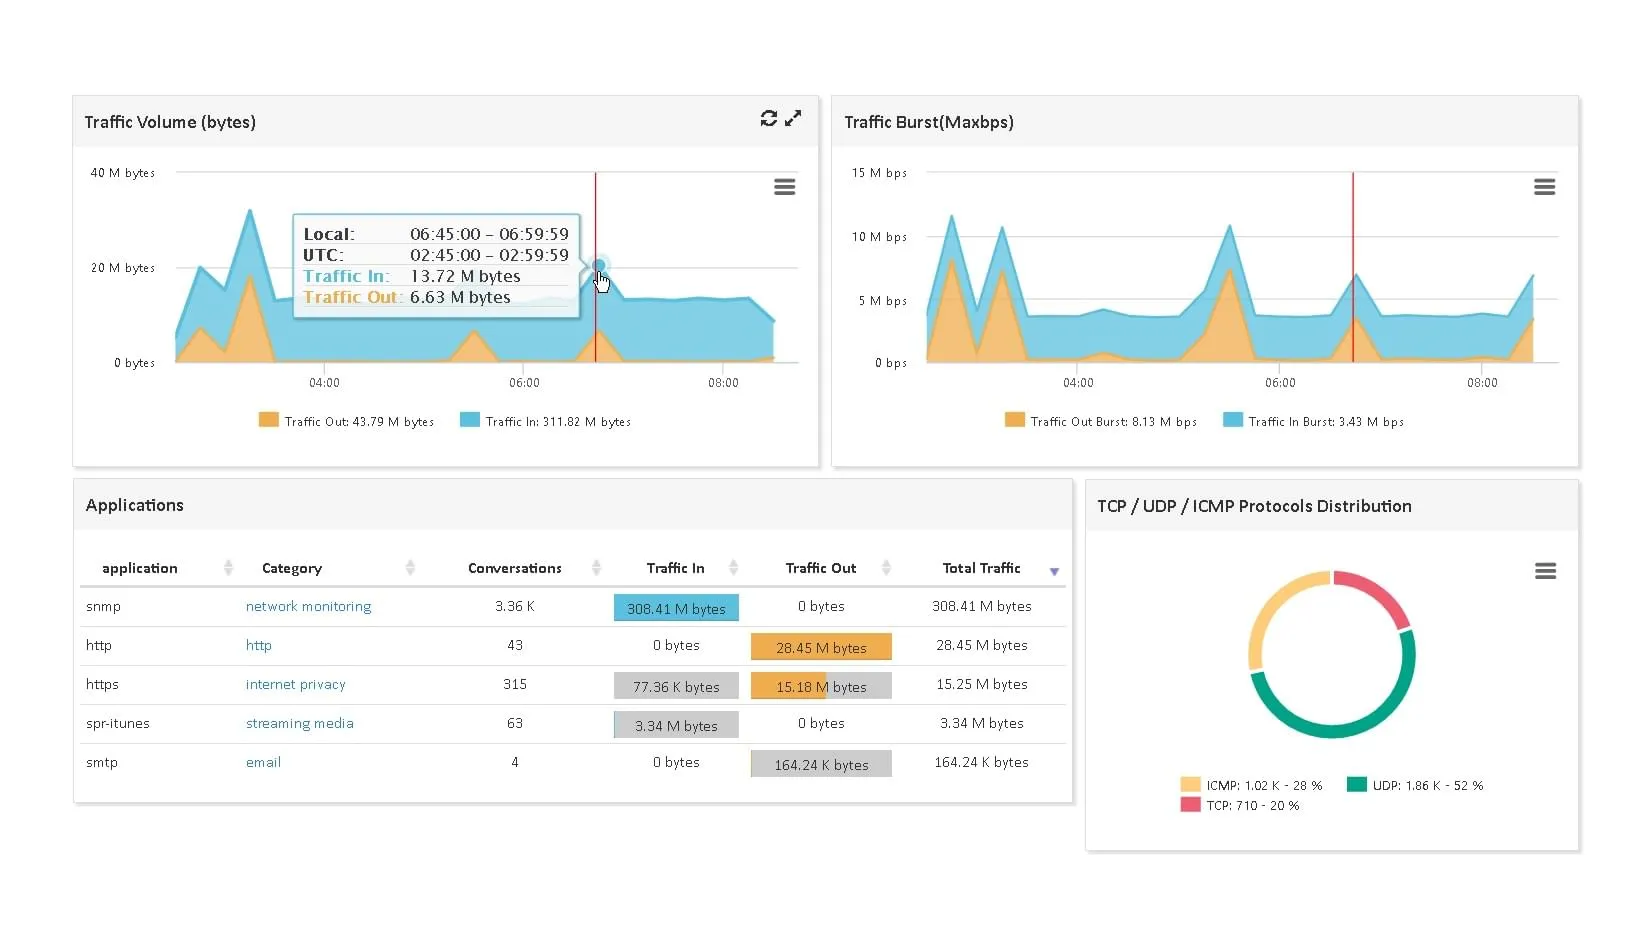
ServicePilot NetTrace provides real-time and historical observability of the TCP/IP network layers (Layer 3 - Network and Layer 4 - Transport of the OSI model) on your servers. Ready-to-use dashboards let you zoom in on graphs and analyze in and out network flows between servers, applications, services and users over time.
This observability of application flows enables rapid identification of bottlenecks, optimization of network performance by eliminating latency and saturation, as well as a significant improvement in user experiences thanks to automatic monitoring of actual interactions between application components.
Root Cause Analysis and Correlation to Diagnose Problems
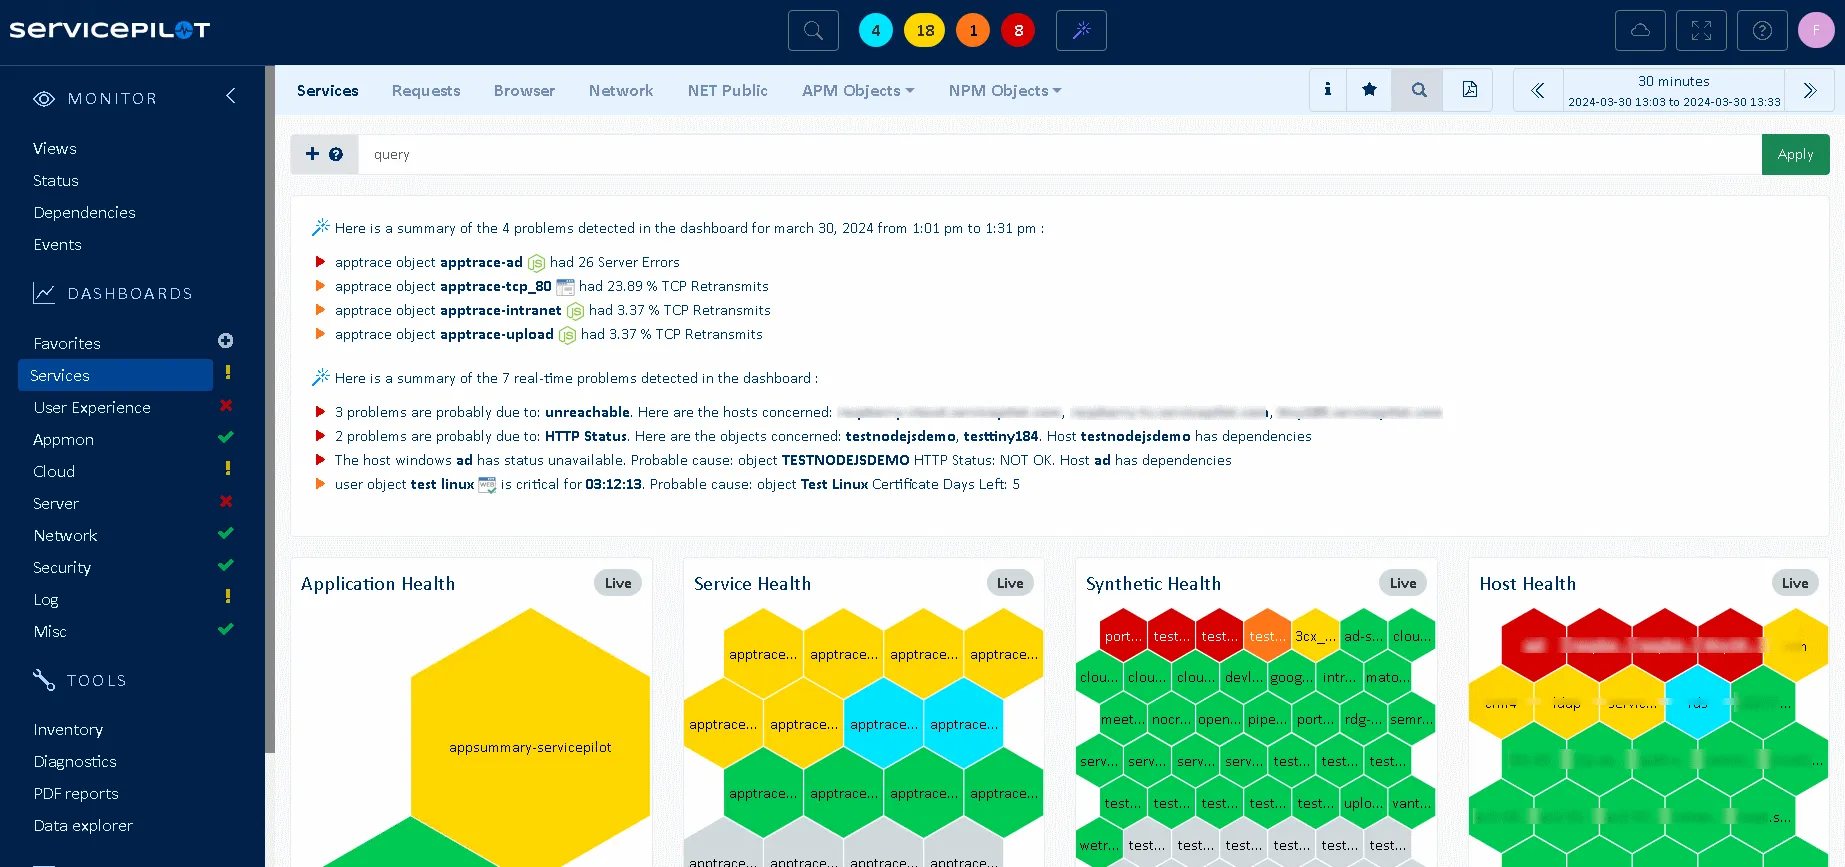
ServicePilot's web interfaces unify metrics, traces, logs and network flows to provide all crucial data in a single platform. This makes correlation simpler and troubleshooting more efficient.
ServicePilot's automated Root Cause Analysis (RCA) helps to quickly identify the source of problems among the multitude of dynamic dependencies that a modern application can have. This significantly reduces troubleshooting time and improves overall system reliability.
Multiple use cases of Application Flow Monitoring
Flow monitoring can be a backbone vector of cross-functional data useful to everyone in the IT department. This data on incoming/outgoing connections for servers/applications is useful for performance, security, migrations and updates, and so on.
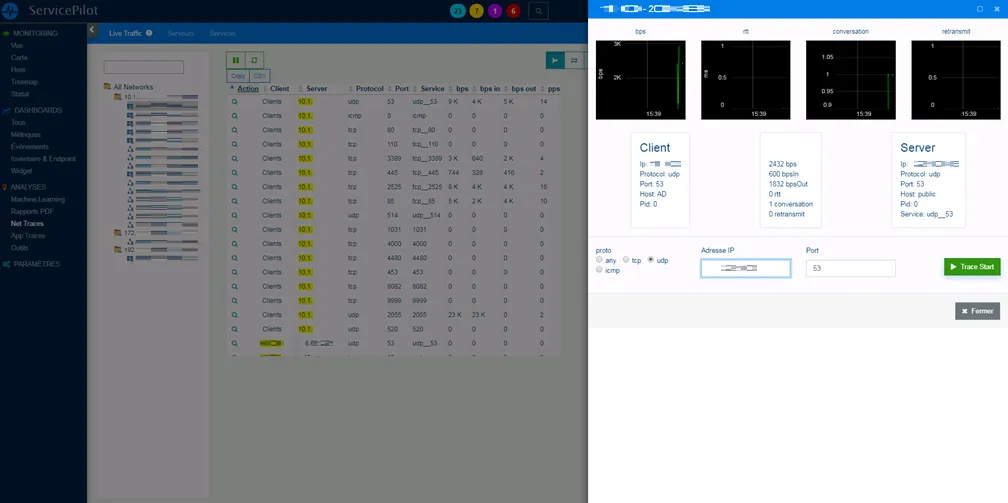
ServicePilot's global yet detailed visibility means that we can monitor hundreds or thousands of machines/applications, and in the event of abnormal data in flows, launch a live trace in PCAP format directly into your browser for subsequent analysis.
We discover the main applications on our servers and are able to monitor them in great detail automatically.
Automatic Monitoring of System and Application Flows
Automatic Discovery
Automatic discovery of applications and services on all Windows, Linux and z/OS servers.
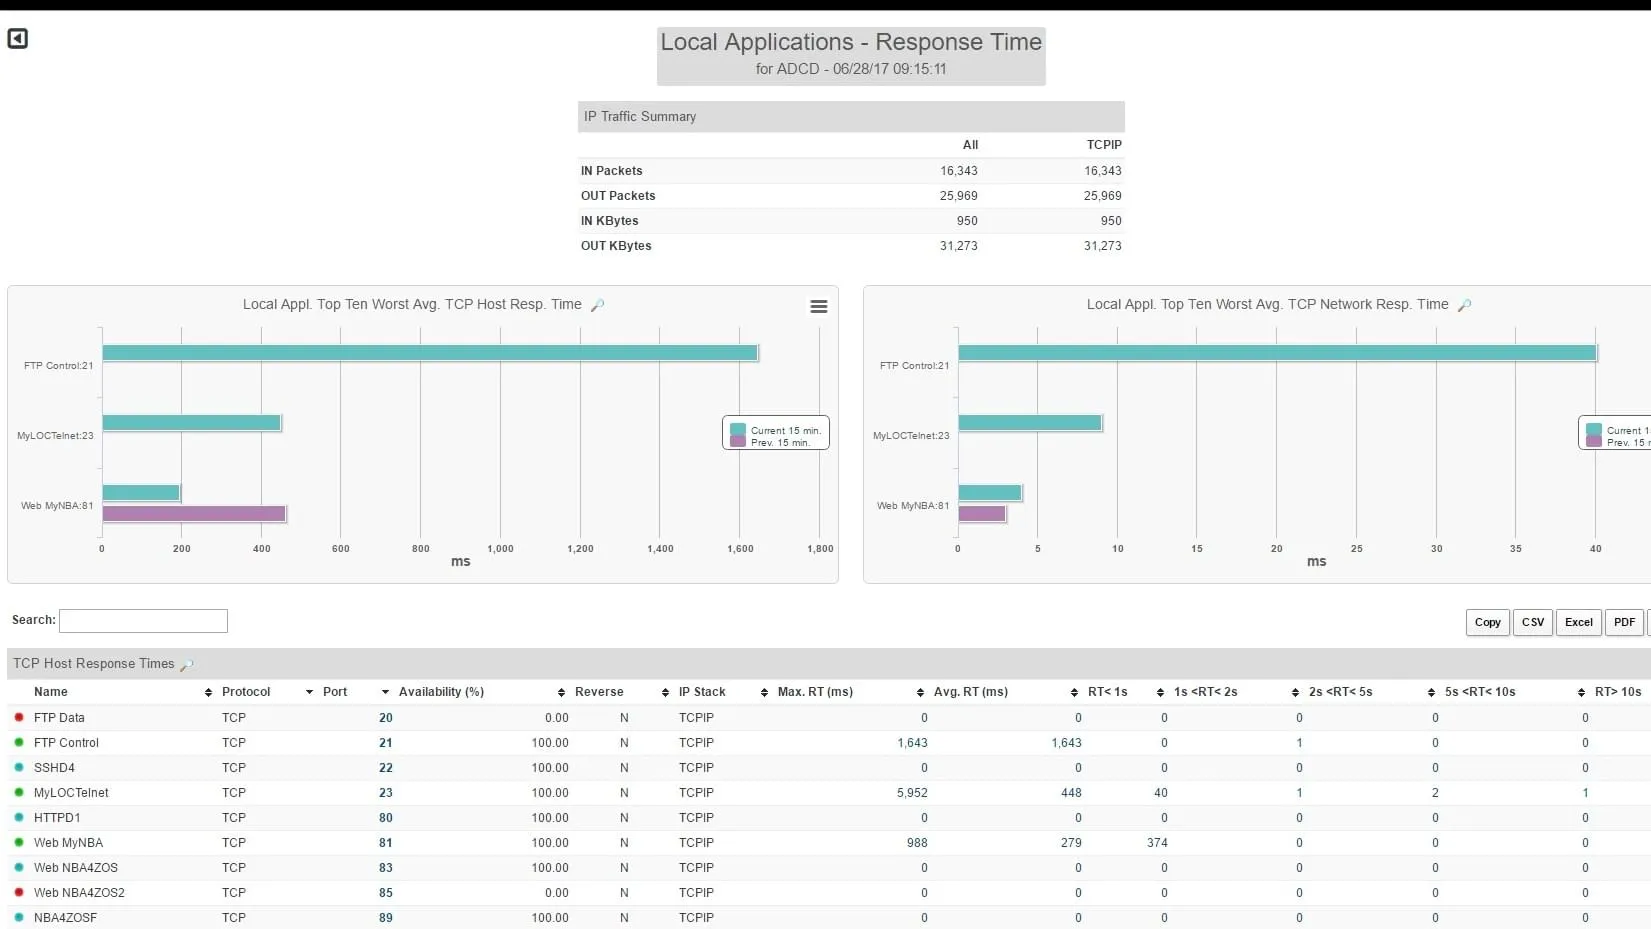
Comprehensive Statistics
Detailed activity statistics for each application discovered and monitored.
Live and Historical Data
Multiple interfaces for live monitoring and analysis of historical data.
On-demand PCAP Traces
Live mode with the possibility to plot the desired stream in PCAP format in the browser.
Application trace integration
Other Application trace Solutions
Free installation in
a few clicks
SaaS Plateform
- No on-premise software setup, servicing and configuration complexity
- Instant setup, complete and pre-configured to ensure robust monitoring
OnPremise Plateform
- Contracts and commitments over time ( > 1 year)
- Performance, Data Storage and Infrastructure Management
- 2 additional solutions: VoIP and Mainframe monitoring
