SD-WAN network performance monitoring
The Importance of SD-WAN Monitoring. Why monitor SD-WAN projects?
The integration of SD-WAN network monitoring into your network management strategy is critical to help in the smooth transition from conventional network systems to modern solutions offered by Cisco, Versa Networks and Cloud Networks. By monitoring both traditional MPLS-based WAN and new SD-WAN in one complete dashboard, we gain enhanced visibility into network performance. We can drastically reduce the Mean Time to Resolution (MTTR) when incidents occur.
SD-WAN network monitoring is very important for the success of any project to use these new network technologies. It reduces the operational risks linked to the adoption of these new technologies while harmonizing connection monitoring with the goal of OPEX and CAPEX cost reductions that SD-WAN solutions deliver.
Let's consider a multinational company rolling out an SD-WAN solution to unify its network located in different parts of the world. Precise monitoring in this scenario would ensure optimal performance and the company would enjoy an important reductions in operational costs while reducing deployment risks.
This kind of monitoring ensures that new technology projects run smoothly, helps in decreasing operational risks and aligns connectivity monitoring in order to reduce costs.
Unified network monitoring: Monitoring Hybrid WAN and SD-WAN Networks
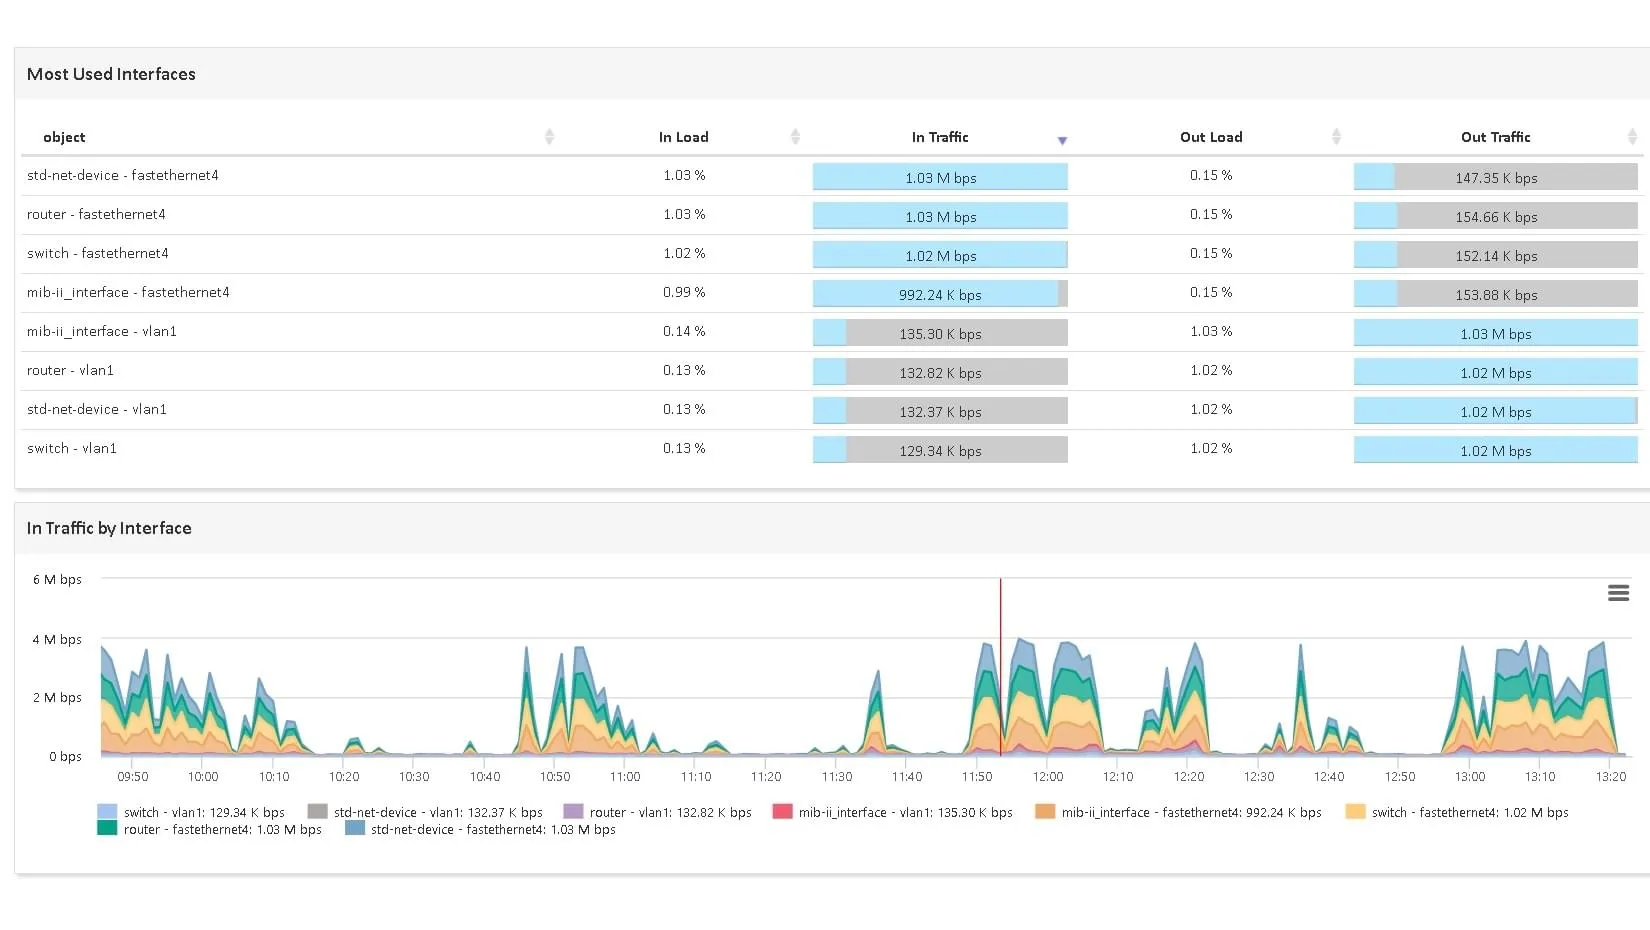
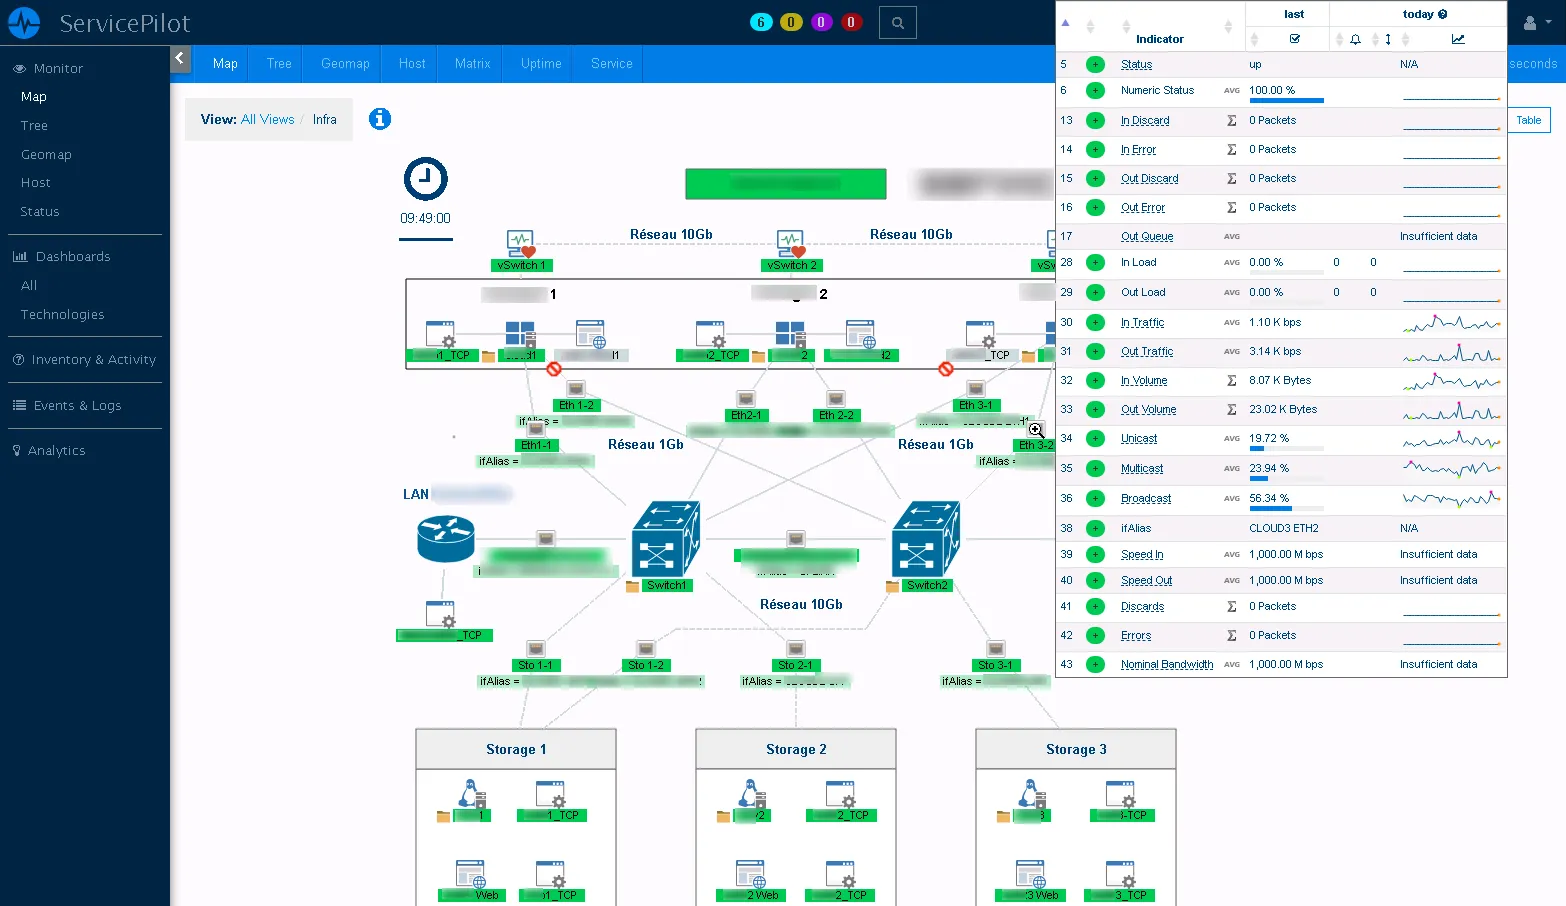
ServicePilot transforms the monitoring of both traditional MPLS-based WAN and modern SD-WAN. It monitors SD-WAN hardware, individual connections and multi-vendor links. Our standard or custom dashboards use the analysis of key performance indicators (KPI) of leading SD-WAN solutions like Versa Networks' Cloud Services Gateway (CSG) to provide insights into bandwidth usage, path usage, system performance and application class validation.
ServicePilot's dashboards can be customized based on user roles, sites or restricted perimeters. This flexibility ensures that whether you are part of the network operations, engineering teams, CIOs, Service Providers or an external collaborator, you can have a dashboard that suits your needs.
Let's imagine a Service Provider managing network operations across many client businesses. They can create customized dashboards for each client allowing them to understand and optimize the unique network performance and needs of each business. One can visualize and analyze what traffic has been transmitted, in which classes and along which paths, as assigned by the SD-WAN controller.
Our user-tailored approach enhances the monitoring experience. It provides personalized insights enabling effective management and decision-making for diverse user groups.
In addition, our monitoring covers all protocols and technologies to get the most visibility on your networks and future services they will deliver: SNMP, Traps, Syslog, NetFlow, Ping, BGP, OSPF, IPSLA, HTTP, SQL, ...
Unraveling Complex Network Architectures with Customizable Maps
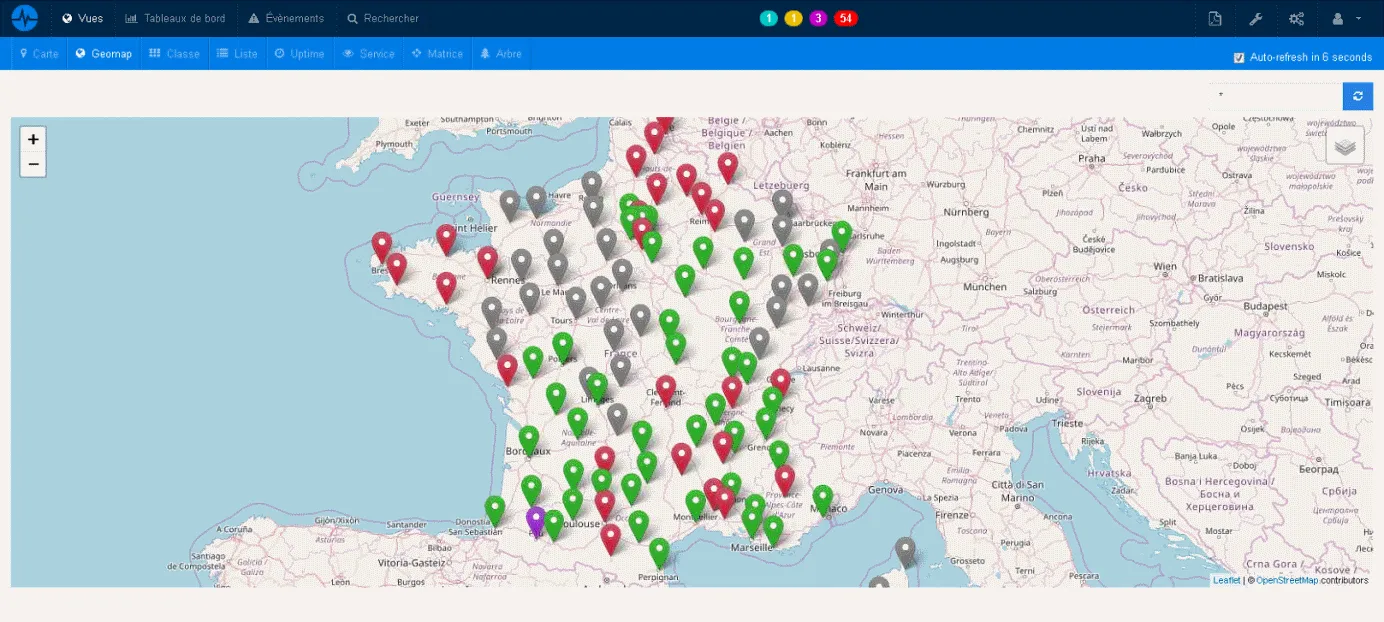
We take network monitoring to the next level with semi-automatic discovery and mapping of sites on a geographic map. This feature allows real-time performance and availability tracking of all monitored sites so you can keep your finger on the pulse of your network's health.
We use Architecture, Business and Geographic type maps to simplify network performance management in a multi-site context. This solution really helps to manage and operate networks covering multiple sites with a lot of devices.
Let's consider a multinational company with hundreds of office locations. The Geographic type maps help IT teams see and track the performance and availability of networks at each location in real time to find and fix issues faster.
It is also possible to automate the discovery and generation of these maps which will represent the monitored sites so you can keep an eye on their performance and availability. By using this feature, the management and operation of network performance in a multi-site context with a large number of devices is much easier.
Automated mapping is a helpful technology that makes managing networks easier. It helps network administrators understand how the network is performing and quickly solve any issues that arise. This ultimately leads to a healthier network and better service for users.
The analysis of traffic between remote sites and the datacenter is made easy thanks to adjustable thresholds in order to set up alerts according to the needs of remote sites. Customized filters and maps allow the quick understanding of specificities of each site and incident.
Redefining Agile Monitoring of SD-WAN Networks
Here are 4 points showing how ServicePilot can help in performance management of new SD-WAN network architectures:
- Monitoring of thousands of physical or virtual sites and devices (SD-WAN and traditional networks, servers and NFV, applications, datacenter ...)
- Discovery and automatic monitoring of links (active, public and private, networks and systems,...) and applications
- Modern interfaces for monitoring and operation: Dashboards, Alerts, Mapping, PDF Reports, Event Trays, Collaboration, etc.
- Multi-builder support, technology packages, speed and ease of deployment, multi-tenant, adapted to multi-site, etc.
Unified monitoring of multi-site networks allows full use of dynamic and correlated data analysis of Cisco, Versa or Cloud SD-WAN controllers. The metrics collected allow you to measure the performance of the application policies that have been implemented, view which traffic has been transmitted in which classes and over which paths assigned by SD-WAN controllers.
Our custom dashboards, maps and PDF reports allow users to tailored visualizations and data in order to suit your needs and better grasp how infrastructure performance affects applications and services. The analysis are adjustable and varied depending on the data sent to ServicePilot: track authorized connections, monitor blacklists, active VPNs, active users, routing, and much more.
1. Expansive Network Management: Monitoring Thousands of Sites and Devices
Today's network environments are more and more complex so the need for complete monitoring of both physical and virtual sites is growing. Whether it is traditional networks, SD-WAN, servers, Network Functions Virtualization (NFV) or applications, it is crucial to keep track of each of these components.
You can monitor thousands of sites and devices at the same time. It covers all your network, capturing key insights from your SD-WAN, servers, NFV and datacenter applications.
A company with huge network that includes SD-WAN, traditional networks and a variety of applications will find our full monitoring capacities very helpful. By tracking the performance of all network elements, IT teams can quickly identify and rectify issues for optimal network performance.
Broad-scale monitoring reduces the risk of not detecting some issues. An optimal performance is ensured and the network resources are always highly available.
2. Automatic Discovery and Monitoring of Links and Applications
The digital landscape is more and more interconnected. Discovering and monitoring network links and applications is essential.
We go further than just passive monitoring. You can proactively discover and automatically monitor active, public, and private links, along with a wide range of network systems and applications.
Let's take a Service Provider managing multiple client networks. This feature will really simplify network management tasks, free up resources and reduce the risk of missing an important issue.
With a proactive to network monitoring, network management is more efficient, incidents are detected and fixed quicker to improve the overall network health.
3. Leveraging Modern Interfaces for Enhanced Network Monitoring and Operation
Using modern interfaces for network monitoring and operation is a crucial step in driving effective network management.
We provide many modern interfaces for monitoring and IT operations. From intuitive dashboards and instant alerts to complete maps, PDF reports, event trays, and more, you have all the tools you need to maintain a robust network.
An IT team managing a large corporate network can really benefit from these modern interfaces. The teamwork is more effective in resolving network issues and the complete reports provide crucial insights for making decisions.
These modern interfaces enhance user experience and improve team collaboration. It gives comprehensive network insights for better decision-making.
4. Adapting to Diversity: Multi-Vendor Support and Rapid Deployment
In today's world, network resources are often constituted with devices from multiple vendors. This diversity calls for a monitoring solution that offers multi-vendor support and allows a quick deployment.
Our technology packages support various vendors allowing a quick and easy set up. Built-in dashboards and thresholds can be useful in situations where multiple vendors, networks and locations are involved.
Let's take a Service Provider working with various network equipment from many vendors across multiple client sites. Our multi-vendor support and the solution swift deployment can ease operations and boost service delivery efficiency.
Support for multiple vendors and the ability to quickly deploy our solution facilitate the management of the network. It also improves the network's ability to adapt to changes and makes operations more efficient.
ServicePilot: Comprehensive SD-WAN Network Management
ServicePilot is a unified monitoring solution that can greatlu help large SD-WAN network management. It helps administrators oversee both current and future network architectures, making it easier to transition between virtualized or non-virtualized WAN networks.
We offer wide range of features to reduce MTTR, prevent impacts on sites or employees and enhance network performance visibility. This complete solution is designed to reduce Total Cost of Ownership (TCO) by consolidating tools, thereby offering significant cost savings.
A large company undergoing a transition from MPLS to SD-WAN would greatly benefit from our software. It provides full view into the network performance before, during, and after the transition, helping to ensure a smooth shift with minimal disruption.
We help reducing TCO, enhancing control over service delivery and enabling IT teams to better grasp the influence of infrastructure performance on applications. In summary, we deliver a full solution for efficient, cost-effective SD-WAN network management.
