ServicePilot's MPP Architecture: A Powerhouse for Advanced Monitoring
The Power of MPP Software Architecture
MPP, or Massively Parallel Processing, is a computational model where many processing units perform different tasks at once over different data points. When this concept is integrated in a monitoring software large amounts of performance indicators can be handled and analyzed in real-time accross IT systems and applications.
Picture a multinational corporation managing many and complex IT systems at the same time. During peak usage periods, traditional monitoring systems may have trouble keeping up. But with an MPP-powered system easily handle these surges of monitoring data and logs. It ensures continuous monitoring and analysis of application performance to offer real-time insights no matter how busy the systems are.
- The true power of an MPP software architecture in monitoring solutions is in its ability to process large amounts of data at once
- This feature helps businesses gather real-time insights from their data, which leads to making better decisions and providing higher quality services
Robust Data Collection across All IT Layers
Analyze in a single platform the performance of applications and every underlying resource. Capture each individual transaction across every IT layer technology. Get useful data on how web apps perform and be given an end-to-end view including the infrastructure.
Consider a large digital marketing agency hosting hundreds of websites on behalf of their clients. ServicePilot's data collection tracks everything from server load to user response times. It also identify any issues that could impact the performance of these websites.
- The benefit here is a unified understanding of the entire IT landscape. With MPP data collection, you will enjoy a clear view of your entire infrastructure
- Decisions will be easily taken and issues will be resolved proactively.
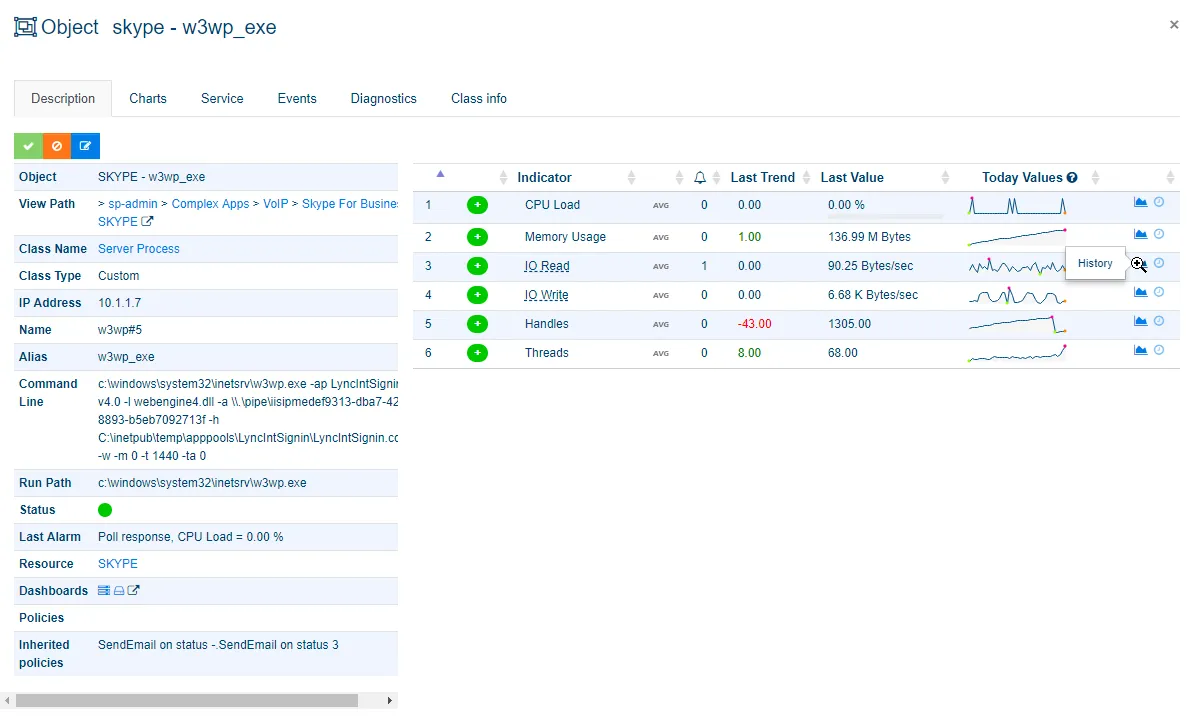
Scalable Real-Time and Historical Data Analysis
Our solution simplifies both historical reporting and real-time analysis with its strong processing capacity. It gives in-depth evaluations and swift insights into the status of dependencies and impacts across the billions of indicators monitored.
Let's consider a telecom company having some complicated network structures. They will get real-time and historical analysis to identify recurring network issues, highlight peak load times and uncover where the network can be improved.
- Those analytics made easier, you can deliver a better service at all times
- It ensures a stable performance and improved user satisfaction
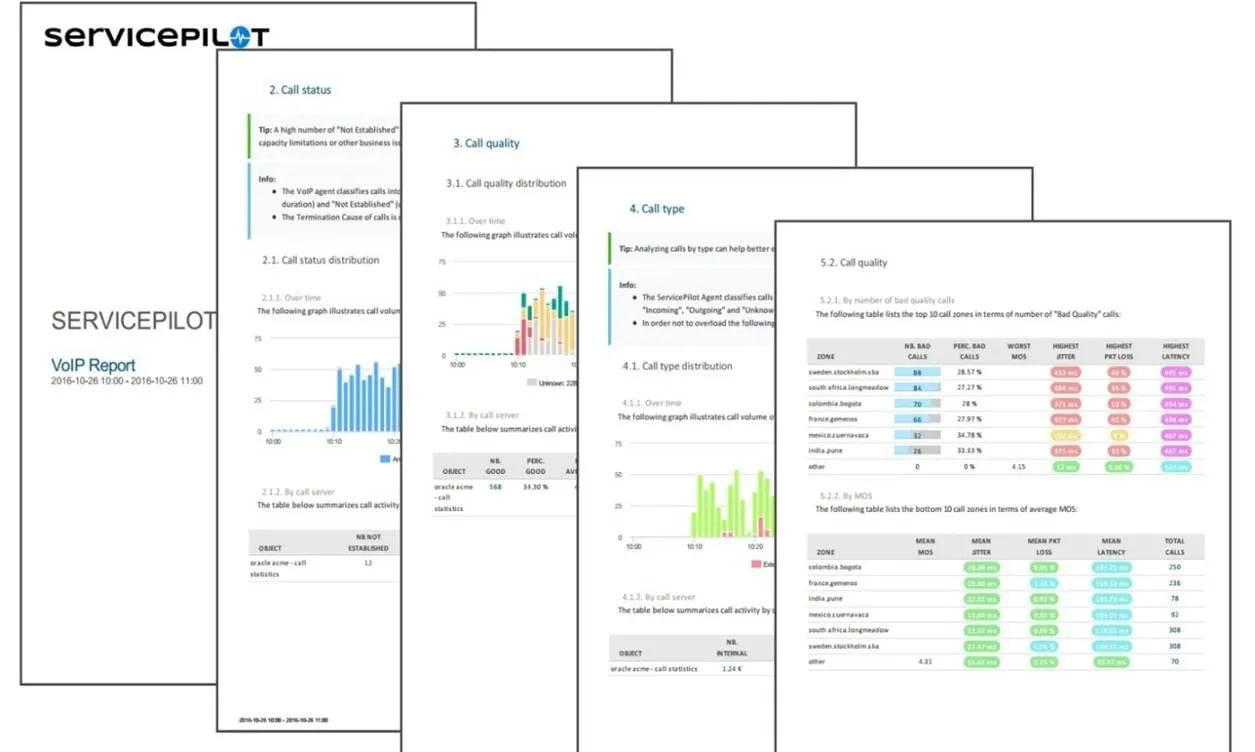
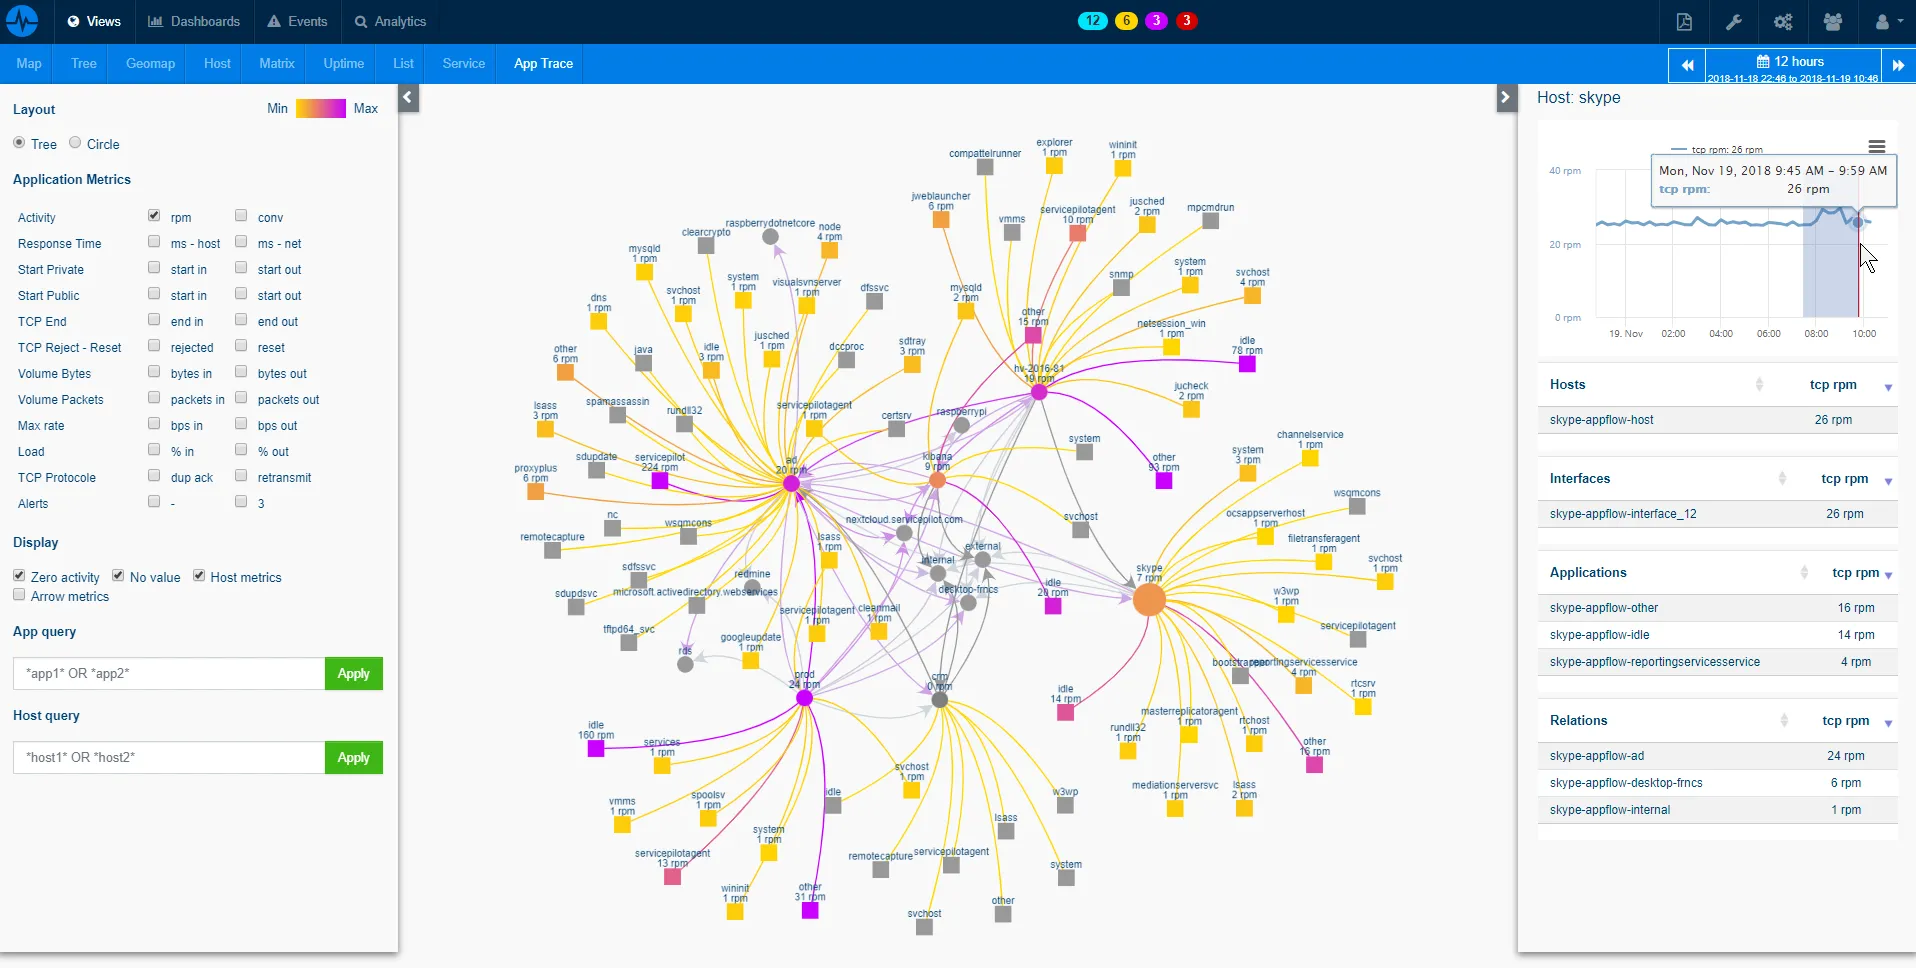
Interactive and Dynamic Data Visualization
We help you see your data in real-time. You can look at your data in different ways like maps or dashboards. Our solution has a search engine that lets you easily create visualizations which can be used in custom dashboards and PDF reports. The tool is designed to be easy to understand and share information with others.
Let's imagine an IT manager monitoring a worldwide enterprise network. The manager can use dynamic visualizations provided by ServicePilot to see how busy the servers are in different locations and monitor real-time metrics. This performance data is presented in a dashboard that is easy to understand and visually appealing.
- ServicePilot helps you turn raw data into useful information
- This helps you understand things better and make smarter decisions
Harnessing the Power of Big Data and Machine Learning
With all IT layers monitored by AI and ML you can detect anomalies in your infrastructure's key metrics. Make sure your applications run smoothly by setting dynamic thresholds on activity. You can then predict how KPI will evolve over time with Capacity Planning.
Take, for instance, a VoIP service provider wanting to ensure seamless call quality for their customers. ML algorithms can be used to predict trends, helping the provider allocate resources and maintain excellent VoIP call quality.
- Harnessing Big Data and Machine Learning allows using a lot of information and data to make monitoring better
- It helps predict incidents and find patterns to improve the quality of service
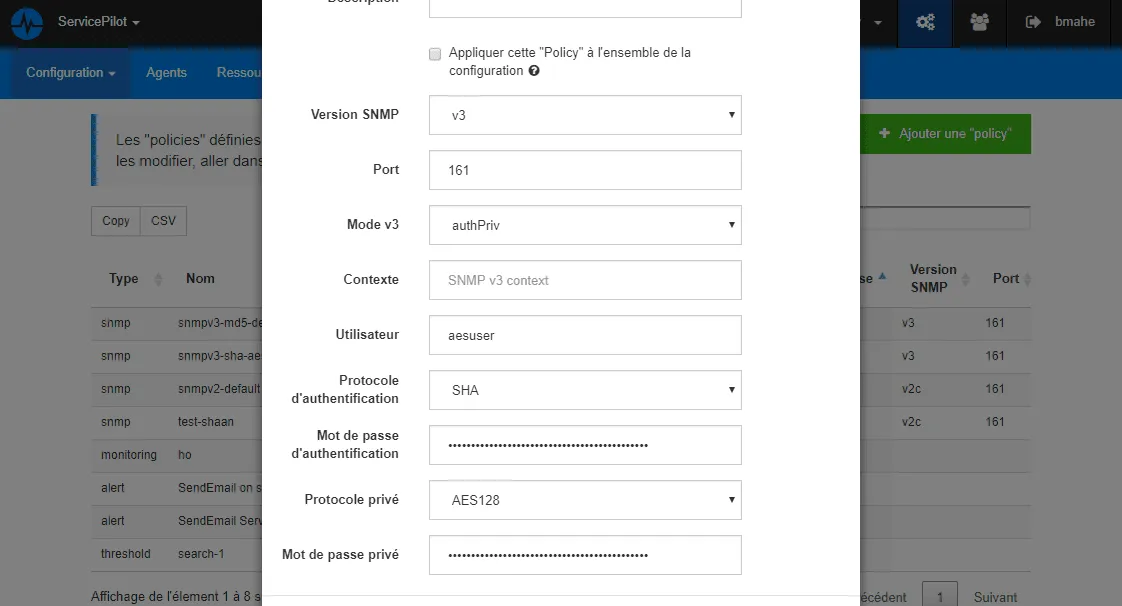
Secure Your Data and Monitoring
ServicePilot offers various security features that help protect the monitoring system. These features include Active Directory or LDAP authentication as well as HTTP, SSL and TLS. It also operates in clusters to replicate data and provide fault tolerance for PCE PRA monitoring.
Healthcare providers handle sensitive patient information on a daily basis. They can use our robust security features to ensure that data is securely monitored and stored. It will provide peace of mind and compliance with data protection regulations.
- Those security features ensure your data and IT operations are protected
- It gives you the confidence to focus on using the insights and analytics for better performance management
Free installation in
a few clicks
SaaS Plateform
- No on-premise software setup, servicing and configuration complexity
- Instant setup, complete and pre-configured to ensure robust monitoring
OnPremise Plateform
- Contracts and commitments over time ( > 1 year)
- Performance, Data Storage and Infrastructure Management
- 2 additional solutions: VoIP and Mainframe monitoring
