Applications and infrastructure monitoring in 2 days

Monitoring the Information System of a real estate organization
Challenges of the IT department
Find unified monitoring software that is easy to set up and administer for applications, servers and the network. This is in order to easily answer the question: How to ensure a high-performance infrastructure to offer the best application services to users?
Selected monitoring solution
ServicePilot
Results after installation
Here is what the implementation of ServicePilot has brought to the IT teams of this subsidiary of the RATP group:
- The speed of deployment with ServicePilot has a positive impact on the agility and quality of the services offered by our IT department.
- Now focus on exceptions and performance maintenance rather than day-to-day equipment management.
- Ensure that application resources operate transparently, optimally and without interruption.
- Integrate with the iTop ticket management tool to automate incident management.
- Display a monitoring cockpit to better communicate on the health of the services delivered to users (technical vision / application vision).
Case study
RATP Habitat, RATP's real estate subsidiary, deployed ServicePilot in 2 days to monitor all its infrastructure and applications, so that the 100 or so employees have efficient access to IT resources.
Challenges and needs of the IT Management
The needs of the IT Management are explicit: "something simple to install and above all simple to administer". Their needs are:
- Systems, networks, APM monitoring
- Real-time health status
- Application chains, central ERP and vital to the company's operations
- Application availability rates
- monitoring cockpits
- Itop ticket management tool
The goal is to be able to ensure a high-performance infrastructure to offer the best application services to users.
Solution implementation
"Once all our information was sent to the ServicePilot support team, we prepared the Windows VM they recommended. Once the latter is in place and all the prerequisites have been met, we installed the software and imported the configuration they prepared for us."
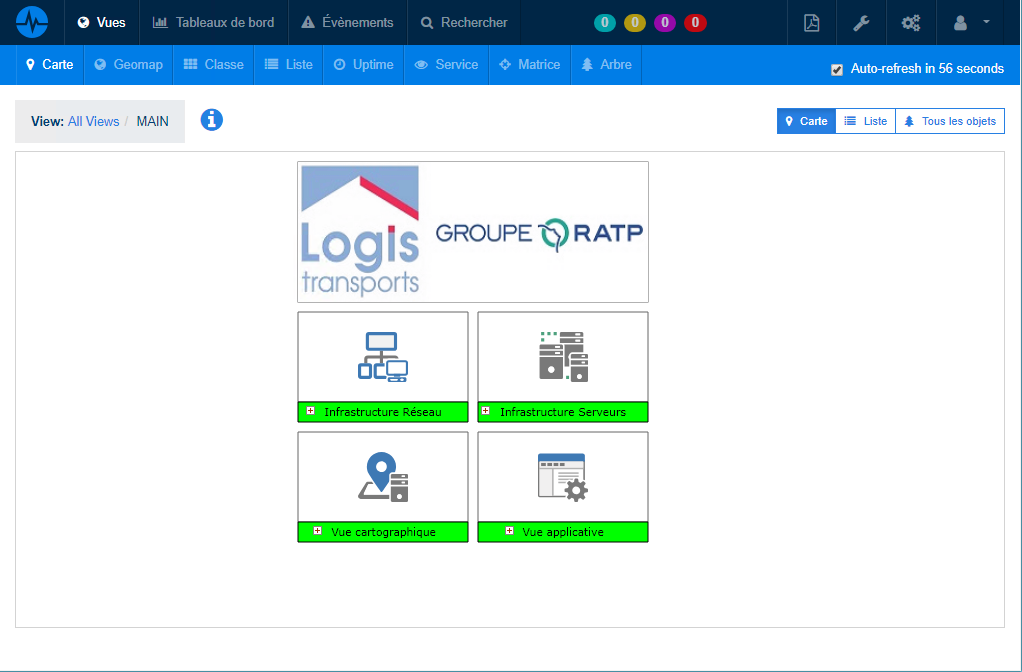
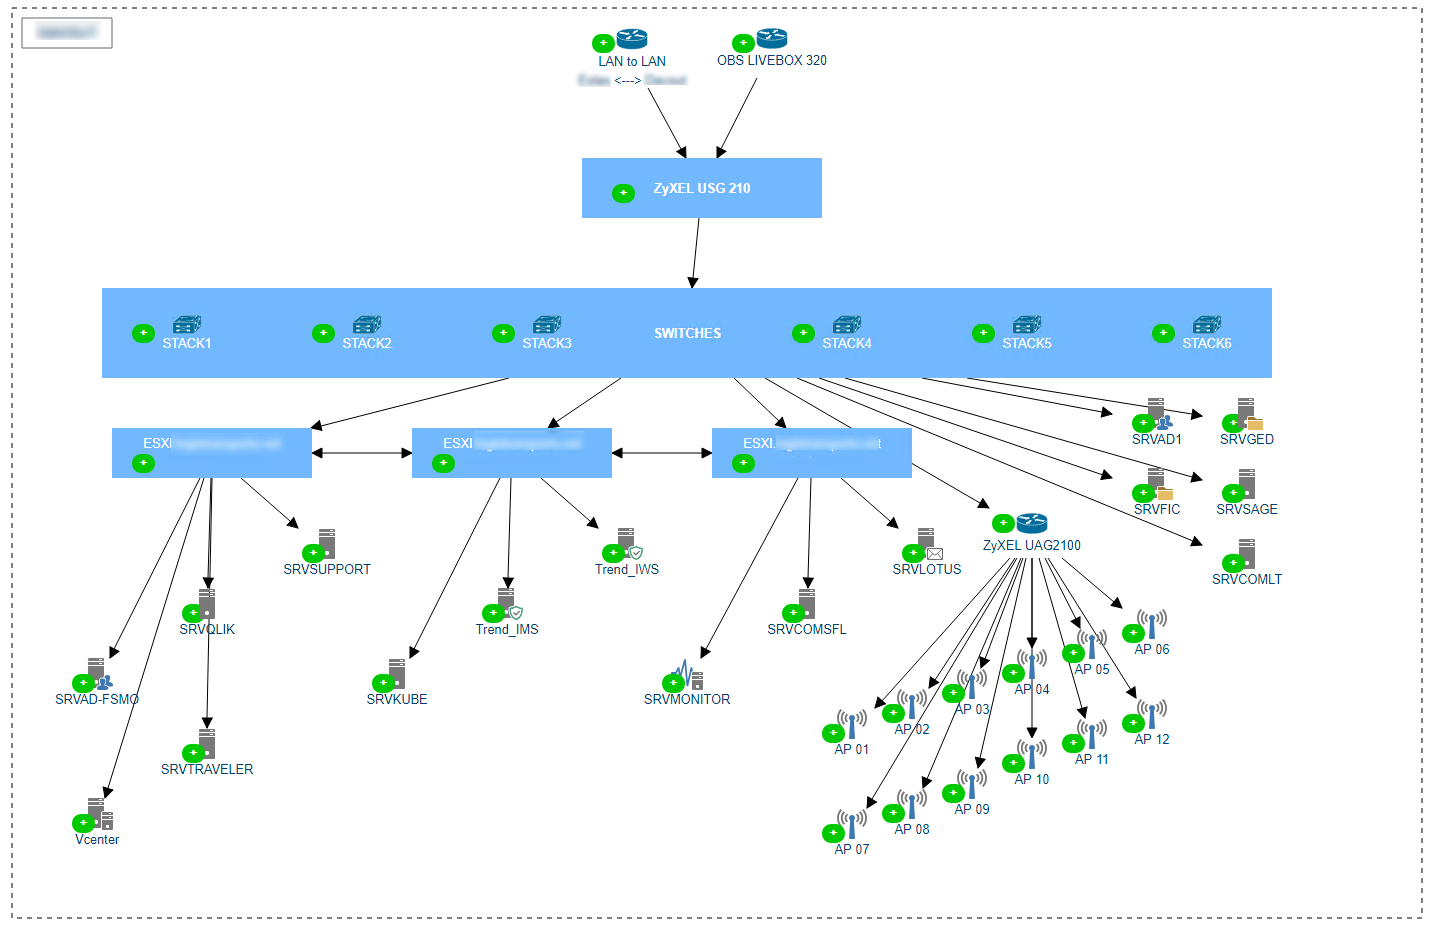
Network and Telecom Systems Infrastructure Part
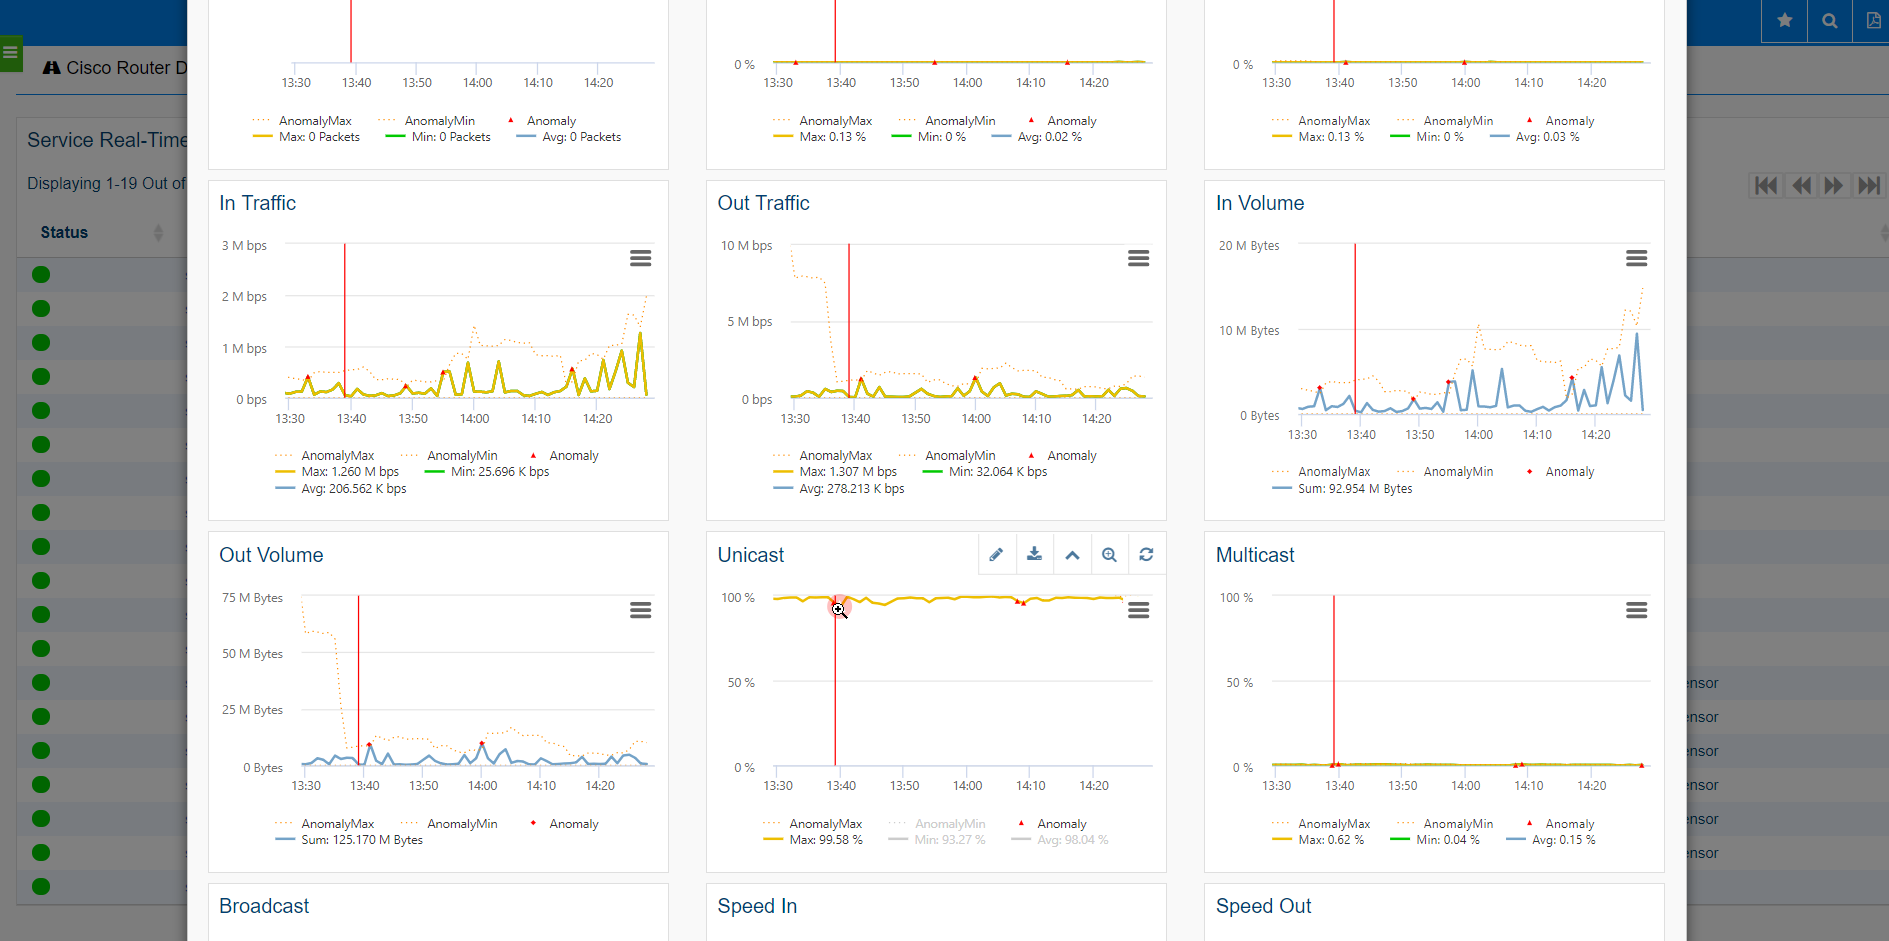
The use of the different monitoring functionalities specific to each IT silo makes it possible to unify monitoring within a single web interface in order to be more agile and have great flexibility to ensure equipment performance within the RATP Habitat IT ecosystem. ServicePilot allows IT teams to cover all their infrastructure monitoring needs: routers, ADSL access, SDSL, MPLS, Avaya switches, VLAN, Ruckus Wifi, firewalls, Windows servers virtualized with VMware vSphere, VCenter.
The screenshot below gives us a very good real-time visibility of the IT infrastructure monitoring.
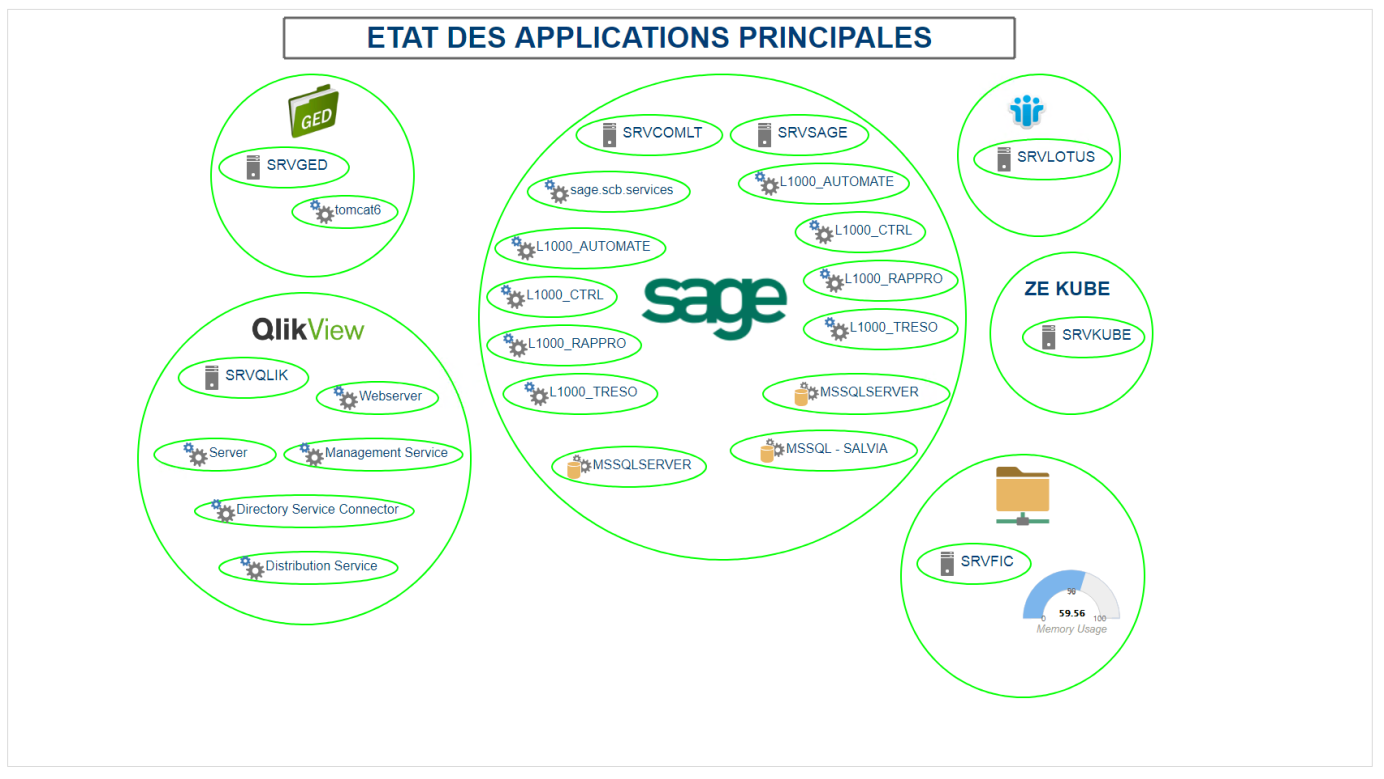
Application Performance Management Part
The Application Performance Management part is provided by views specific to each application in order to present its dependencies in a map that is easy to visualize, with a drill-down pointing to the performance details of each application component. In case of an incident on one of the applications, the zoom on the failed component allows to quickly analyze the root cause of the performance incident.
To start the project, 3 major applications were put under monitoring:
- QlikView for Business Intelligence and Data Visualization services (infra, Qlik Services, web server)
- Sage for the management and accounting service (Infra, MSSQL database with customized queries)
- GED for the Electronic Document Management service (Infra, Tomcat)
Product features
Although these 2 previous points were illustrated by real-time maps, ServicePilot integrates many features essential in standard to analyze the availability and performance of the Information System: Service weather maps, geographical maps, multi-holding secure access separation, automatic PDF reports, standard and customizable dashboards or the NoSQL search engine.
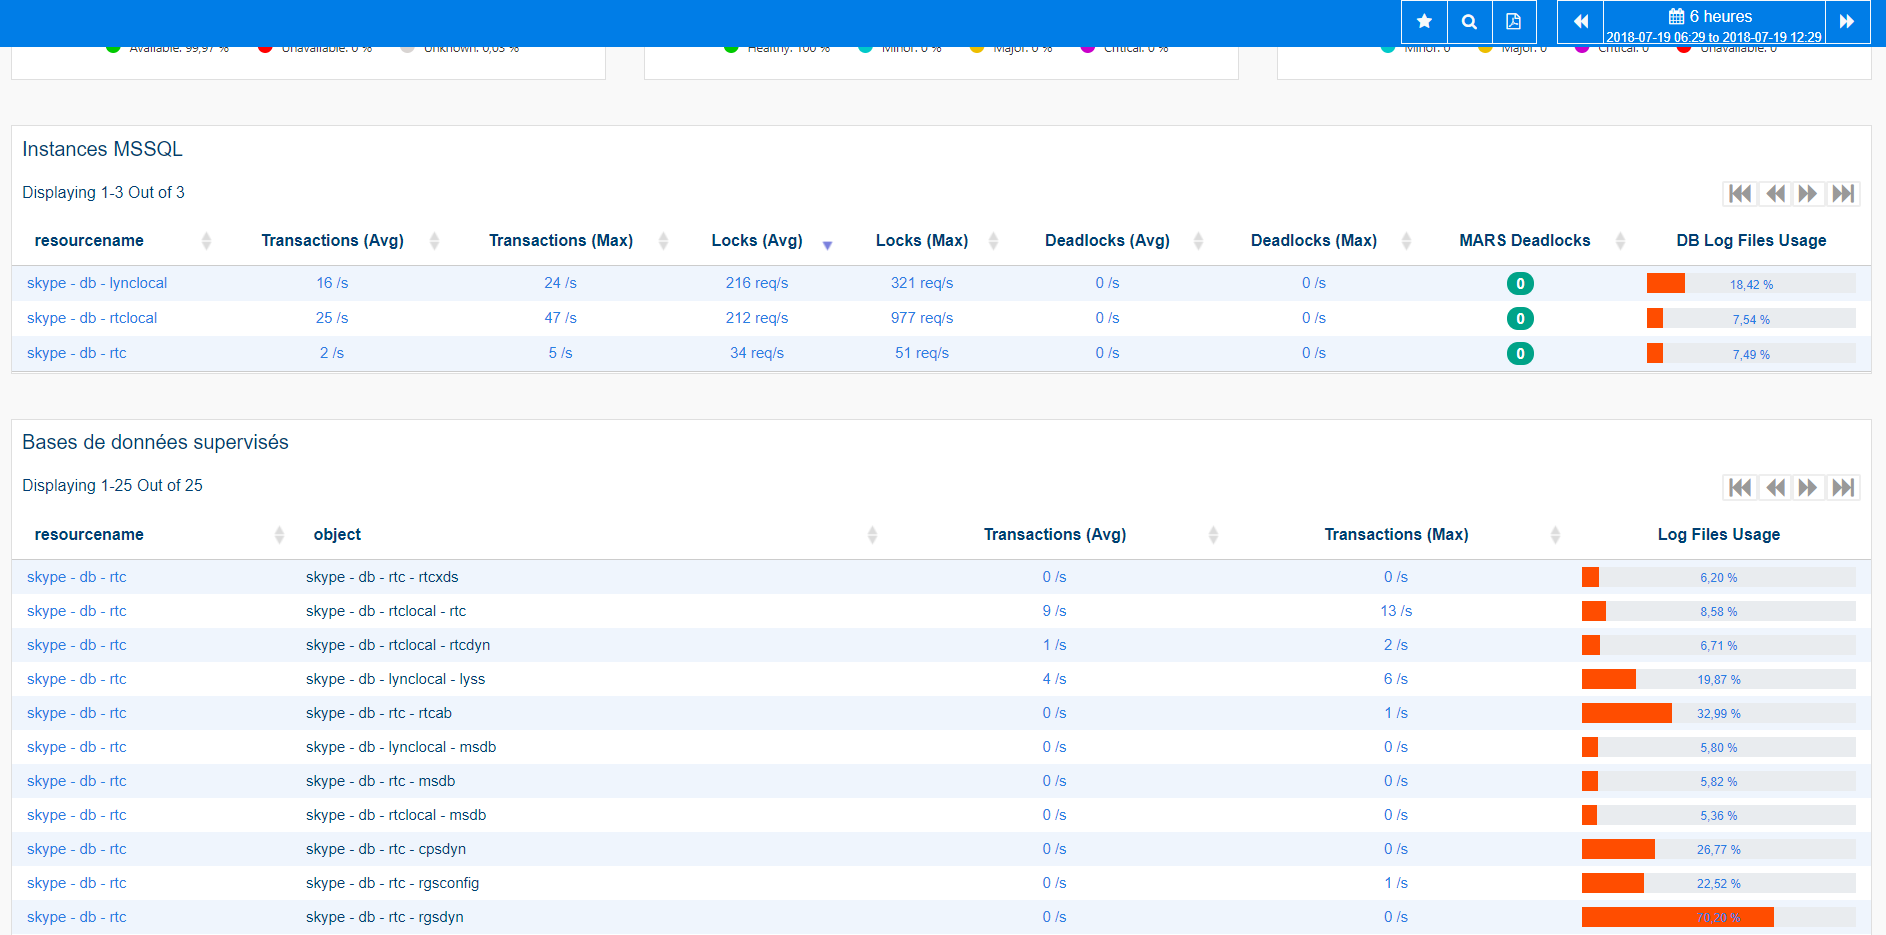
ServicePilot has pre-configured templates to accelerate the monitoring of standard technologies. The dashboard below is an example of a standard dashboard for monitoring MSSQL instances and databases.
"Of course, we had to adjust some parameters, adjust some maps, etc. But in practice, the implementation was very simple, and to cover the entire information system. I look forward to trying the next version in order to benefit from Machine Learning and improve trend analysis."
Benefits and results
"My team and I are very satisfied, we have a clear and total visibility on the performance of our information system. We can be proactive and diagnose incidents before they even impact users."
- Need in May, implementation in June in 2 days
- Answer to all my needs, significant improvement in the visibility of IT performance
- monitoring Systems, networks, APM
- Real-time health status
- Application chains
- Application availability rate
- monitoring cockpits
- Integration with the upcoming iTop ticket management tool
- Highly responsive support
How can we go further in monitoring application performance and managing security events?
"This was just a quick implementation. Now that the right foundations are in place, we can focus on optimizing and improving IT performance. We plan to add the monitoring of other applications (IBM Lotus Notes, Ze Kube, Backup,...) and business applications (Finance, Support, Security...)."
ServicePilot has additional features to go further in monitoring the real life of IT applications and a better ability to automate IT event analysis:
- monitoring of application transactions and traces of JAVA, .NET or IIS applications in order to better segment the uses of an application by site, or business group, with real user response time (RUM), errors, failed transactions, HTTP error codes...
- Analysis of application logs, and Windows Events to produce automatic reports on authentication and security events in morning check reports
2 essential building blocks for the construction of transversal application dashboards allowing information to be easily correlated beyond technological silos. The aim is to avoid transfers of responsibility during performance incidents and to facilitate communication among IT Management employees.
