Review of critical logs for security incident analysis
Although this log control checklist can be used for routine log review, this critical log review process is a security incident response analysis methodology based on the work of computer security researchers Dr. Anton Chuvakin and Lenny Zeltser.
The advantage of using ServicePilot based on and applying this operational security methodology is that these tasks can be performed and automated with one tool. Thus, these automatic analyzes can be easily inserted into routine control processes to take advantage of the automation of log review and be more proactive in responding to security incidents.
General methodological approach for the analysis of critical logs
Here are the 8 steps recommended by these researchers as well as 2 optional ones that we could add:
-
Identify log sources and tools to use during the analysis
-
"Copy" logs to a single location for review
-
Minimize "noise" by removing repetitive and routine entries from the logs after confirming that they are benign
-
Determine whether the timestamping of logs can be relied on; taking into account time zone differences
-
Monitor recent changes, failures, errors, status changes, access and administration events and other unusual environmental events
-
Go back in time from now on to rebuild actions after and before the incident
-
Correlate activities between different logs to obtain a comprehensive and operational overview
-
Develop theories about what happened; explore logs to confirm or refute them
-
Automate the analysis on a large scale and on a recurring basis
-
Confirm or deny the impact on IT production and business performance
Automated log and security analysis with ServicePilot
1. Identify log sources and tools to use during the analysis
Much of an organization's operational and security information can be derived from the log files generated by the company's servers, equipment and applications.
Potential sources of security logs are:
- Server and workstation operating system logs (Syslog, Windows Events, Sysmon Sysinternals...)
- Application logs (web server, database...)
- Security tool logs (Firewall, AV, IDS, IPS...)
- Outgoing proxy and application logs
- Other non-log sources for security events (performance data, NetFlow metrics, script results, etc.).
ServicePilot not only collects logs and events (Syslogs, Traps, W3C logs,...) but also offers several interfaces to speed up log processing and analysis: dashboards, PDF reports, alarms, map integrations, customizable interfaces, real-time and historical event loggers, etc.
Each new source or collector deployment such as the reception of Syslogs or Windows Events from new equipment is automatically integrated into the standard dashboards specific to each technology. Filters, calendaring and the creation of dashboards with custom widgets make it easy to segment what you are looking for and quickly identify anomalies in the mass of links that make up the IT security perimeter of a company.
The following screenshot shows a standard dashboard for Windows Events analysis with top n per server, allowing to Drill-Down to a particular Windows Event to investigate.

2. "Copy" logs to a single location for review
Locate your data sources and configure ServicePilot via YAML or web interface to send/receive logs and security event sources to manage logs in a unified way. It is difficult to juggle locally on several machines or to grep all over complex and distributed environments to understand what is happening.
Here are the typical locations of the logs:
- Linux operating system and central applications: /var/log
- Windows operating system and central applications: Windows event logs (security, system, application, Sysmon directory, specific directory, IIS...)
- Network devices: generally recorded via Syslog; some use proprietary locations and formats.
- Special, useful and proprietary logs; ServicePilot uses a natural parsing of a few fields for unformatted logs. It is possible to create custom packages or analyzes to better understand these messages.

To simplify analysis and subsequent correlation, a good method is to create a view (a kind of container or box containing disparate and/or homogeneous elements that you want to analyze) of the "Analyse-CVE-abc" or "SecurityRoutine-xyz" type.
In case these sources are already collected in ServicePilot, we can simply create a shortcut to this source or Object Search (automated search in logs that can perform many operations such as count, sum, etc.) to avoid duplication problems.
3. Minimize "noise" by removing benign entries from the log
It is essential to be able to minimize "noise" by removing repetitive and routine entries from the log file after confirming that they are benign.
Through simple filters and queries, we can filter and narrow the amount of events to gradually minimize the "noise" and minor events that disrupt the analysis. Checkboxes or simple query filters can be used to reduce the amount of playback (especially for Windows events...).
Several steps and techniques make it possible to find the needle in the log stack, in order to easily understand the dependencies and impacts of the incident, whether it is as early as provisioning, through analyzes from dashboards, through event trays, or through machine learning queries in the ServicePilot big data search engine (example: Machine learning for the analysis of significant terms and anomalies in logs and events).


4. Determine whether the time stamping of logs can be relied on
ServicePilot makes it easy for you and manages time stamps and time zone by indexing all data in UTC format and displaying the correct time zone based on the user settings of the ServicePilot web browser. No headache, it's made for you!
5. A watch for changes and unusual events in the environment
Recent changes, failures, errors, status changes, access and administration events and other unusual environmental events must be monitored.
- What to look for in Linux
Under Linux, you can search for many interesting keywords among the syslogs in order to detect them automatically:
- Successful user connections
- User login failures
- User disconnections
- Modification or deletion of user accounts
- Sudo Actions or service failures
Pre-built queries containing this type of search are available in standard, and allow not only to make simple tops, but also to see the same top with a machine learning algorithm to analyze significant terms for surface anomalies (Top with proportion raking).
- What to look for in Windows
Under Windows, event IDs are the main mechanisms for fast event skimming. Most of the events below are in the security log; many of them are only registered on the domain controller, and some are to be activated because they are not registered by default. However, it is easy to make tops on:
- The user's connection and disconnection events (Successful logon, failed logon, logoff, etc.),
- User account changes
- Password changes
- Services started or stopped, etc.
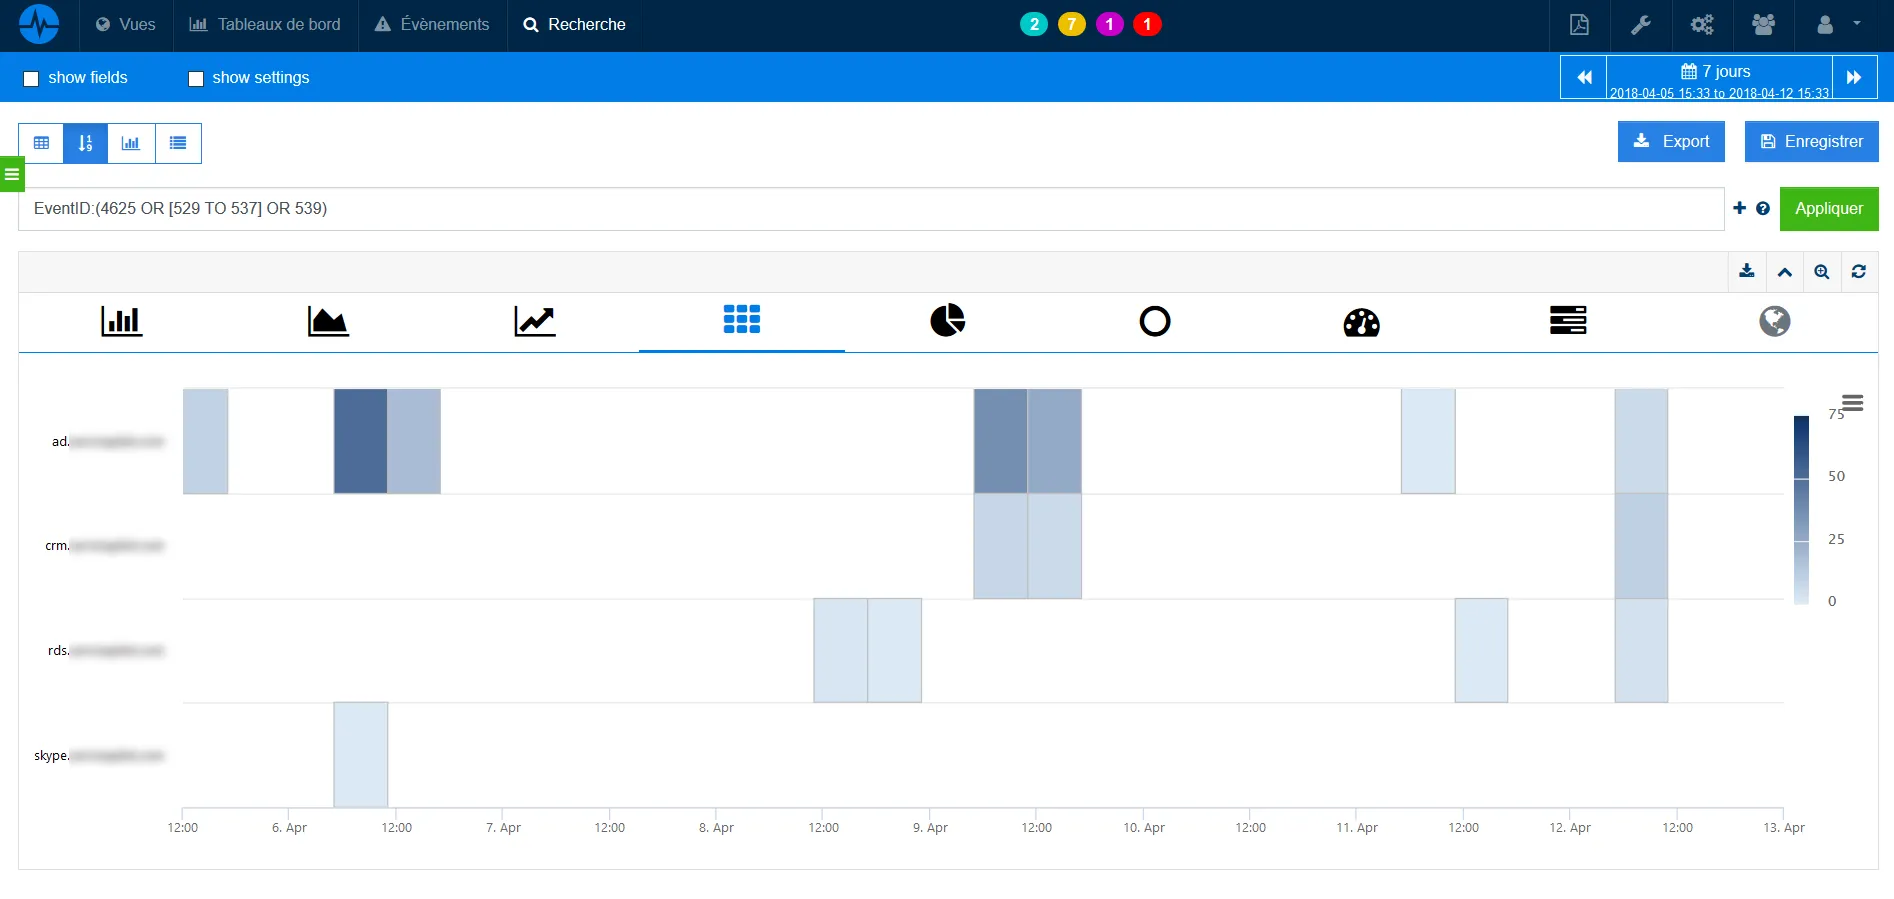
The screenshot below shows the tracking of failed connections on multiple Windows hosts over time.

ServicePilot also supports the analysis of Windows Sysmon Sysinternals logs, allowing you to record detailed Windows Events on process creations, network connections, registry events, file creations and many more.
- What to look for on network devices
On network devices, it is necessary to check incoming and outgoing activities. The examples below show extracts from Cisco ASA logs (%ASA); other devices have similar features.
- Authorized traffic on the firewall by looking for the messages: "Built... connection", "access-list... permitted"
- Traffic blocked on the firewall by looking for messages: "access-list ... denied", "deny inbound", "Deny ... by"
- Bytes transferred (large files?) by searching for messages: "Teardown TCP connection ... duration... bytes..."
- Use of bandwidth and protocols by searching for messages: "limit ... exceeded", "CPU use", "CPU utilization".
- Attack activity detected when searching for messages: "attack from"
- Change user account by searching for messages: "user added", "user deleted", "User priv level changed"
- Administrator access by searching for messages: "AAA user...", "User... locked out", "login failed".
The example below shows us a follow-up of successful vs. failed authentications of a Cisco VPN of remote workers.

- What to look for on web servers
On web servers, it is necessary to pay attention to many parameters and indicators in order to easily locate unusual activities among thousands or millions of requests:
- Excessive attempts to access non-existent files
- Attempts to access code (SQL, HTML) seen as part of the URL
- Attempts to access extensions that you have not implemented
- Web Service messages stopped / started / failed
- Access to "risky" pages that accept user entries
- Logs of all servers in the load balancer pool
- Error codes 200 on files that are not yours
- User authentication failures
- HTTP codes 4xx and 5xx...

ServicePilot's power for analysis
The objective is to use the pre-integrated queries included in ServicePilot, to customize them according to our environment, to automatically generate PDF reports or detailed dashboards for in-depth analysis and correlation.
For example, we could build several generic reports for each type of data source and a very high level overall for a quick review, as well as several dashboards for quick access to detailed analysis.
Building a custom global dashboard monitoring three different sources (e. g. syslogs, Windows events, and Suricata alerts in Syslog format) and making it my home page is relatively simple with the drag and drop functions of the web interface. The construction of a report is based on the same principles and share your saved widgets and dashboard graphs.

Having centralized my sources and logs in a "SecurityRoutine01" view, I only have to apply the filter view: "SecurityRoutine01" to filter any request / dashboard or report to the necessary sources.
Having already created custom widgets targeting the resources I want, I don't need to filter events on a host, view, application or resource. I can also create new queries to extend my analysis to the application level (SharePoint, Exchange...) and middleware by monitoring key security events in Microsoft SQL Server, for example:
- Change of administrator authority
- Changes in authorization
- Role of members
- Changing security settings
- Connection failure
- Data export by privileged users
The use of the ServicePilot architecture and native Machine Learning features also improve the analysis or reduction of supervisory noise. ServicePilot has pre-fabricated queries for faster obtention and search for what is needed in each technology, to do for example significant term and anomalies analyzes in logs and events.

6. Go back in time from now on to rebuild actions after and before the incident
After saving all queries in the previous step for automatic export to dashboards and reports, we can use the calendar in the dashboards or generate PDF reports for the selected time period.

7. Correlate activities between different logs to obtain a comprehensive and operational overview
In the dashboard creation menu, we can easily divide a dashboard into 3 parts, each representing a log type, a performance metric, an activity overview, a security request, etc. according to its needs.
The calendar function in the dashboard view and cross-tab graphical mouse pointing makes it easy to capture the complete image and correlate events between IT log sources and "noise" to focus on impact analysis and heterogeneous log or metric correlation sources.
This can be done using dashboards, queries through the search engine or PDF reports.
8. Develop theories about what happened; explore logs to confirm or refute them
To develop theories about what happened once the logs, events and sources have been confirmed and selected for post-legal analysis, we can construct a blank report model to describe the theory. This model can be built from well-known models of SANS incident rest reports or Pentest incident reports. These allow the process of analyzing security incidents to be unified and standardized. We can even try to create security incident documentation, to simplify the construction of the request and enrich my automated weekly reports with a new automatic security intelligence review.

9. Automate analysis on a large scale and on a recurring basis
Once the security incident is closed, we can automate the analysis of this incident with a query and include it in a weekly PDF report (e.g. every Monday at 8am a PDF Security Weekly Check is sent to the teams). This task can easily be automated for routine checks with scheduled PDF reports containing the result of the previous list of possible queries to detect abnormal activity in the entire IT stack.

10. Confirm or deny the impact on operational IT performance, the SecOps approach to production
It is also useful to analyze the impacts of security incidents on IT operational performance during the incident period, which can be easily achieved with dedicated dashboards and schedules. This makes it easy to answer questions such as: What was the impact of the abc security event on my application's response time? The following screenshot shows a DevSecOps vision to monitor an application in production.

