Monitoring the HIS of French hospitals

Technological and monitoring challenges
Obtain unified monitoring of infrastructure and applications. The monitoring software must be simple to set up, administer and allow easy check-up of IT regulatory obligations over the next 5 years.
The operational IS monitoring team needs to easily answer questions like:
- How to ensure a high-performance infrastructure to offer the best medical application services?
- What is the health of applications and business functional areas?
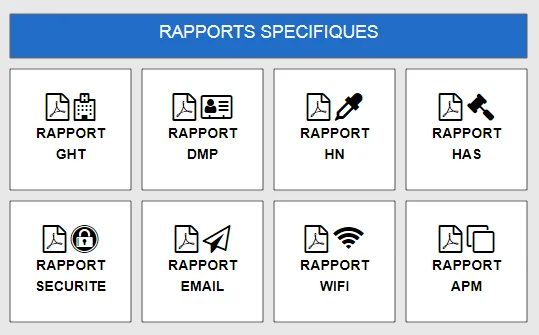
- How to produce my Digital Hospital audit reports in 1 click?
The challenge also resides in answering these questions automatically without hassle for several hospitals?
Customer industry
Regional Public Hospital Center, GHT support institution (head of regional HIS)
Monitoring solution
ServicePilot
Results after ServicePilot installation
« Stopping the production of a medical application has a direct impact on our patients. We must act quickly and have both global and detailed visibility to understand what is happening and avoid serious health situations. ServicePilot is essential to us. »
New features of ServicePilot 9.1 for hospitals
The ServicePilot version 9.1 allows, with its Server and APM monitoring Agent, to offer the IT "service" vision and a near full automatic 0 configuration with an automated discovery of applications in the server on which the ServicePilot 9.1 intelligent agent is installed.
The new version of ServicePilot also offers many improvements in terms of UI, wizards, machine learning algorithms, Big Data architecture performance and brand new collectors.
Monitoring HIS and hospital IT
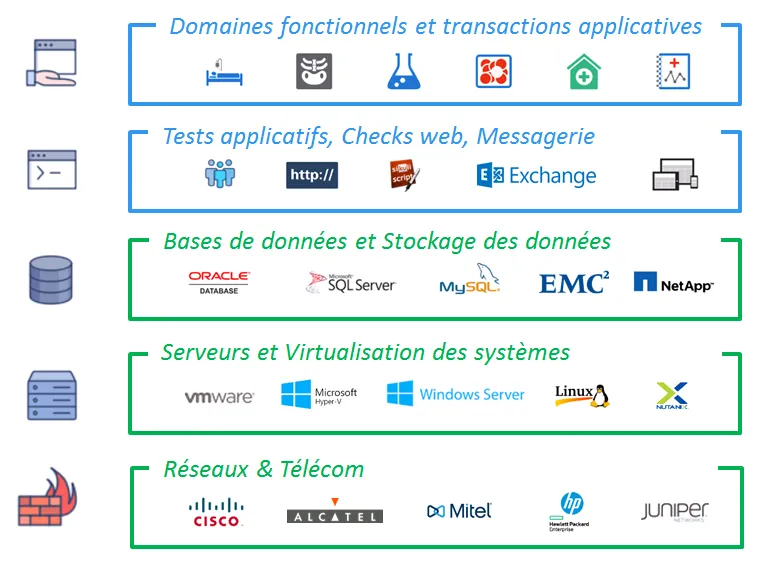
The diagram below clearly shows these different IT silos, often managed by different teams, but which are unified, making it possible to accelerate the detection of production incidents as well as reduce the time required for diagnosis and recovery to normal.
 |
Full-stack HIS monitoring
The IS team's needs are clear:
- Easy to administer and install
- Monitoring Systems, networks, APM
- Real-time health status of functional IT and applications
- Application chains and custom component integration
- Automatic reports on application service levels (SLO/SLA) and availability rates
- IT monitoring and business cockpits or weather maps
The contextual challenges of the sector are complex and numerous:
- The GDPR (General Data Protection Regulations)
- GHT (Groupements Hospitaliers de Territoire) and the public departmental convergence of several heterogeneous HIS
- Business projects such as the DMP (Shared Medical Record)...
- Programs such as PHN (Program for the digitalization of health seactor)....
- Labels or certifications such as those of the HAS (High Authority of Health)...
- City-hospital links, and collaboration between private, public and liberal institutions
The goal is to be able to provide a high-performance infrastructure to offer the best application services to users in different medical or business functional areas.
Weather-type IT service cockpit for hospital functional areas
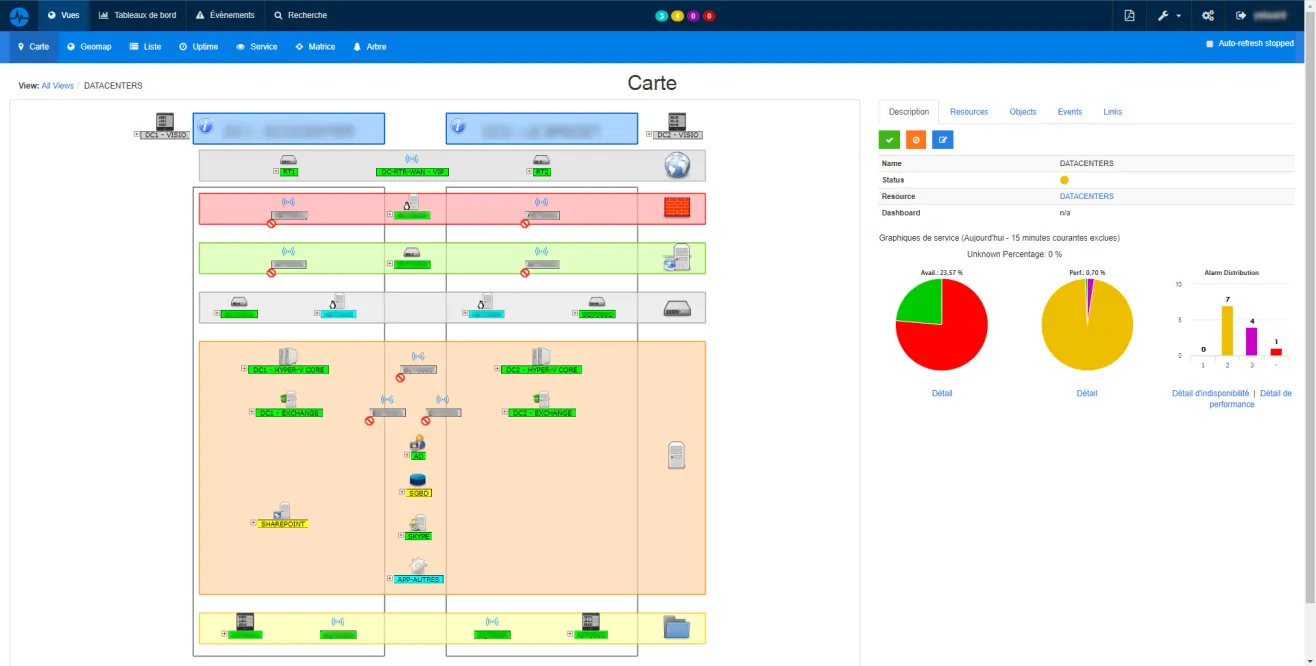
Monitoring the availability and performance of medical functional areas is simply possible in ServicePilot using customizable web maps such as DSI Cockpit or Service Weather.
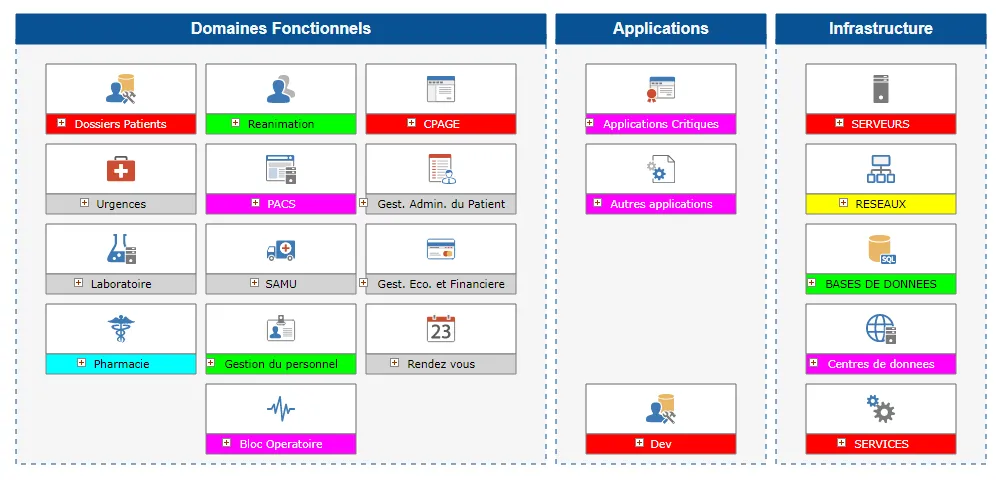
Unified supervision of medical fields and traditional IT infrastructure allows data to be quickly correlated to perform root cause analysis of incidents.
Business application performance
ServicePilot automates SQL queries in medical application databases to measure the volume of application flows.
For some applications, ServicePilot can monitor the repositories to detect possible application bottlenecks.
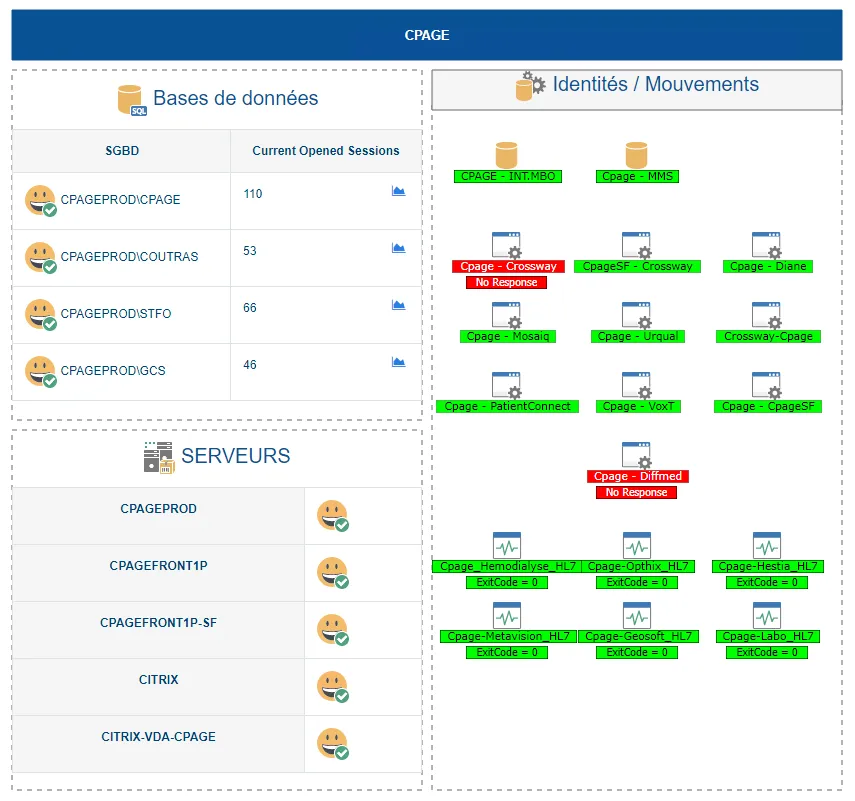
By grouping each application infrastructure resource, in addition to the key performance indicators of the applications themselves into distinct views, you can quickly isolate failed application components at a glance.
Drill-down on the object in error provides access to more complex technical indicators and dashboards in order to quickly diagnose the incident and its impact on the quality of service of the supervised functional area.
Standard application performances
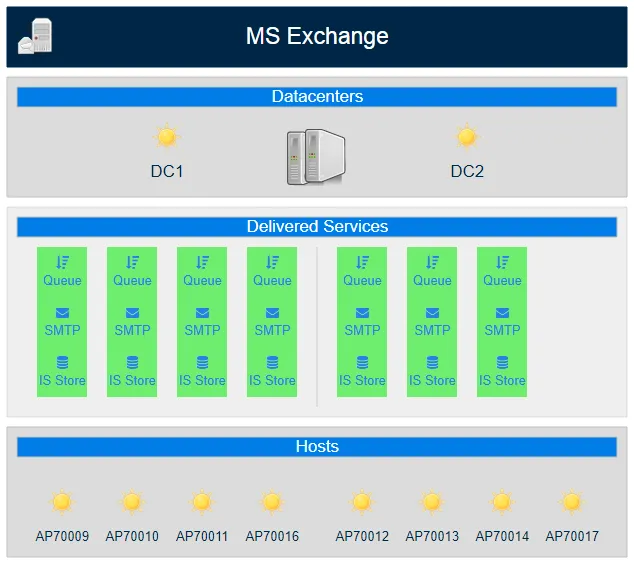
Detailed supervision of AD, DNS, DHCP, Microsoft Exchange email services, script integration, application scenario execution, website monitoring or TCP application testing.
The mapping illustration above simplifies the supervision of a Microsoft Exchange email application and allows you to perform a drill-down to quickly diagnose incidents in the event of a problem.
 |
Monitoring of databases and storage infrastructure
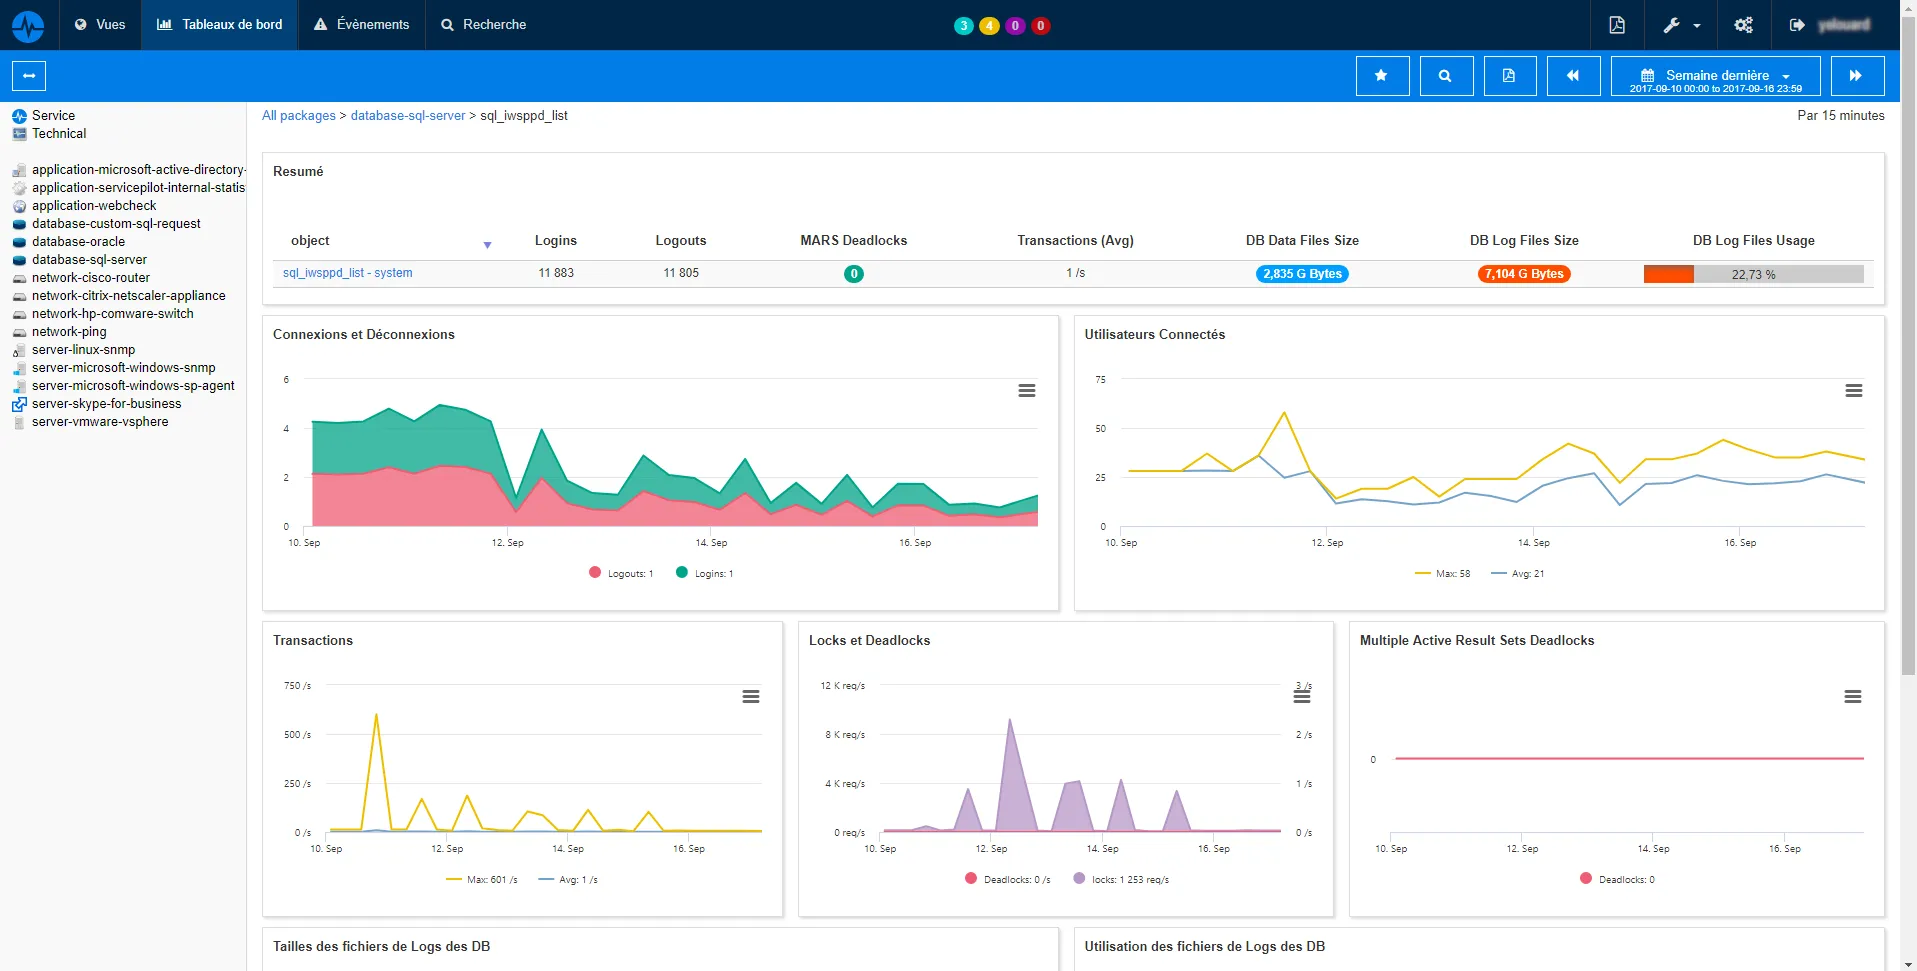
Databases and storage are at the heart of the company. Their proper functioning is vital for the smooth running of the patient's journey, the feeling of the HIS user. The end-to-end supervision offered by ServicePilot gives you full visibility.
Server and virtualization monitoring
For physical servers, Windows and Linux OSs, VMware and Hyper-V virtualization environments, ServicePilot collects key performance indicators to anticipate service degradation and improve system infrastructure availability. The ServicePilot Collection Agent allows you to collect memory or IO consumption data by process automatically.
Network supervision
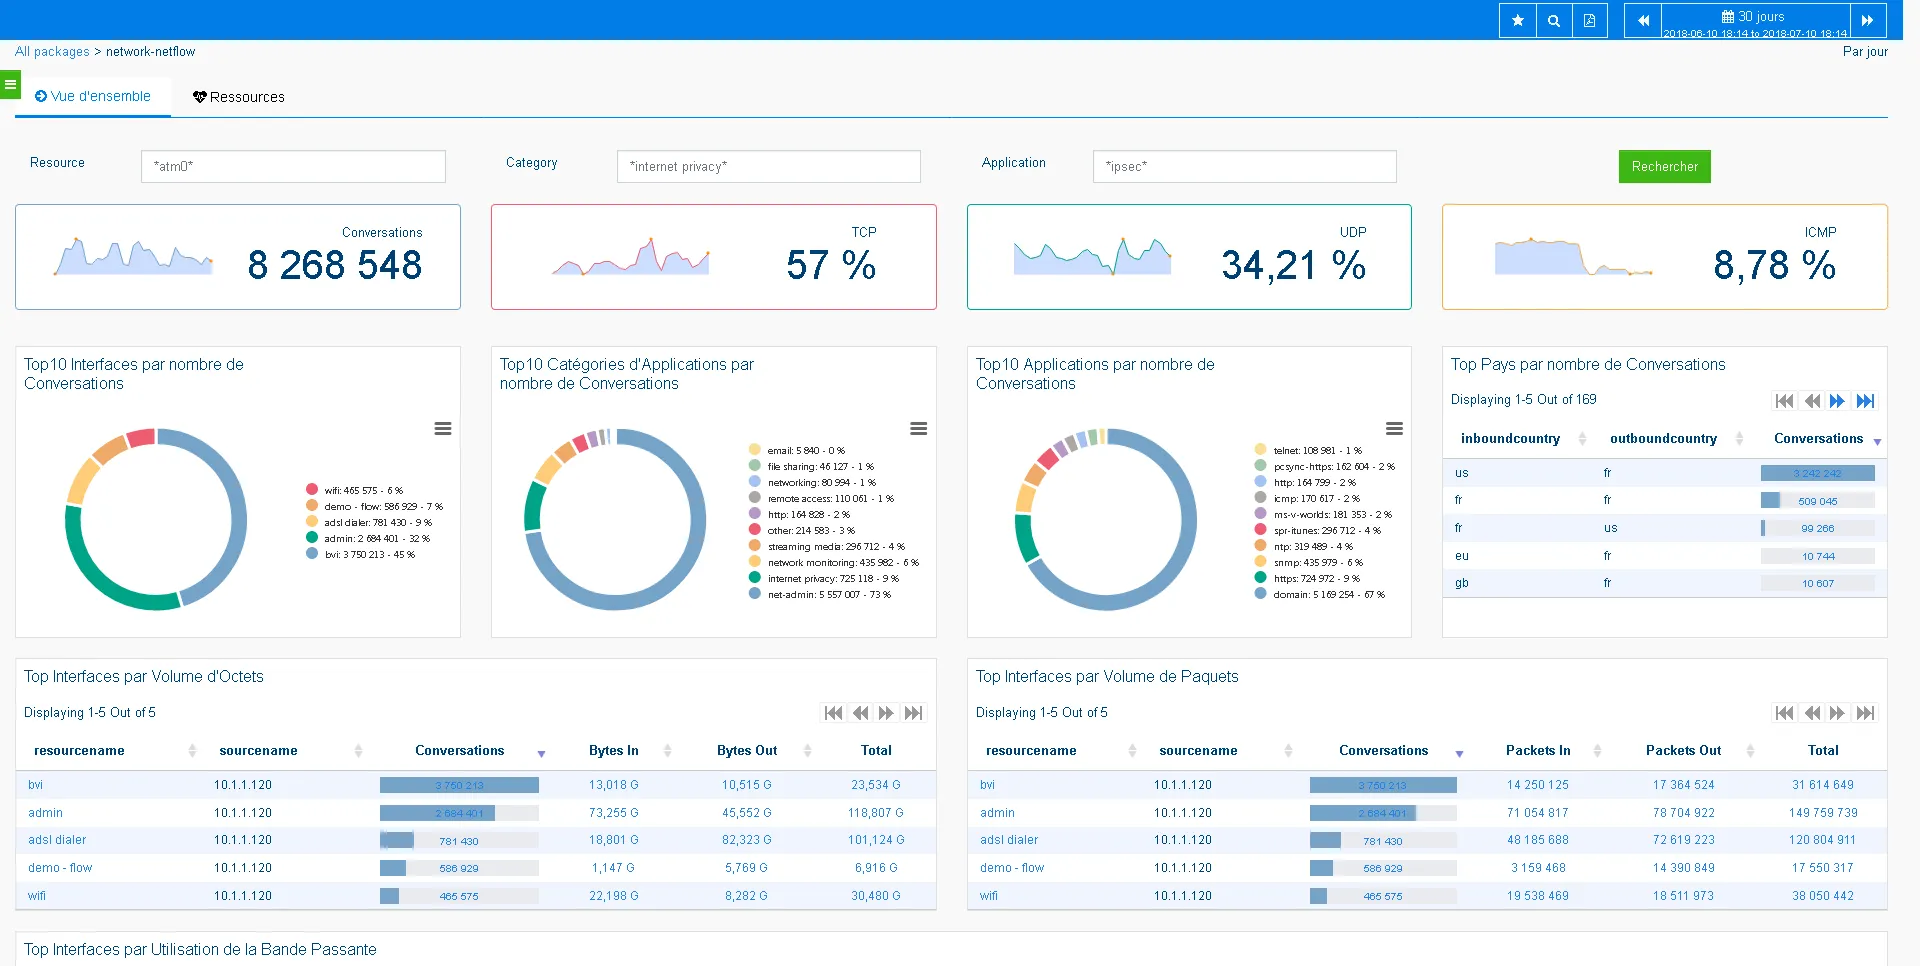
With bandwidth-intensive applications, your network performance can deteriorate rapidly and affect operational efficiency, user experience and overall hospital service performance. Mapping, SNMP metrics or interface monitoring by network flows allow you to quickly determine who does what, when and how on your network.
Telecom and VoIP call quality management
To help identify real problems impacting telephony, ServicePilot monitors your DECT terminals, PBXs, and telecom infrastructures to locate poor quality calls in order to improve IP telephony with a multi-vendor solution.
Features to simplify hospital IT monitoring
Service weather, geographical mapping, multi-tenant access to secure access, HIS monitoring cockpit display, 1-click HN reporting, Alert and condition management, Big Data, Machine Learning, custom and standard dashboards...
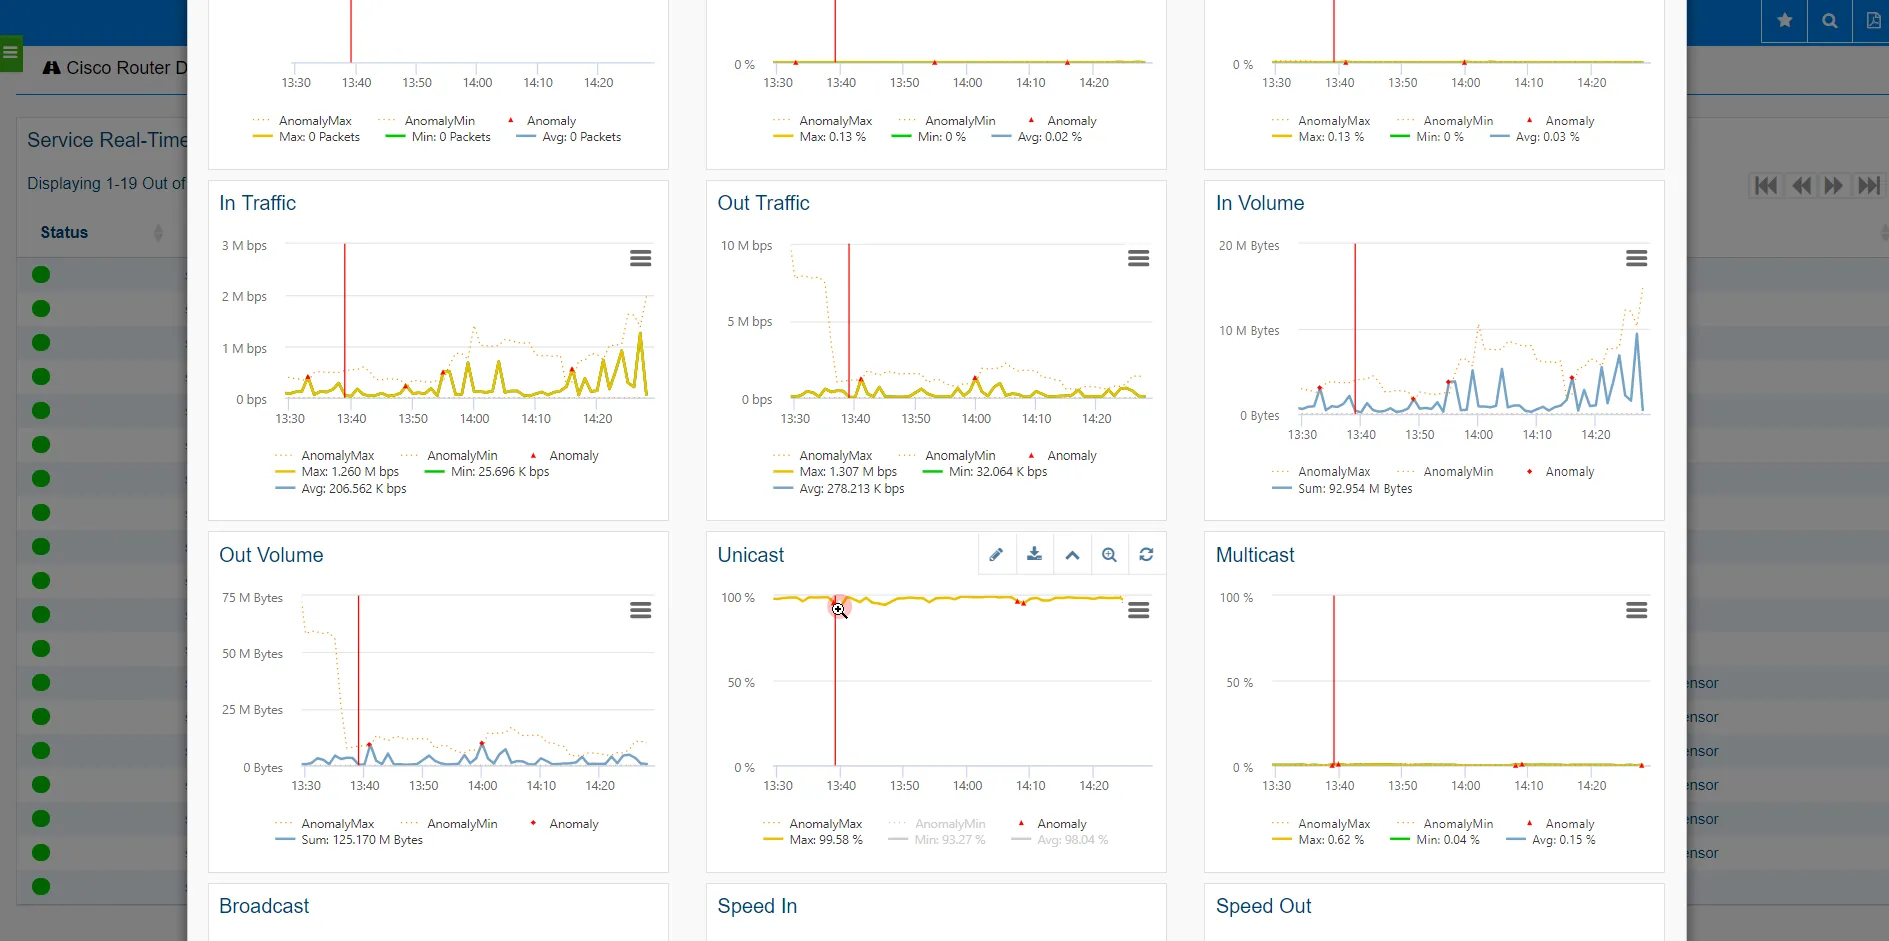
A supervision solution must be simple to implement and provisioning must be reliable, fast and with maximum automation to avoid repetitive tasks. The ServicePilot Server Monitoring Agent allows you to quickly meet your objectives:
- Reduction of incidents
- Reduction of incident resolution time
- Risk reduction
- Cost reduction
- Improving service quality
- User satisfaction
- Capacity analysis
- SLA reporting for management
Benefits and results
« My team and I are very satisfied, we have a clear and total visibility on the performance of our information system. We can be proactive and diagnose incidents before they even impact users. »
Ready to meet current and future sector and regulatory obligations (RGPD, GHT, DMP, PHN, HAS...), ServicePilot meets all supervision needs, with a significant improvement in the visibility of IS performance from the moment it was implemented:
- Supervision Systems, networks, APM
- Real-time health status
- Application chains
- Application availability rate
- Supervision cockpits
- Highly responsive support
How can we go further in monitoring application performance and managing security events?
Here are some suggestions to go further in the scope of the monitoring analysis and granularity:
- Server Agent and APM ServicePilot 9.1 for "service" vision and all automatic (automated application discovery)
- Capacity planning, trend forecasting and bandwidth monitoring to gain deeper analysis of loads, WAN access and application usage
- APM and application transactions monitoring of JAVA, DotNet, IIS or HTTP applications in order to better segment the uses of an application by site, or business group, with response time, errors, failed transactions, application flows...
- QoE, test scenarios and user feedback from a few pilot sites to check for fluctuations in latency, access between different sites within the GHT
- Monitor application logs, and Windows Events to produce reports on authentication and security events such as automated morning check.
- Create a custom interface to generate critical IT performance audit PDF reports in 1 click....
