Multi-site IT Monitoring for the Retail

Challenges of IT monitoring for digitalized Point of Sales
The distribution sector and sales stores have highly centralised information systems, with problems of supervision of heterogeneous environments and distribution of IT services for all employees. We will see in this article how to supervise a retail oriented IS, from the datacenter to the point of sale with the help of ServicePilot.
On a chain of supermarkets or textile shops, the problems of the store manager and the IT team need to answer the same problem :
When the metal curtain rises, is the shop operational?
**- WAN access? **
- Wi-Fi access?
- Cash register systems?
- Payment terminals?
- Counting and analysis of visitor flows?
- Video surveillance?
How to answer these questions automatically for hundreds, even thousands of agencies or stores? "
Monitoring Industrialization through package modeling
We start with modeling the sites with templates in order to correspond to the computer reality of the stores, that is to say,
1 site = 1 access router + x switches + y cash register systems + z payment terminals + ...
Several templates or models can be created in order to adjust the variables and specificities of such or such site, size, brand...
Each technological model such as router, switch, etc. automatically includes its indicators, dashboards, predefined alert thresholds, interface discovery rules, as well as their integration into maps.
You can integrate much more information such as information terminals, control terminals, security systems and videos, environmental sensors, access to a centralized business application... depending on the provisioning method of your choice (Web Interface, YAML and/or Excel)

The modern web interface allows you to easily design your store model with drag and drop and other mechanisms in order to stick as close as possible to the desired monitoring granularity.
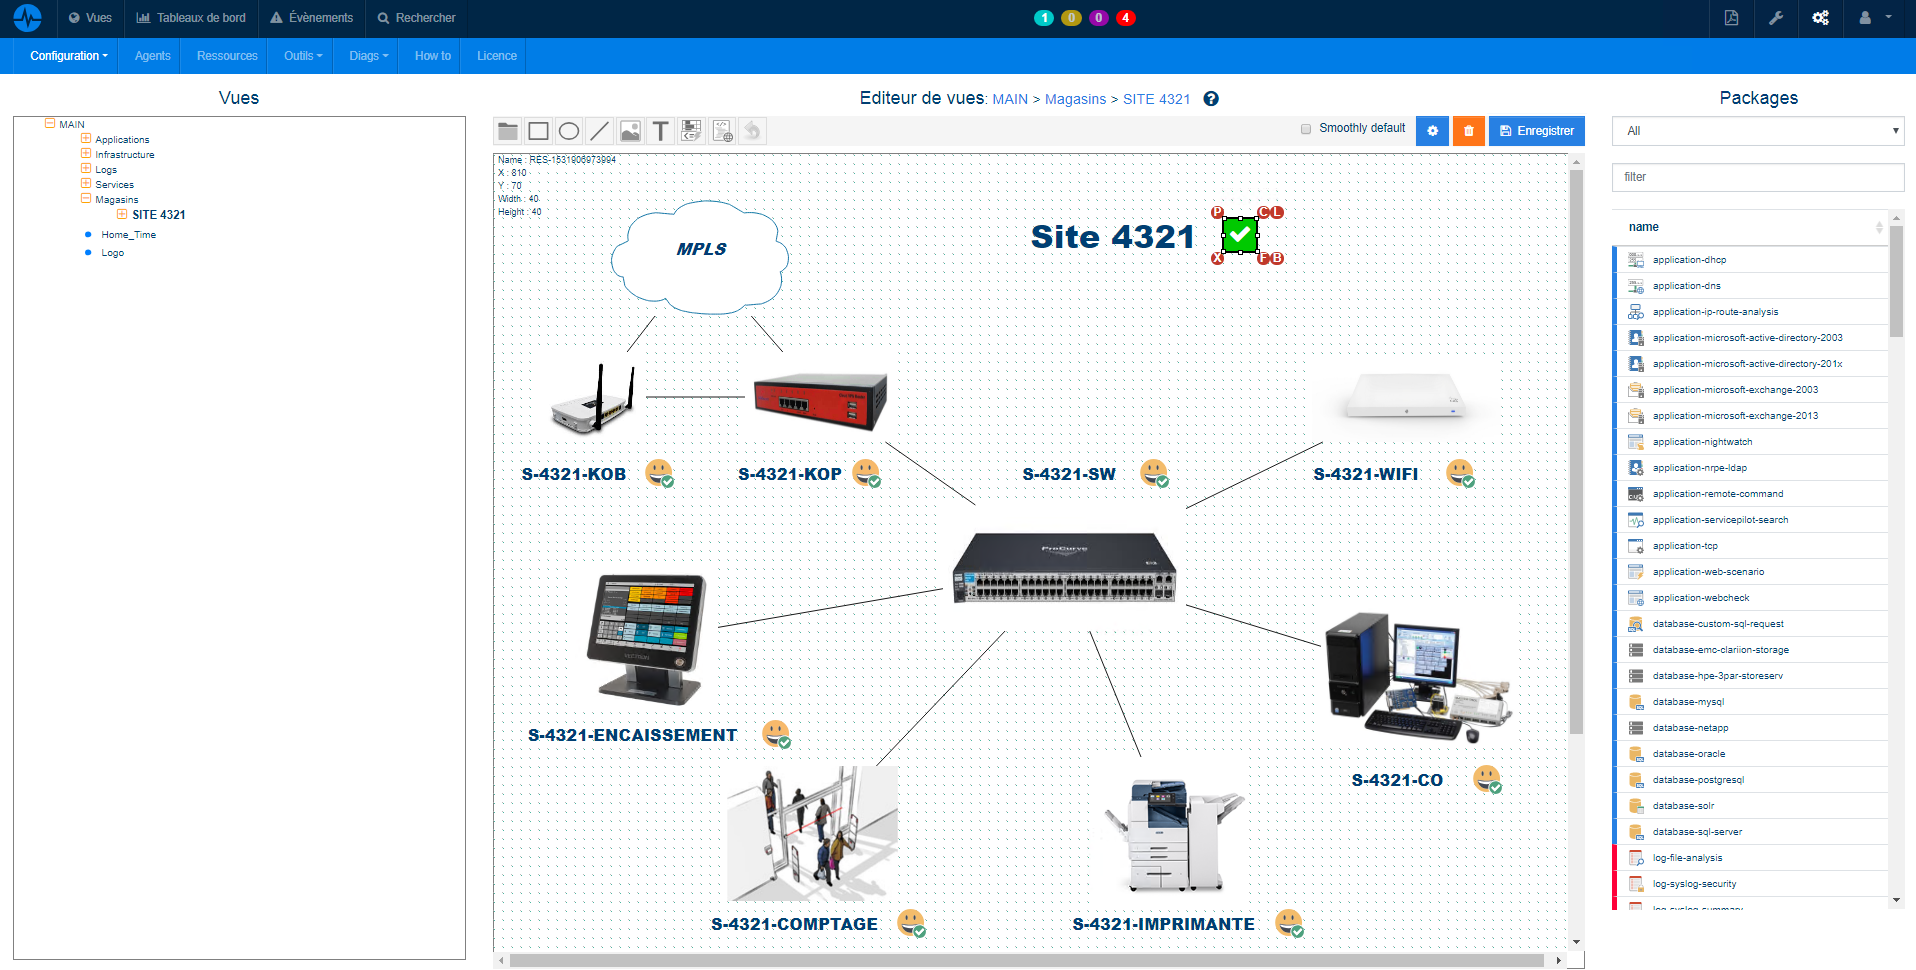
Automatic geographic monitoring map
We then list each site with a name, an IP range and geographical coordinates, in an excel for example, by applying the associated template in order to finalize the automodeling of sites in ServicePilot.
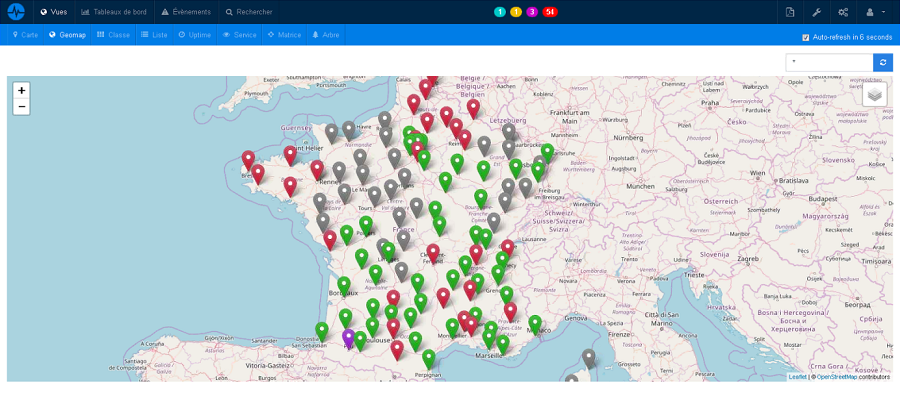
The geographic mapping illustration above allows you to automatically filter and zoom in on sites to proactively detect and locate incidents.
Drill down and zoom in on a site
The drill down zoom on the site in question makes it possible to visualize the details of performance and health of the various computer components of the site in question. Creating site templates in the previous step allows us to standardize visibility by site and quickly access an interface that is easy to understand at a glance.
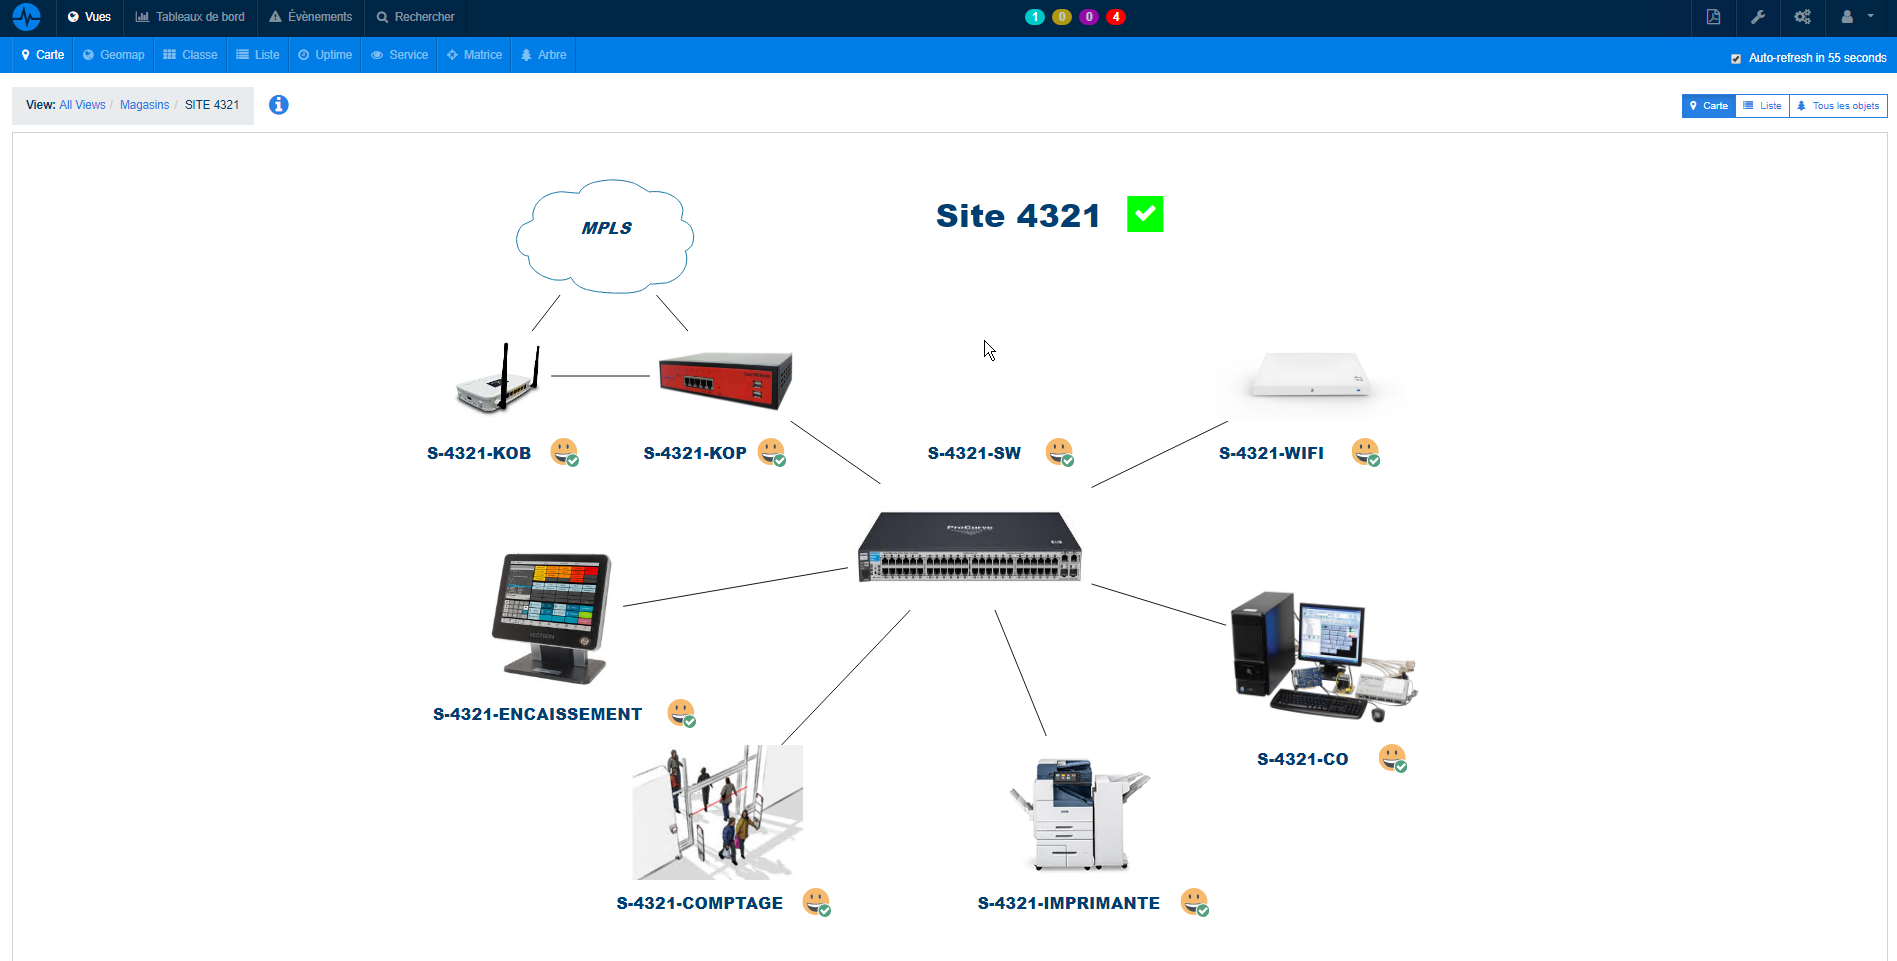
Thus the level 1 support team can easily check the state of the sites and zoom in on the site of such a place in which equipment is down, then access the instructions in order to help the return to normal. Have a macroscopic, and microscopic view of my IT.
The pre-diagnosis of an incident or an alert is easily carried out on an indicator / object in the event tray according to predefined thresholds, or customizable according to requirements per site, per business, per application, per equipment...
Promote IT challenges and importance towards collaborators
Although we speak of retail, this model is applicable to any company based on IT replication in its sites. It can be a point of sale like shops, agencies, restaurants,... beyond the retail sector, it applies to any company following a similar computer model on its sites.
All have the same problem, offering the best customer experience and guaranteeing continuity of service. You must be able to * guarantee productivity and ensure the security of both customers and employees in a complex and heterogeneous* infrastructure environment.
It is useful to know how to popularize the performance and availability of IT services with service weather monitoring cockpits to facilitate communication within the company with store managers and thus increase IT performance. The example below shows a simplified representation of the performance of a site, in which we quickly see that one of the 2 boxes of the site is not available.
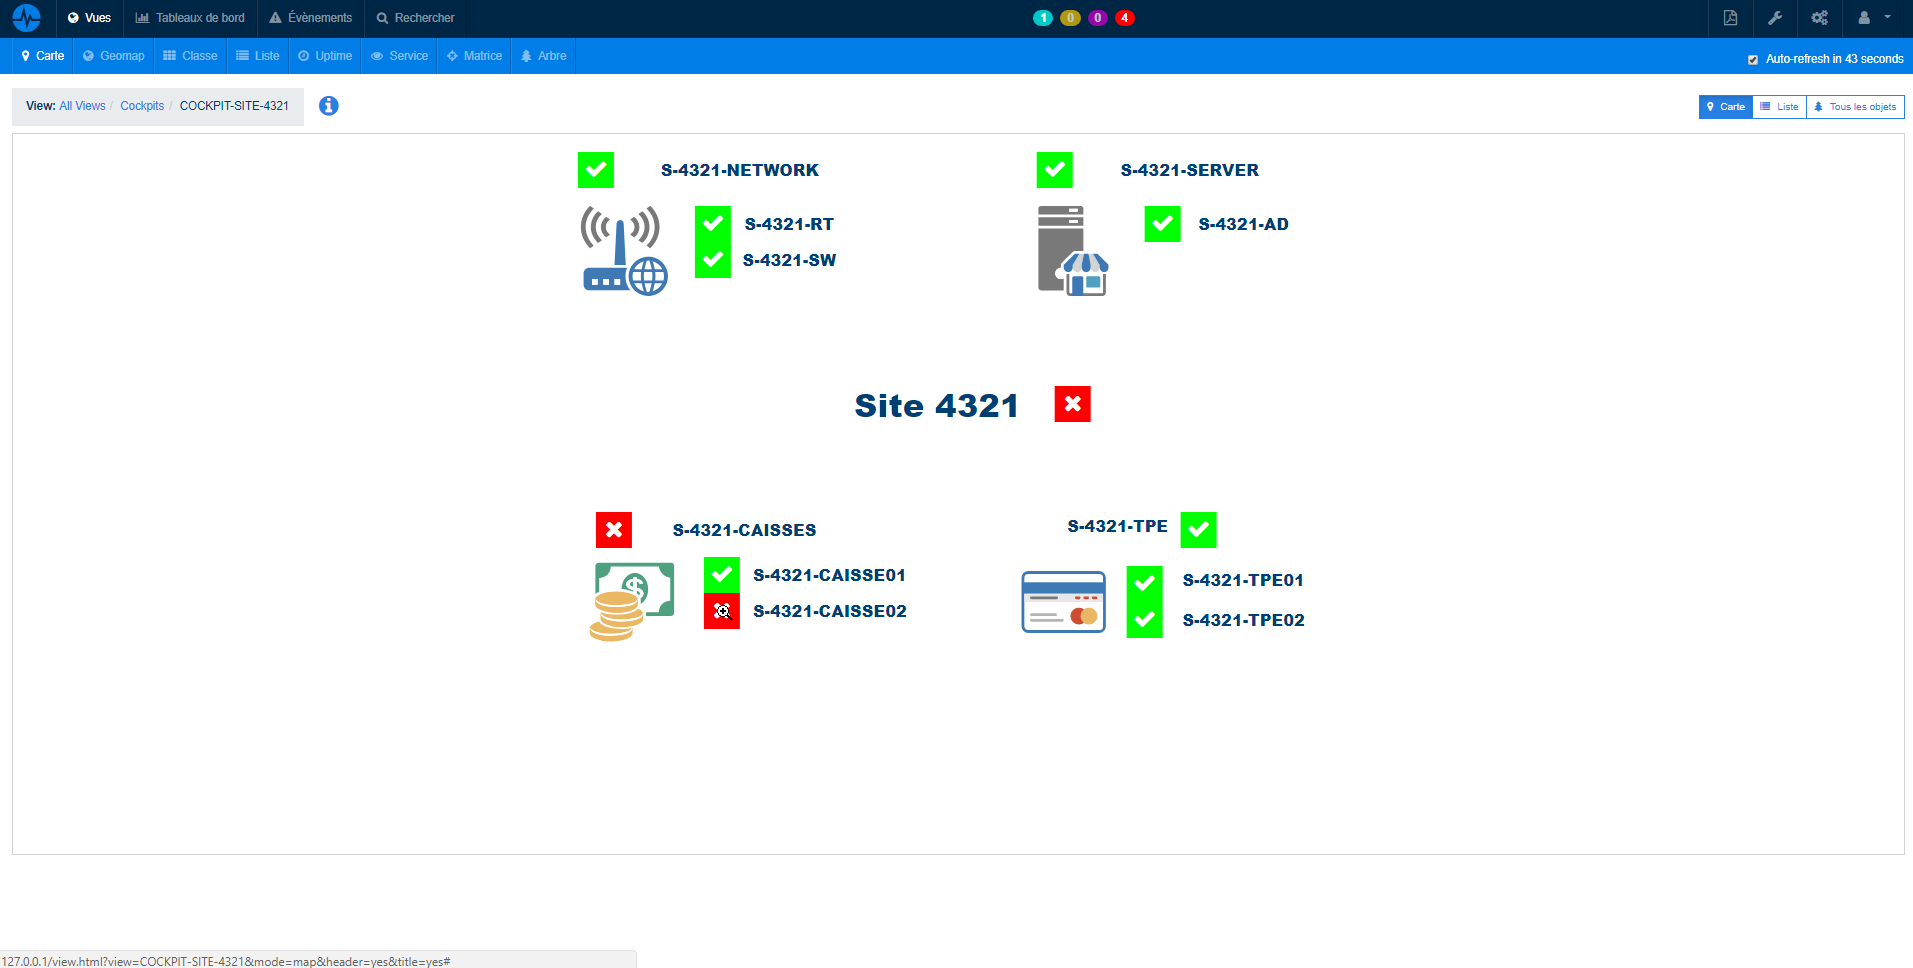
IT challenges for teams in the field
For the teams in the field, the IT challenges are :
- Favour the autonomy of the N1 support team
- Return oxygen to operators by automating administration
- Provide management teams with high-level indicators and views
- Provide technical and complex indicators to easily communicate with experts and technicians
Pinging on each router is not enough. The cost and time required to resolve incidents also depend on pre-diagnosis, enabling the earliest possible response in order to restore service to employees and customers.

Detailed and complete monitoring interfaces
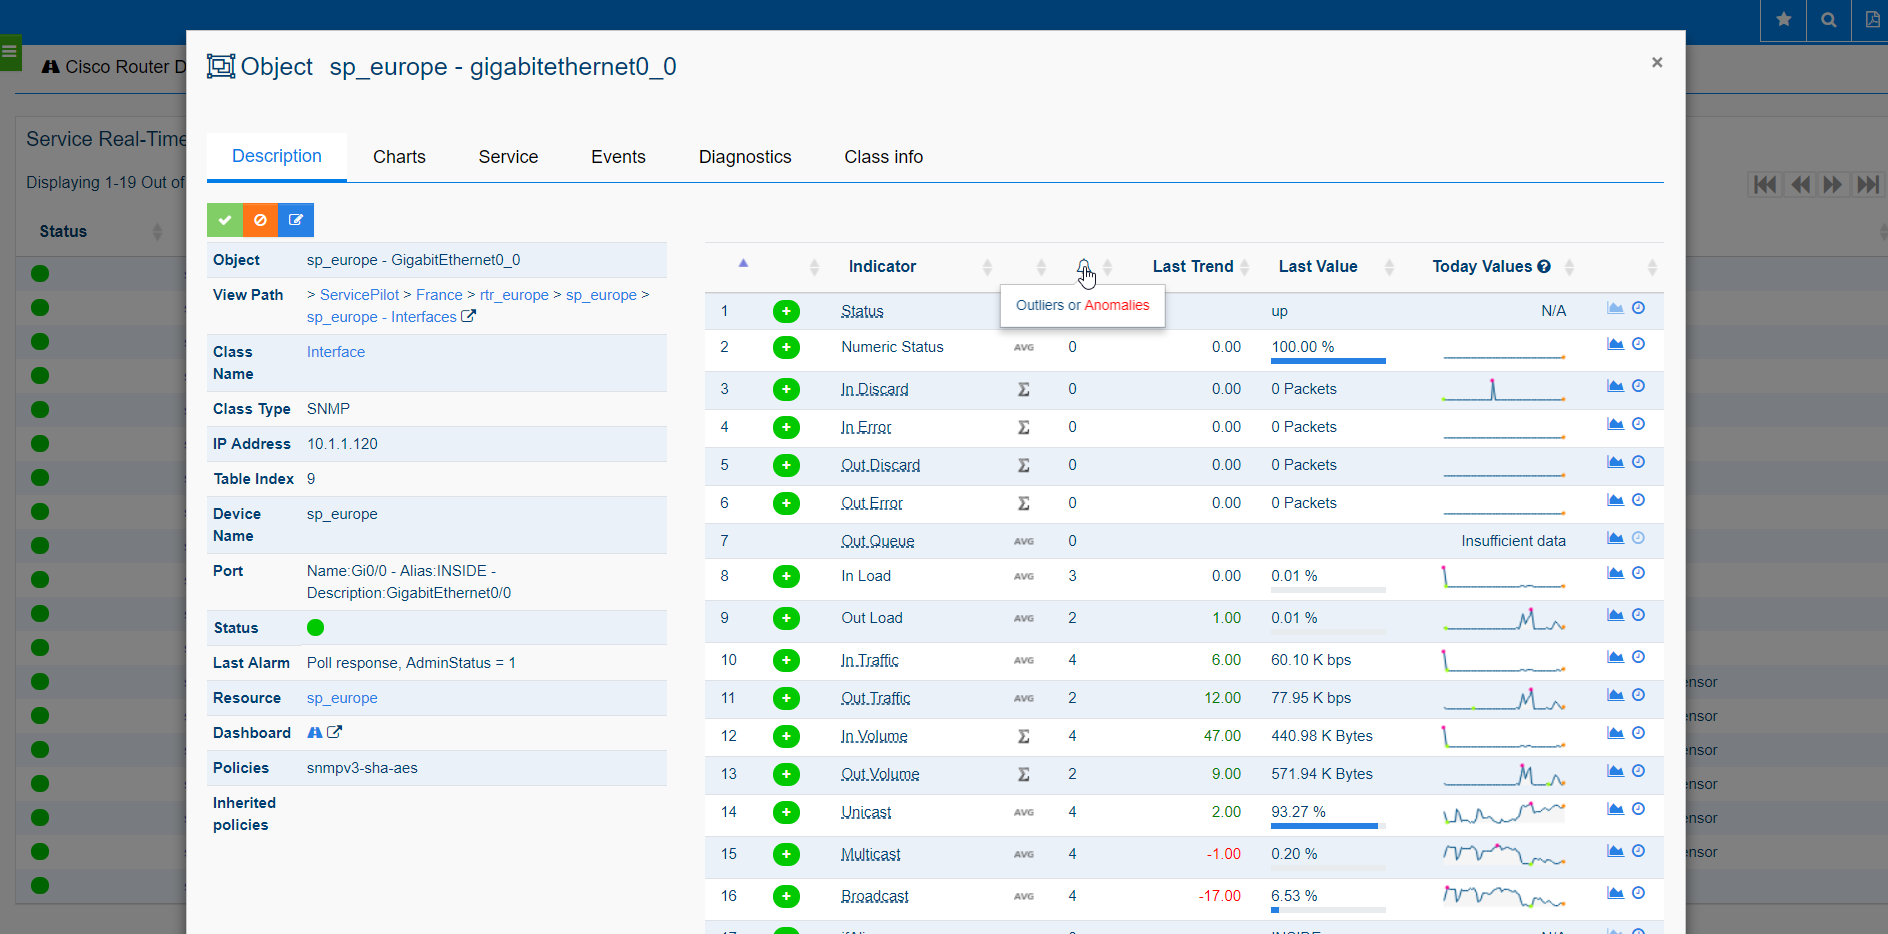
The screenshots above and below show the drill down on a router detail with one-click access to detailed availability and performance indicators (real-time and historical). We can easily see on the following screenshot that we benefit from very practical technical indicators with outliers and activity anomalies detection, as well as a trend calculation on numerical values to observe the evolution of the indicators at a glance.
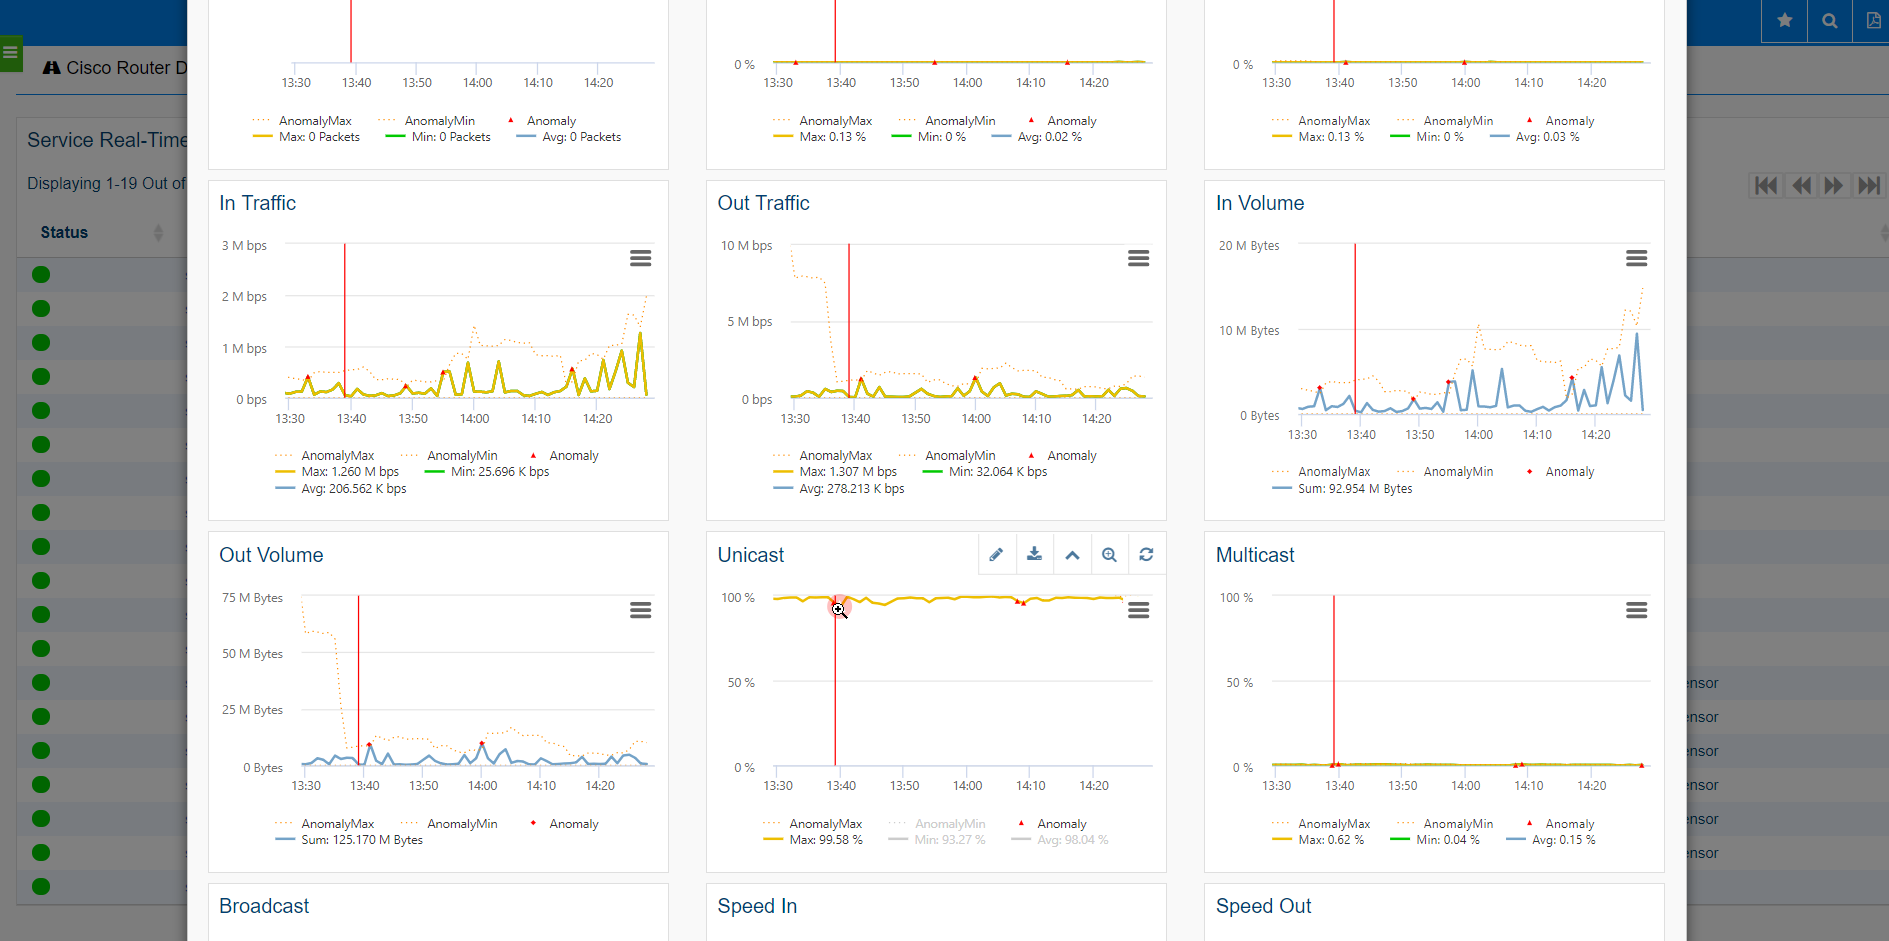
We can change the vision in one click in order to graph the indicators and correlate these indicators visually on several indicators in order to better understand the impacts of indicators on the other indicators of the supervised router interface.
4-step project management to supervise 1000 sites in 3 days
This type of project can go very fast if the prerequisites are respected (Windows machine, team availability, flow opening,...). Here are 4 steps to carry out this kind of retail monitoring project:
Create site template(s) in the provisioning Excel file with equipment templates and monitored indicators
Adjust site model mapping
Create and Import site list
Finalize customization, alerts, morning checks, ticketing tool integration
How can I go further in measuring user experience and optimize the APM performance of my sites?
Here are some ways to go further in measuring user experience and optimizing application performance on my sites:
Supervision of application transactions and traces of HTTP, IIS, .NET or JAVA Web applications to better segment the uses of each application by store or department with response times, errors, failed transactions for each transaction.
QoE, test scenarios and user experience from a few pilot sites to check for fluctuations in latency, access between different sites
Supervision of application chains and centralized application resources (databases, web server logs, etc.)
Capacity planning, trend forecasting and bandwidth monitoring to manage WAN access and SaaS application load
Business Operations Management, by introducing non-technical, business indicators (SQL queries, etc.), with DSI and service weather Cockpits for business managers
