SFlow audit for network flow management

Ministère de la Culture: SFlow audit for network flow management

The Ministère de la Culture is composed of a central administration, and has three types of decentralized institutions and services to carry out its action: the Regional Directorates of Cultural Affairs (DRAC), public institutions and services with national competence.
The Department's IT operating responsibilities have continued to increase, and as its IT perimeter increases, the management of bandwidth requirements becomes even more critical. Having encountered several problems on its WAN network as well as user complaints at remote sites (DRAC), the Ministère de la Culture has undertaken to have its network and network flows audited by an external company. The latter was mandated to produce reports to understand where the degradation came from.
The choice of tool to be used for the audit of network flows naturally turned to ServicePilot because this software already covered the monitoring of unified communications, the teams were operational on the tool, and there were turnkey packages for the analysis of flows on the network. In addition, the Department did not want to acquire probes or a complementary monitoring solution.
The conduct of a flow audit to analyze bandwidth congestion
This audit mission was divided into 3 stages:
- "Macroscopic" pre-analysis of the use of links
- "Microscopic" analysis of the links identified by the pre-analysis
- Recommendations to improve the overall effectiveness of the network
Phase 1: Analysis of SNMP's link usage
The objective of Phase 1 "pre-analysis" was to detect links that have had congestions. Before using ServicePilot to automate the monitoring of link provisioning, the Department only had historical data provided by the WAN operator. They were useful for identifying saturated links to be analyzed as a priority but not detailed enough for in-depth analysis. Thus, the highly and moderately saturated links over the previous months made it possible to create the list of sites that had been congested, which was used as a "starting point" for the microscopic analyses in the next step.
The advantage of using ServicePilot to monitor WAN links is the intuitive access to all the tool's features: Automation, PDF Reports, Dashboards, Creation of analysis widgets, Alerts, SNMP / SFlow Correlation, NetFlow... This allows you to use features adapted to reduce the average time for root cause analysis (RCA) and incident repair (MTTR).
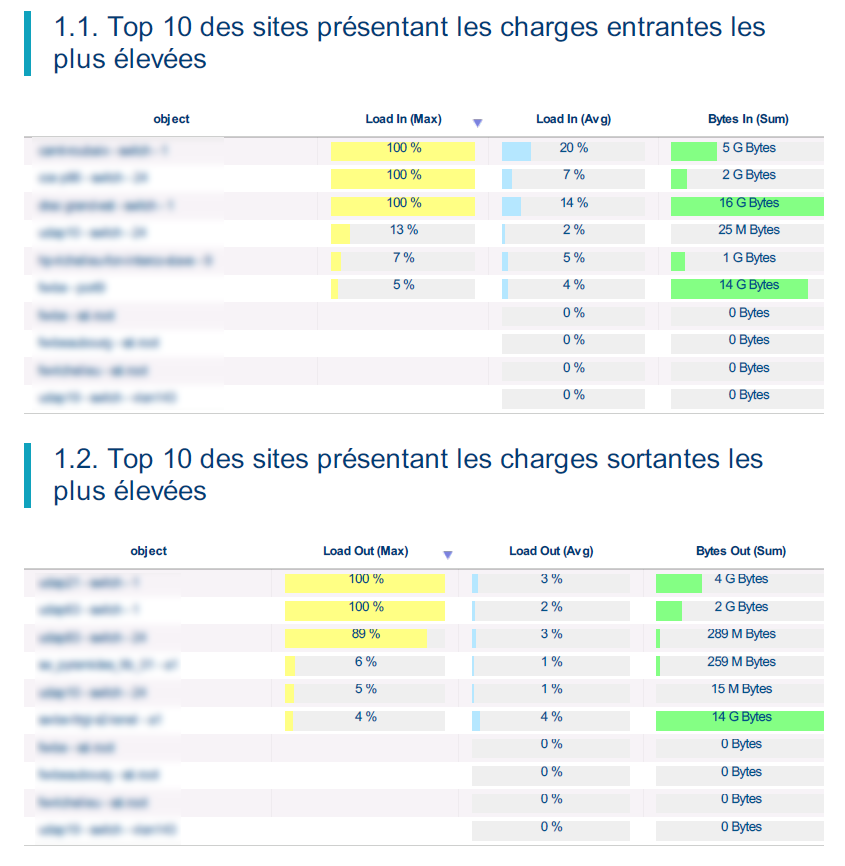
The ServicePilot monitoring solution was deployed on the WAN infrastructure for link load analysis in a matter of hours and ServicePilot confirmed saturations. The company in charge of the audit quickly took over the software: "For the deployment of ServicePilot, we filled in a file with the list of equipment to be monitored and the result was immediate. The granularity of the graphs per minute has helped us to understand saturated links in more detail. It remained to be seen which applications were responsible for these saturations.
Phase 2: Flows analysis on the most loaded interfaces
In order for the auditor to continue his investigation, the ministry activated the sFlow protocol on its network equipment and redirected the sFlows statistics to ServicePilot. ServicePilot immediately collected them and started presenting the information in its standard dashboards.
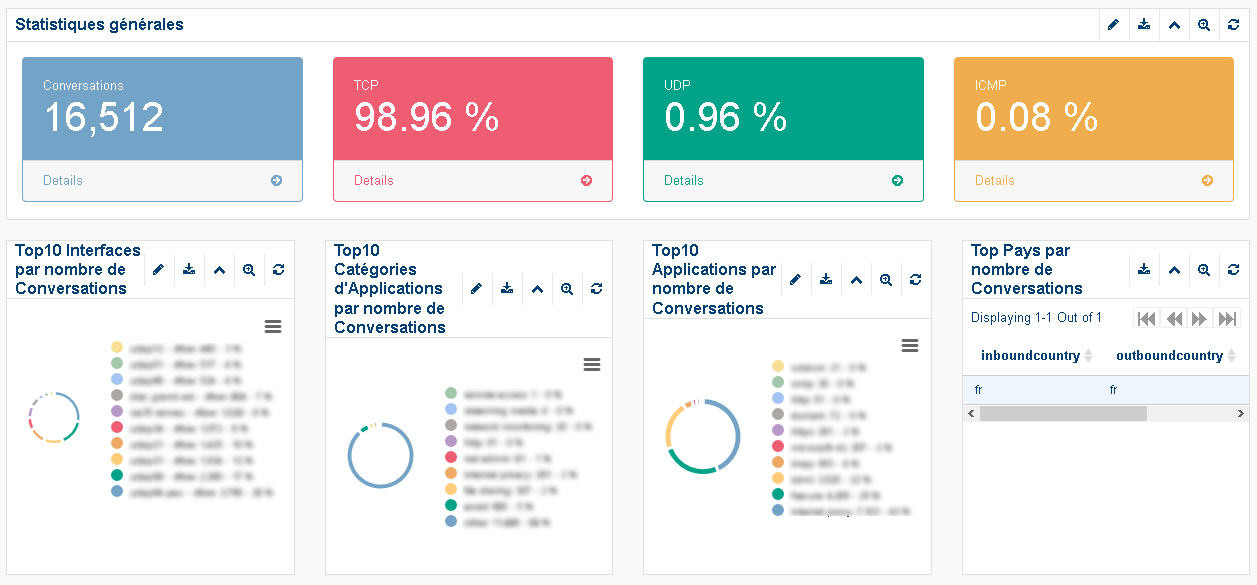
To automate the analysis of congestion problems, the company in charge of the audit was able to configure the tool and create new customized widgets for:
- Define applications
- Define application groups
- Create service class groups
- Create site groups
- Refine graphs by application category, number of conversations and byte volume
- Refine the distribution graphs by TOS,....
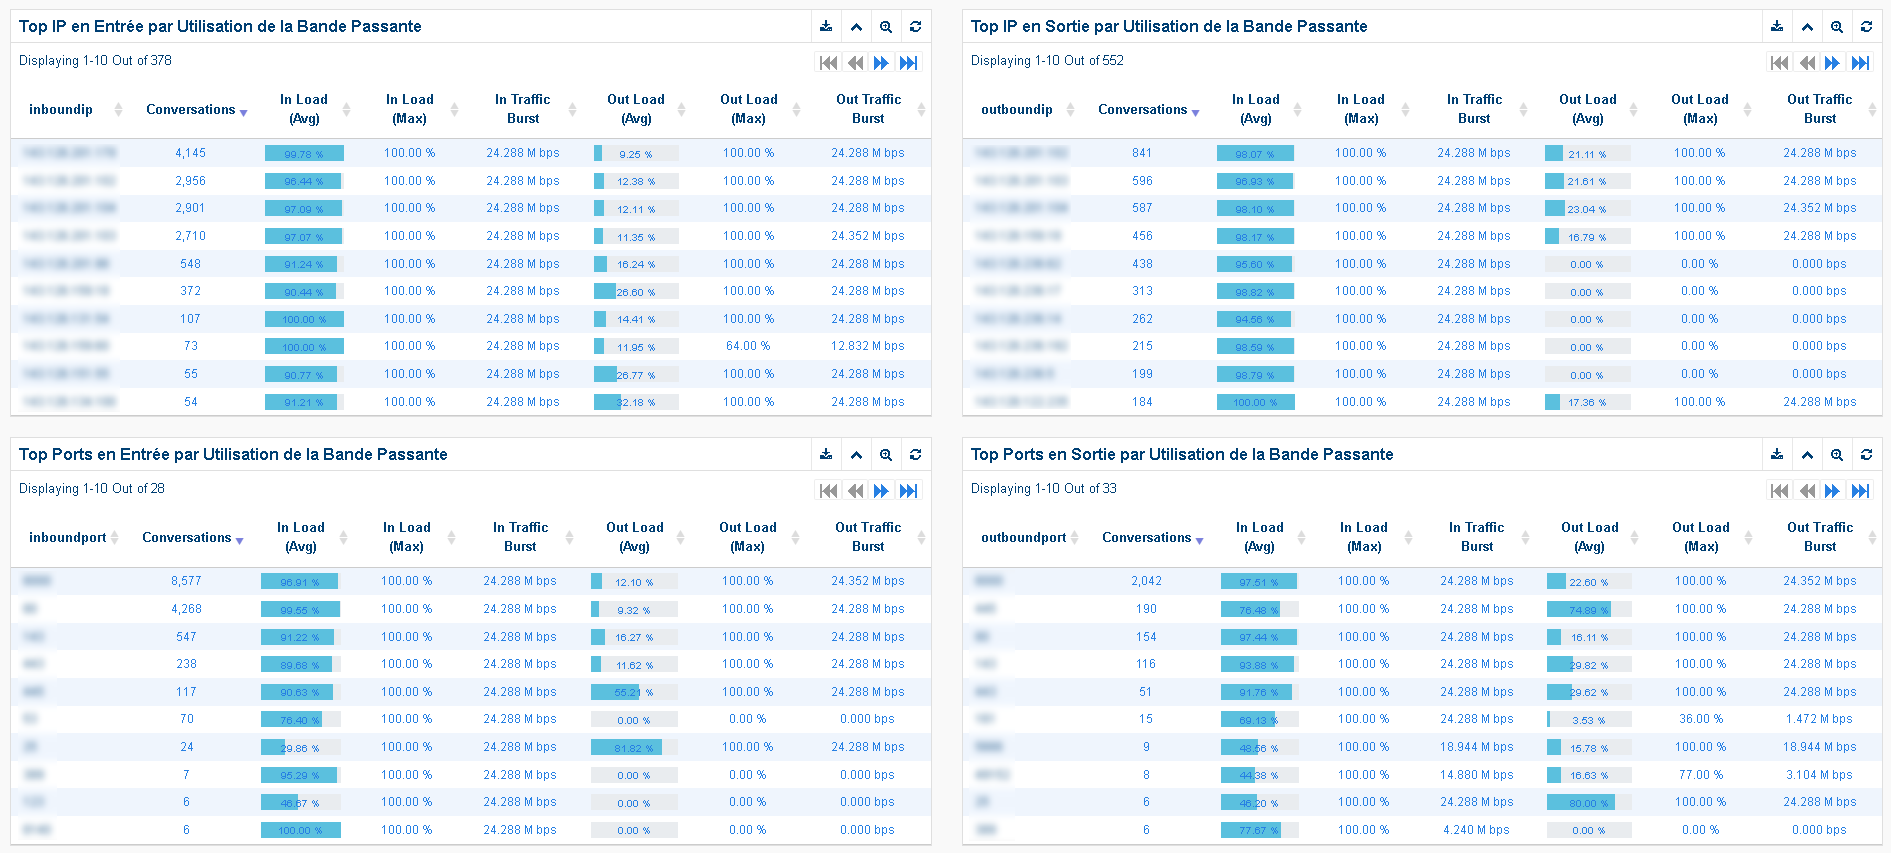
Creating Widgets in ServicePilot is very simple, just define queries in the NoSQL database which contains all the data. A wizard can even help you build the queries you want to make without touching the keyboard! You can see at a glance who is consuming the bandwidth.
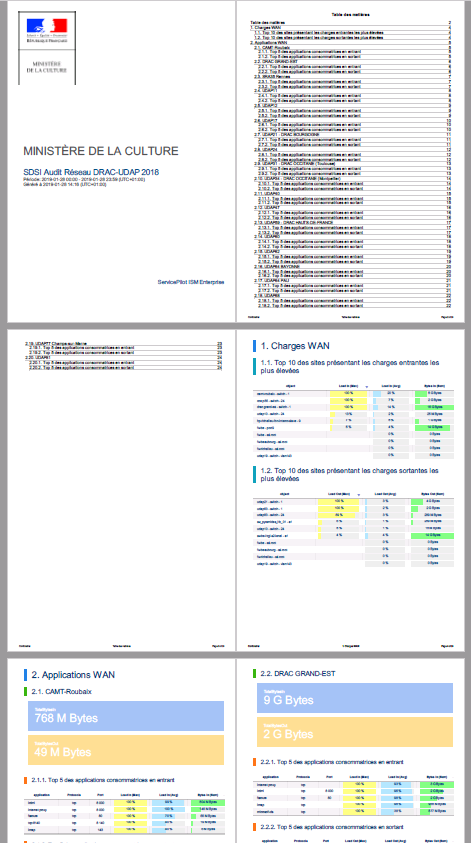
All these widgets specific to the Ministère de la Culture's context were produced during the day and integrated into a PDF report that serves as the basis for the audit. All standard or custom widgets previously built have been retrieved and inserted into the PDF report in a few clicks to produce only one metrology audit and link monitoring report.
Phase 3: Recommendations to improve the efficiency of the network
As the audit company had all the technical information and data in one report, it was very easy for them to add their own comments and indicate the appropriate recommendations for the Ministère de la Culture's environment.
 |
Once the audit was successfully completed and its recommendations applied, the IT teams were able to automate these analysis on the entire network at the national level. The deployment of ServicePilot has been generalized for the analysis of the flows of all its WAN links, and now, a PDF report is automatically distributed allowing the Ministry to have all the data necessary for the analysis of problems.
Successful network monitoring and flow management with ServicePilot
ServicePilot was able to automate the audit and analysis of WAN links at the Ministère de la Culture to facilitate its network management operations in a very short time:
- Analysis of under and oversized links
- Identification of who does what on the bandwidth at what time
- Significant reduction in average incident repair time (MTTR)
- Root Cause Analysis of Problems (RCA) for remediation
- Automation of analysis in dashboards and PDF reports
- Better user experience for employees and users
In addition, it is very easy to add SNMP and Syslog analysis to complete the 360° visibility of network infrastructures and increase correlation and automation possibilities (SNMP + Traps & Syslogs + Netflow).
