AIOps: Reducing noise and identifying the root cause of incidents
What is AIOps?
AIOps or Artificial Intelligence for IT Operations, refers to the use of artificial intelligence and machine learning to automate and improve the management of IT operations.
How does AIOps work?
AIOps solutions rely on various technologies, including machine learning (ML), natural language processing (NLP) and generative artificial intelligence (GenAI). They continuously analyze data from applications, networks, infrastructure, incidents and more.
By consolidating this information, they can identify significant events among large volumes of data, spot unusual behavior and detect performance degradation. They can also correlate multiple alerts to pinpoint the true root cause of an incident, rather than treating each event separately.
Depending on their level of automation and the governance framework in place, some AIOps platforms can suggest corrective measures or even automate certain pre-approved actions. However, direct interventions in production environments should generally be limited to controlled, reversible operations that are subject to oversight in order to reduce the risk of downtime or unintended consequences.
Objectives and benefits of AIOps
The objective of AIOps aligns with that of monitoring or observability: to enhance IT performance and availability through continuous monitoring in order to maintain more stable, reliable and high-performing services.
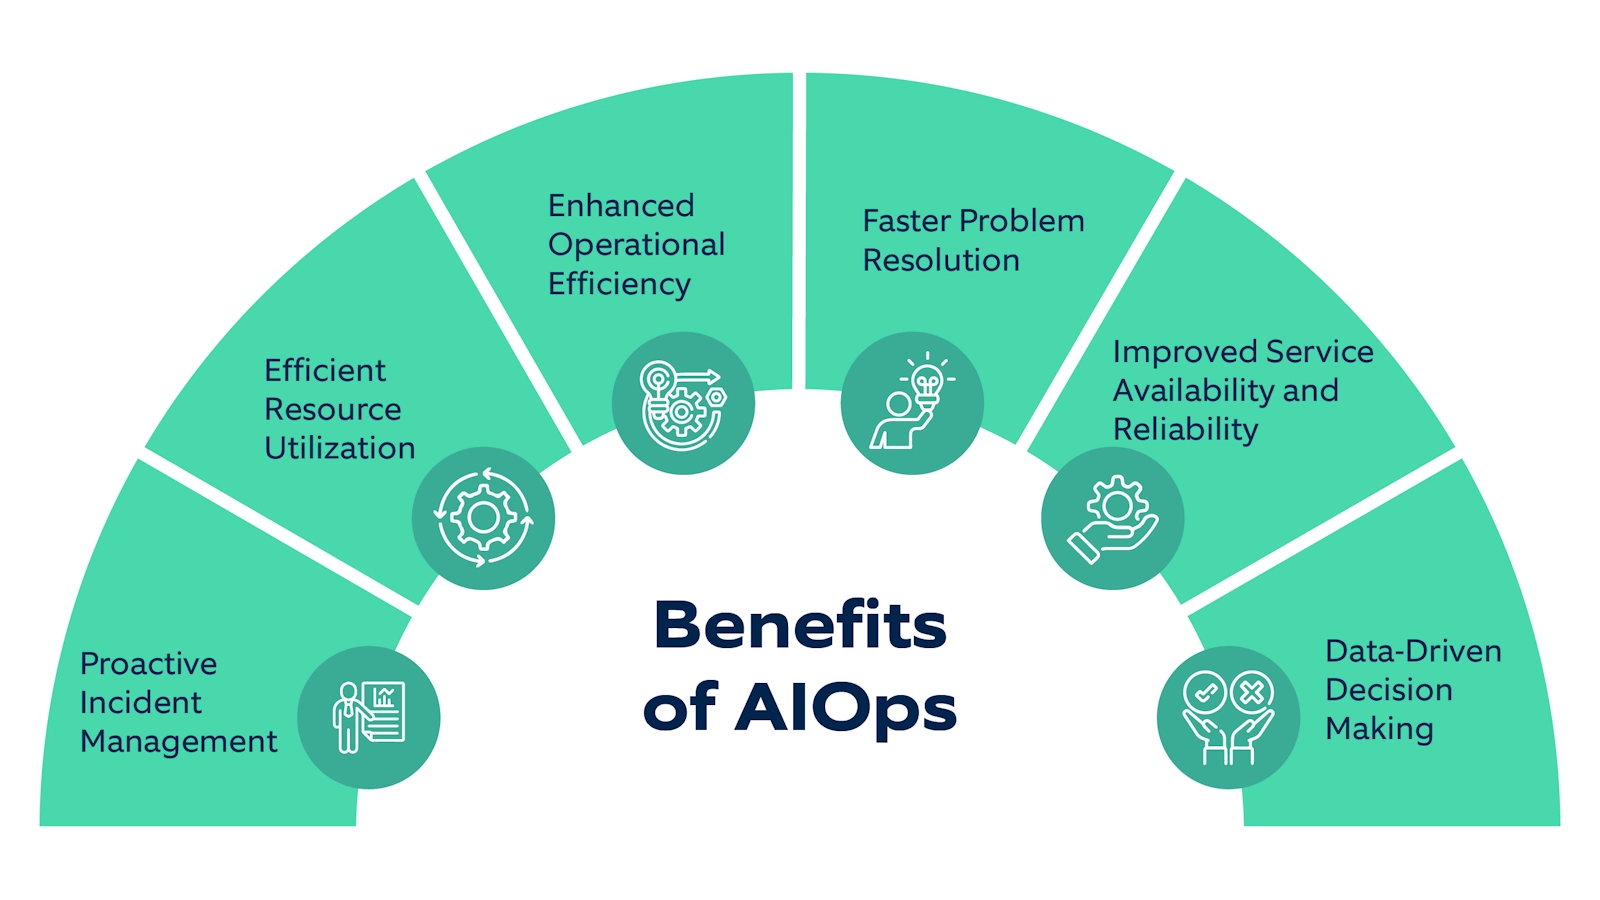
Adopting AIOps offers several benefits to IT teams:
- Detect issues early: Anomalies can be identified before they cause an outage or degradation noticeable to users.
- Improve visibility: Data from different sources is aggregated and put into context to facilitate analysis and decision-making.
- Accelerate incident resolution: Event correlation and root cause identification reduce the time required for diagnosis.
- Automate routine operations: Repetitive tasks are handled automatically, reducing human error and freeing up time for higher-value activities.
Temporal correlation and structural correlation
Two forms of correlation are particularly important for analyzing incidents in complex IT environments: temporal correlation and structural correlation. When combined with an AIOps approach, they help reducing noise, prioritizing signals and identifying a probable cause rather than simply a succession of alerts.
Temporal correlation
This type of correlation identifies events that occurred within the same time window. This dimension is essential for reconstructing the timeline of an incident. For example, an increase in latency observed at 10:05 a.m., followed a few seconds later by a rise in application errors, can be linked to network congestion detected at 10:04 a.m. Taken in isolation, each of these events may trigger a separate alert. When analyzed within the same temporal context, however, they may correspond to a single incident.
Temporal correlation then makes it possible to:
- Identify the first warning sign of a degradation
- Distinguish the initial cause from its consequences
- Identify recurring patterns preceding an incident
- Measure the time lag between a technical event and its business impact
- Reduce the number of alerts handled separately by teams
In particular, this approach avoids treating each symptom as a separate problem. An increase in errors, a decrease in the success rate and a rise in user tickets can all be successive manifestations of the same failure.
Structural/vertical correlation
This approach is based on the relationships between components. Understanding this structure, often referred to as service topology or dependency mapping, provides essential context for the collected events. An application service alert does not have the same meaning if that service depends on an isolated component, an overloaded database or network equipment shared by several critical applications.
Structural correlation helps, in particular, to:
- Identify services and components dependent on a degraded resource
- Measure the potential scope of an incident’s impact
- Avoid treating components that are merely victims as causes
- Group alerts originating from the same underlying infrastructure
- Prioritize incidents based on the services actually affected
In a distributed environment, this capability is particularly important. A single infrastructure issue can propagate across multiple layers: a degraded network interface can affect a hypervisor, multiple virtual machines, Kubernetes nodes and then the applications deployed on them. Without a topological view, teams risk receiving a flood of alerts and wasting time analyzing each component separately.
Analytical AI against alert overload
From an avalanche of alerts to incident identification
Incidents almost never manifest as a single alert. When each signal is processed separately, a single incident can quickly turn into an avalanche of alerts. Operations teams then waste time distinguishing between symptoms, consequences and true warning signs.
Network degradation can lead to:
- An increase in TCP retransmissions
- Longer service response times
- Client-side timeouts
- Application errors
- Pod restarts
- Readiness probe failures
- A decrease in the number of successful transactions
- An escalation of alerts across multiple tools
Without correlation, the team receives a succession of symptoms presented as a series of independent incidents.
This situation is often referred to as "alert fatigue". The problem does not necessarily stem from a lack of data, but rather from the inability to interpret it holistically. The challenge lies in grouping related signals, understanding their temporal and structural relationships and then identifying the component causing the degradation.
This is precisely one of the goals of AIOps. By combining anomaly detection, topological correlation, historical analysis and causal models, ServicePilot can transform dozens of technical alerts into a single logical incident.
Correlating signals to prioritize events
The volume of alerts is not a reliable indicator of an incident’s severity. A single problem can generate hundreds of events.
AIOps must therefore perform several operations:
- Group events that occurred close together in time
- Identify dependencies between components
- Distinguish symptoms from early warning signs
- Weight the criticality of events
- Detect unusual behavior
- Compare the current situation to normal periods
- Reduce duplicates
- Generate a single logical incident
The goal is not to eliminate information, but to prioritize it.
Temporal correlation indicates that multiple signals have changed together. Structural correlation indicates that they involve related or dependent components. It is the combination of these two approaches that allows us to distinguish a simple coincidence from a plausible causal relationship.
For example, a simultaneous increase in latency across multiple applications constitutes a temporal clue. If these applications all depend on the same database service, the same node or the same network path, structural correlation reinforces the hypothesis of a common cause. Conversely, two alerts that appeared at the same time but concern components with no known relationship must be analyzed independently.
This combination enables a shift from a reactive approach (handling alerts as they arise) to a proactive approach to service analysis. Teams can then focus on the most explanatory event, quickly assess its impact and reduce the time between incident detection, diagnosis and resolution.
Predictive and analytical AI in the face of multilayer failures
An alert is not always a diagnosis. It indicates that behavior deviates from what is expected, but it does not necessarily pinpoint the source of the problem. Even a technically accurate diagnosis can be difficult to act on if it is presented as hundreds of metrics and events.
In a distributed system, the first component to signal an anomaly is often the one experiencing the most visible impact. A pod may therefore exhibit high latency without being responsible for its own degradation. The cause may lie in a node, a hypervisor, a network interface or shared physical infrastructure.
The root cause does not necessarily correspond to the first component that triggers an alert. An application pod may be the first visible element because it exhibits high latency. However, this latency may be caused by a failure in network equipment located several levels deeper in the stack.
Example: Slowdown in a Kubernetes container
Let’s imagine a payment application deployed in a Kubernetes cluster. At 2:00 p.m., users begin to notice slower transactions. The application metrics indicate:
- An increase in response time
- An increase in timeouts
- A few HTTP 504 errors
At the Kubernetes level:
- Some pods remain in the Running state
- No widespread crashes are observed
- CPU and memory limits are not exceeded
- Replicas remain available
An analysis limited to Kubernetes might conclude that the cluster is functioning normally. However, full-stack observability gradually reveals:
- The affected pods are concentrated in the worker-03 pod
- Worker-03 is hosted on a specific virtual machine
- This virtual machine shares a network interface with several workloads
- TCP retransmissions are increasing on the affected connections
- The network queue is filling up
- The underlying hardware or physical interface is reaching capacity
- Network latency is causing application calls to slow down
The pod is therefore not necessarily the cause. It is the point where the consequence becomes visible.
Simplified causality model: Physical interface saturation → Increase in the network queue → TCP retransmissions on the affected connections → Latency in inter-service calls → Slowdown of the Kubernetes pod → HTTP errors and a drop in successful transactions.
Example of aggregation
Instead of displaying separately:
Alert 1: Increased TCP latency on port 443
Alert 2: TCP retransmissions on worker-03
Alert 3: Latency in the payment-api
Alert 4: HTTP 504 errors
Alert 5: Readiness probe failure
Alert 6: Decrease in the rate of successful transactions
ServicePilot may present a related issue:
Incident: Degradation of the payment-api service in production
Impact:
- 420% increase in transaction latency
- TCP retransmissions concentrated on worker-03
- Multiple pods affected
- HTTP 504 errors observed on the ingress
Root cause hypothesis:
- Network congestion on the physical infrastructure hosting worker-03.
This presentation radically changes the engineer’s workflow. He no longer needs to manually sift through multiple alerts from various software systems to reconstruct the scenario. ServicePilot’s causal analysis makes it possible to trace this chain in a matter of seconds by cross-referencing events and dependencies rather than analyzing each alert in isolation.
The added value of ServicePilot AIOps
The value of a monitoring platform therefore lies not only in its ability to collect metrics or trigger alerts. It lies in its ability to transform this data into actionable context.
ServicePilot brings together performance metrics, events and dependencies between components to provide a more coherent view of the situation. Instead of presenting a list of unrelated alerts, the goal is to highlight an incident scenario: which signals appeared first, which components are involved, which services are actually impacted and which relationships might explain the observed degradation.
This approach offers several operational benefits:
- Less noise by grouping related alerts
- Faster diagnosis thanks to a contextualized timeline and topology
- Better prioritization based on the impact on services
- Reduced manual investigations across multiple monitoring tools
- Easier communication between infrastructure, network, systems and application teams
- Continuous improvement through analysis of past incidents and recurring patterns
AIOps strengthens this correlation by applying automated analysis techniques to the large volumes of data generated by modern environments. Algorithms can correlate events from different sources, detect unusual behavior, recognize previously observed sequences and estimate the probability that a set of signals corresponds to a single incident.
The goal is not to replace the teams’ expertise, but to make it more effective. Automation handles the reconciliation and filtering, while the teams retain the final decision-making authority and control over corrective actions.
