API observability: Ensuring optimal performance

Why API observability has become essential
APIs have become the backbone of modern distributed architectures. They connect services, applications, microservices and external partners. But as they grow in importance, their performance and reliability become increasingly critical. A slow, unavailable or unpredictable API can directly impact a company’s user experience, revenue and reputation.
Here are the main challenges faced by IT teams responsible for API-based applications:
Increasing architectural complexity
With the adoption of microservices, hybrid environments and the cloud, an API request can pass through dozens of components. Without observability, it is impossible to know where a slowdown or failure is occurring.
Ever-increasing performance requirements
Users expect instant responses. An API with latency exceeding 300 ms can already degrade the user experience.
External dependencies
Many APIs rely on third-party services (payment, geolocation, authentication). An incident at a provider can impact the entire chain.
Security and Compliance
Observability also helps detect abnormal behavior: Traffic spikes, injection attempts and unauthorized calls.
This is where API observability comes into play: An approach that provides deep insight into API behavior, helps anticipate issues and ensures optimal performance.
🔍 The pillars of API observability
Observability relies on three complementary types of signals:
1. Metrics
Metrics provide a quantitative, real-time view of an API’s behavior. They enable you to:
- Detect degradation before it escalates into incidents.
- Understand usage trends.
- Identify limits (quotas, saturation).
- Anticipate capacity or dependency issues.
- Generate reliable, noise-free alerts.
Here are examples of essential metrics for APIs:
- Availability (Percentage of successful 2xx requests, 4xx/5xx error rate, timeouts...)
- Performance (Average latency, p95/p99 latency...)
- Volume (Number of calls per minute, distribution by endpoint, load spikes...)
- Quotas and limits (429 throttling errors, exceedance rate, etc.)
- Resilience (gradual degradation, number of retries, etc.)
These metrics help you understand how the system is performing.
2. Distributed traces
Distributed traces allow you to track an API call through all the services that process it, in order to precisely understand its path, latencies, dependencies and points of failure.
They let you visualize the complete path of a call:
- From your frontend or backend.
- Through your microservices.
- And then back to the end-user request.
They show the exact timeline, latencies per segment, errors and the dependencies involved, answering questions that cannot be resolved with logs or metrics alone:
Where is the latency occurring?
→ In the service? In the network? At the external provider?
Which service is responsible for the error?
→ The validation service? A proxy? The database request?
Why does an API call sometimes fail but not always?
→ Traces = correlation between context, load, retries and timeouts.
3. Logs
Logs detail events: requests, errors, authentications and timeouts. They help you determine what happened:
- Understand the exact context of a call (payload, headers, parameters).
- Identify business errors (e.g. "User not found", "Quota exceeded").
- Detect abnormal behavior (e.g. a partner changing its response format).
- Audit interactions for compliance or security purposes.
The developer chooses what to log for an API (request information, response information, technical metadata, business events) and pays attention to security/confidentiality, the consistency of reported data and volume/noise to avoid superfluous logs that take longer to decipher than to resolve an incident.
🛠️ How to implement effective API observability
1. Instrument APIs
Instrumentation is the foundation of observability. Without reliable data, no analysis is possible.
Adopt OpenTelemetry to standardize the collection of logs, metrics and traces. This ensures consistency across services, facilitates correlation and avoids proprietary formats.
Propagate correlation IDs (trace ID, span ID) across all internal and external calls. This is essential for reconstructing the complete path of a request.
Instrument external dependencies: DNS, TLS, proxies, third-party SDKs. Many API issues stem from external layers that are often overlooked.
Enable automatic instrumentation when available (HTTP client, frameworks, cloud SDKs). This reduces effort and minimizes blind spots.
An uninstrumented API is a black box. An instrumented API becomes a stream of analyzable events.
2. Monitor key metrics
KPIs help detect anomalies before they impact users.
P95 / P99 Latency
Averages mask problems. Percentiles reveal actual performance degradation.
Error Rates (4xx / 5xx)
4xx errors often indicate a usage or validation issue.
5xx errors indicate a provider failure.
Response time of external dependencies
An API may be available but slow, which degrades the SLAs.
Request throughput (RPS or RPM)
Helps detect load spikes, infinite loops or risks of quota exceedance.
Internal processing time vs. network time
Essential for determining whether slowness stems from the code or an external provider.
These metrics must be logged, aggregated and correlated to detect trends, not just incidents.
3. Define SLOs / SLAs
SLOs enable you to transform observability into measurable commitments.
Availability: 99.9%
A good level for critical APIs, but some integrations require 99.99%.
Latency < 200 ms
Adjust according to the type of API (payment, geolocation, CRM, etc.).
Error Rate < 0.1%
Above this threshold, the user experience is impacted or workflows become unstable.
Best Practices:
- Define SLOs per endpoint, not globally.
- Monitor error trends to anticipate performance degradation.
- Align internal SLOs with external vendors’ SLAs.
Without SLOs, observability remains descriptive. With SLOs, it becomes actionable.
4. Implement smart alerts
Alerts should be relevant, non-intrusive and diagnostic-oriented.
Dynamic thresholds based on historical behavior.
An error rate of 2% may be normal for one endpoint but catastrophic for another.
Trend-based alerts
Example: latency that gradually increases over 15 minutes.
Automatic correlation
An alert should indicate whether the problem stems from:
- An internal service.
- A network.
- An external API.
- A change in load.
Multi-signal alerts
Combine metrics, logs and traces to reduce false positives.
A good alert does not just say "something’s wrong"; it says "here is where to look."
5. Visualize the data
Visualization transforms raw data into immediate insight.
Heatmaps
Ideal for identifying latency spikes or areas of congestion.
Latency charts (average, p95, p99)
Let you see gradual performance degradation.
Top most-used endpoints
Useful for prioritizing optimization or identifying quota risks.
Mapping critical dependencies
Essential for understanding the impact of an external API on your internal services.
View by service / region / environment
To isolate localized issues.
⚙️ API observability with ServicePilot
ServicePilot offers a comprehensive platform for monitoring, analyzing and understanding API behavior in real time. The goal: to transform every API call into actionable insights for DevOps, SRE and platform teams.
Automatic collection of performance metrics
ServicePilot automatically collects key API metrics: average latency, P95 and P99, error rates by category (4xx, 5xx, timeouts, throttling), throughput (RPS) and load spikes, as well as network time versus internal processing time...
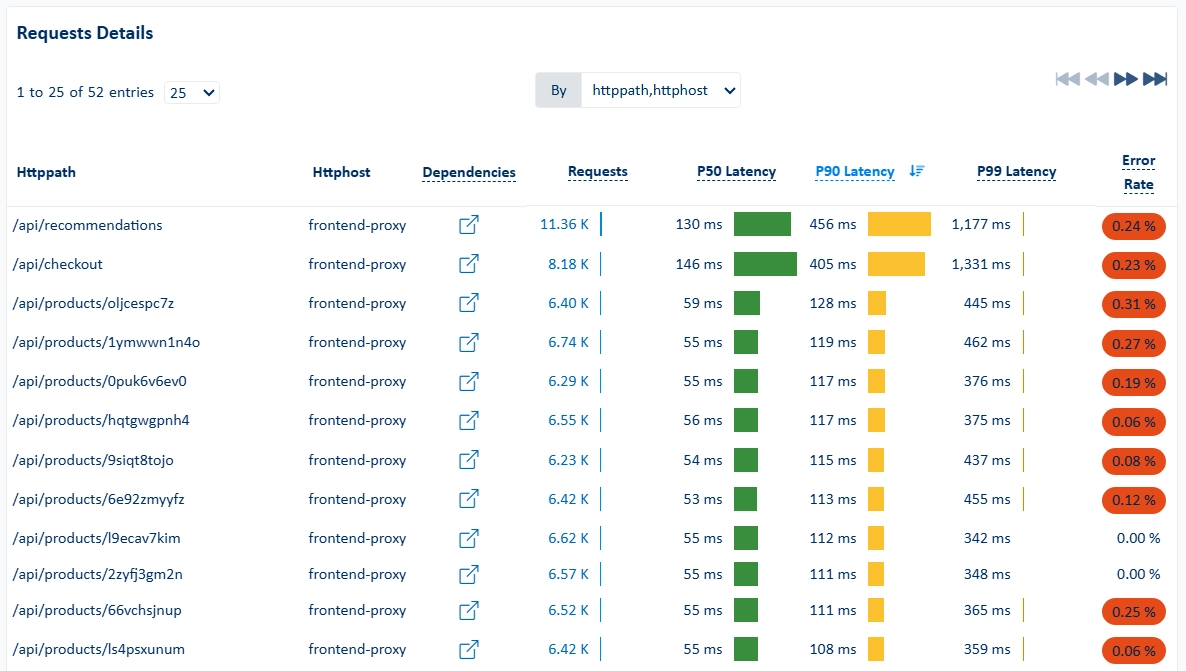
This standardized collection provides a clear view of API health, without the need for complex configuration.
Analysis of errors and status codes
Not all API errors are created equal. ServicePilot distinguishes between: validation errors (4xx), server errors (5xx), too many requests (429), timeouts and network issues and business errors returned by providers.
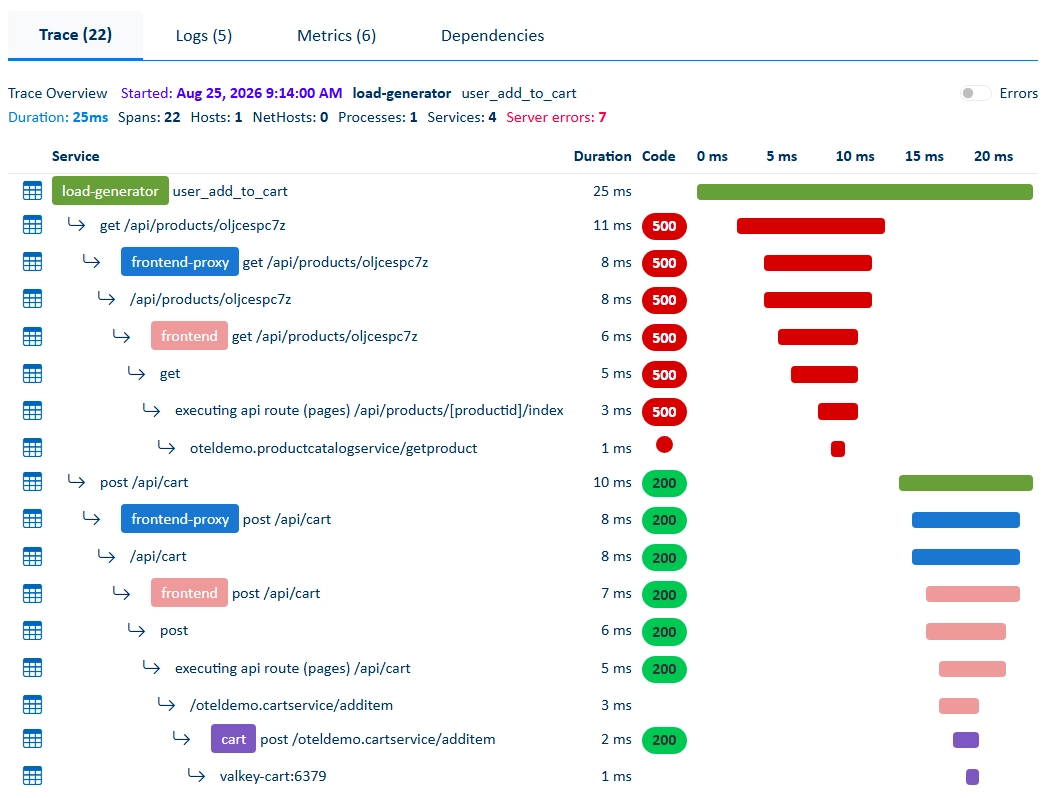
Thanks to this level of granularity, teams can quickly identify the root cause of an incident, even when the external API provides very little information.
Mapping dependencies between services
External APIs are rarely called directly: they pass through microservices, proxies, caches and workers. ServicePilot automatically reconstructs this topology: which services call which APIs, which endpoints are critical, which dependencies affect performance, which workflows are sensitive to degradation...
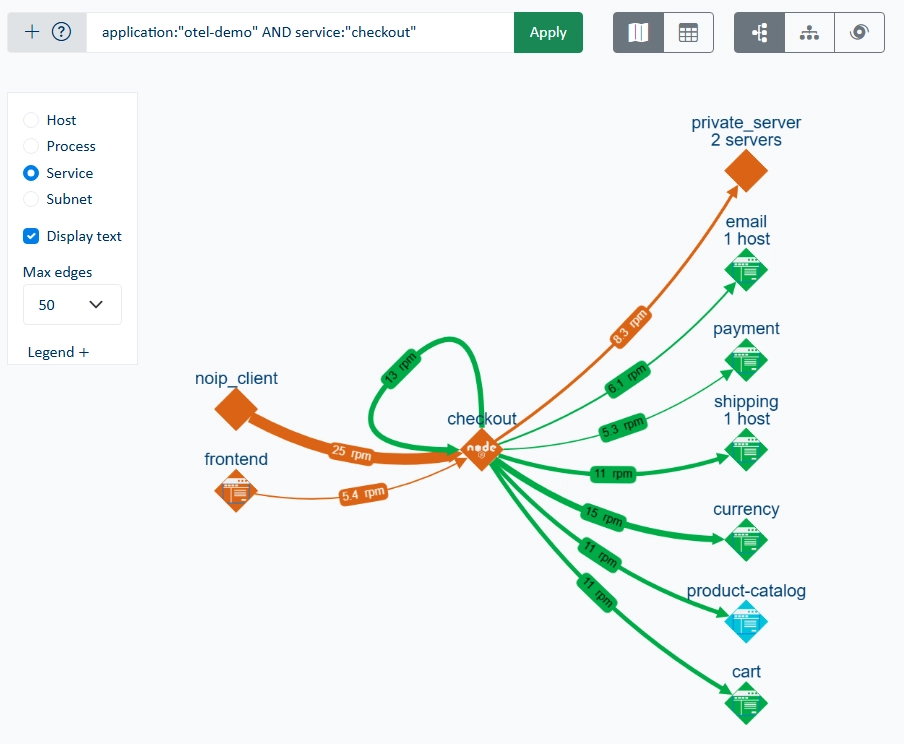
This mapping is essential for understanding the impact of an external API on the entire system.
Proactive anomaly detection
ServicePilot uses advanced analytics to detect: gradual increases in latency, abnormal error rates, unusual behavior on an endpoint, unexpected load fluctuations, retry or timeout patterns...
Alerts are intelligent, based on trends and not only on static thresholds, which drastically reduces noise.
Out-of-the-box dashboards for DevOps and SRE teams
Teams have immediate access to operational views: latency by endpoint, top-used APIs, performance heatmaps, SLO/SLA tracking, correlation of logs, metrics and traces...
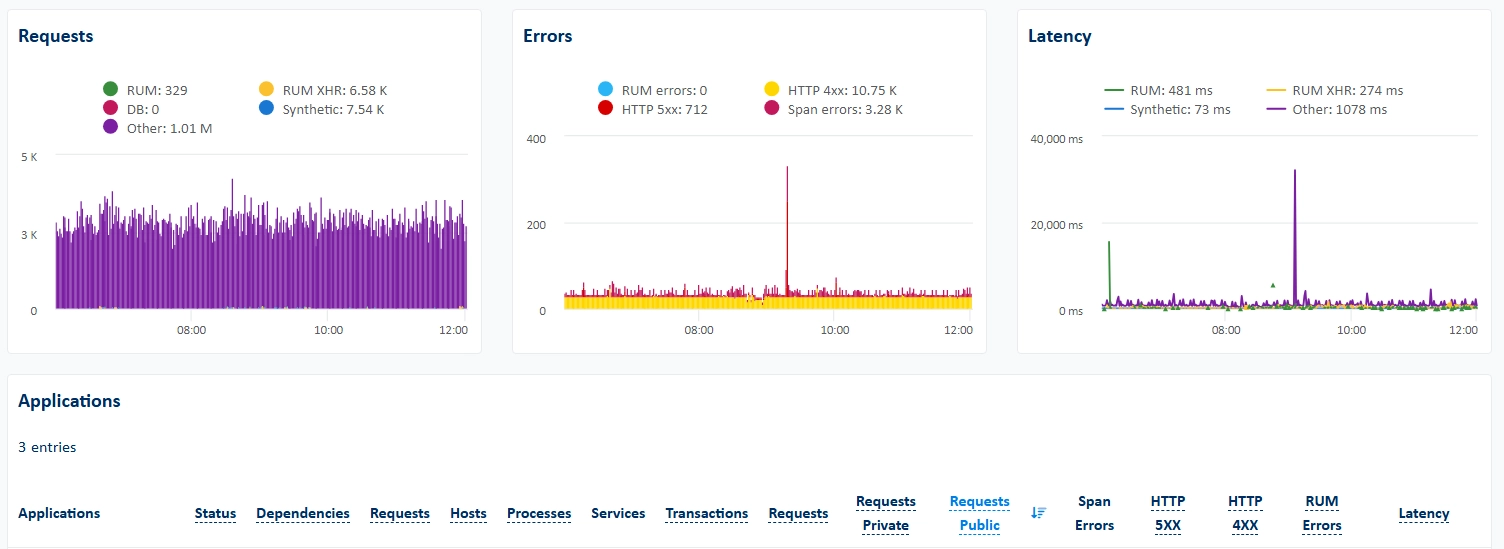
These dashboards enable teams to diagnose an incident in seconds and identify areas of vulnerability.
🔮 ServicePilot: A strategic tool for monitoring APIs
In a world where APIs are at the heart of digital interactions, observability is no longer a luxury - it is a necessity. It not only helps detect problems but, more importantly, enables you to understand behavior, optimize performance and ensure maximum reliability.
Thanks to a unified approach, ServicePilot helps you quickly understand the root cause of a problem, optimize performance and ensure a seamless user experience.
Concrete benefits for teams:
- Help determine root cause.
- Reduced mean time to resolution (MTTR).
- Improved availability of services.
- Optimized performance and latency.
- Improved collaboration between Dev, Ops and SRE.
- Anticipation of incidents before they impact users.
With ServicePilot, companies have a powerful solution to achieve these goals and ensure that their APIs are high-performing, resilient and ready for future challenges.
