Automatic flow matrix: 5 key monitoring features
Observability: Understanding the network flow matrix
A flow matrix is a visual and structured representation of all communications between servers, applications, services and processes. It allows seeing at a glance who is talking to whom, on which ports, via which protocols and with what intensity. Dynamic tables and maps are becoming a key tool for understanding application dependencies, identifying critical paths and analyzing the actual behavior of systems in production.
There are many use cases :
- In network segmentation, the flow matrix can be used to validate filtering rules, detect unexpected communications and prepare Zero Trust projects.
- In security, it highlights abnormal flows, suspicious lateral communications or deviant behavior.
- For application teams, it reveals the actual dependencies between microservices, databases and third-party components.
- Finally, during troubleshooting, it speeds up the identification of the source of a slowdown or failure by immediately showing where a flow is blocked or degraded.
Traditional flow matrices, often based on NetFlow, sFlow exports or network probes, have significant limitations. They depend on the visibility provided by the infrastructure, do not always capture internal server communications and lack application context. In virtualized, containerized or multi-cloud environments, these approaches struggle to keep up with the reality of exchanges, as a single flow can pass through several logical layers before becoming visible.
This is why a flow matrix built directly from servers and processes offers significantly greater accuracy. By observing traffic at the source — at the kernel, process, and application levels — it allows each communication to be linked to its actual origin, identifies the service involved and explains the purpose of the flow. This approach eliminates gray areas, ensures complete visibility even in complex architectures and provides a reliable basis for monitoring, security and performance optimization.
ServicePilot's NetTrace technology is based precisely on this approach: observing traffic directly at the server and process level to produce a complete, contextualized and immediately actionable flow matrix. This granular visibility allows you to understand real dependencies, identify anomalies and achieve truly unified monitoring.
5 key features for traffic analysis and flow matrix
Here are five essential features that any observability solution should offer to provide a reliable, detailed and actionable view of traffic from your systems.
1. Multi-platform, network-independent traffic collection
A truly operational observability solution must collect traffic directly at the system interfaces, without relying on intermediate equipment. NetTrace enables this approach by integrating natively with Windows and Linux, whether they are running on bare-metal servers, virtual machines, hypervised infrastructures, containers or orchestrators such as Kubernetes.
This local collection offers several technical advantages. First, it captures of all network flows — including those that never leave the node, such as encapsulated interprocess communications or internal cluster flows. It also eliminates the loss of information associated with network proxys, overlays, SD-WAN tunnels or NAT mechanisms that make flows difficult to interpret from the outside. Finally, it ensures that analysis remains consistent even when the network is segmented, encrypted, dynamically routed or supports advanced load balancing mechanisms.
This independence from the network infrastructure is essential for obtaining a reliable view in modern environments, even in the most segmented or distributed architectures.
In short: unified collection that is easy to deploy and immediately actionable.
2. Automatic flow matrix for unified monitoring
Collecting data is one thing, but making it readable, accessible and usable is another.
Modern infrastructures are characterized by increasing heterogeneity: multiple servers, diverse network zones, cloud/on-premise hybridization, distributed resilience mechanisms. In this context, having a centralized view of traffic becomes essential for correlating behavior across multiple perimeters.
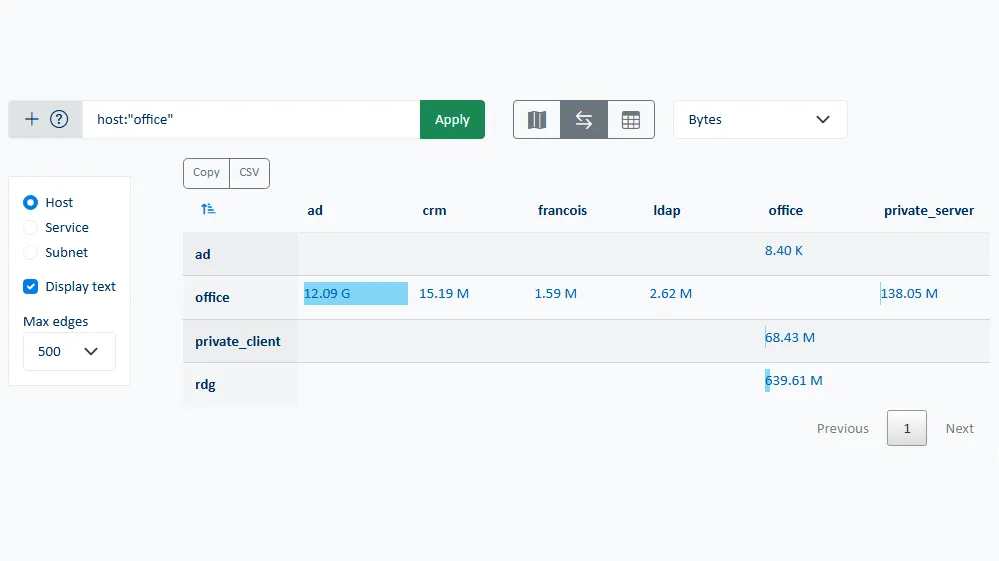
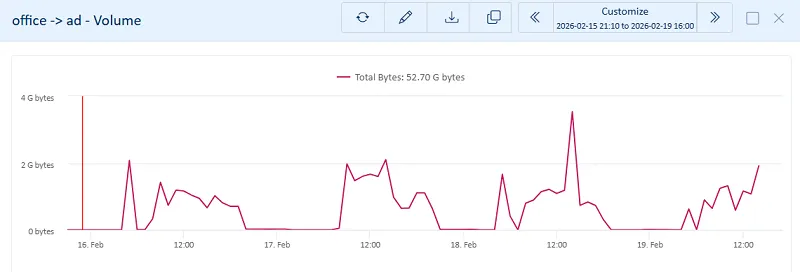
NetTrace consolidates information collected from all servers in real time and displays it via a unified interface. This aggregated view allows observing overall network activity but also to navigate smoothly from the macro level (functional topology, dominant flows, volumes) to the micro level (individual processes, specific sockets, service queries). Dynamic visualizations allow tracking load variations in real time, identifying the most heavily used servers or following the evolution of a particular flow throughout its lifetime.
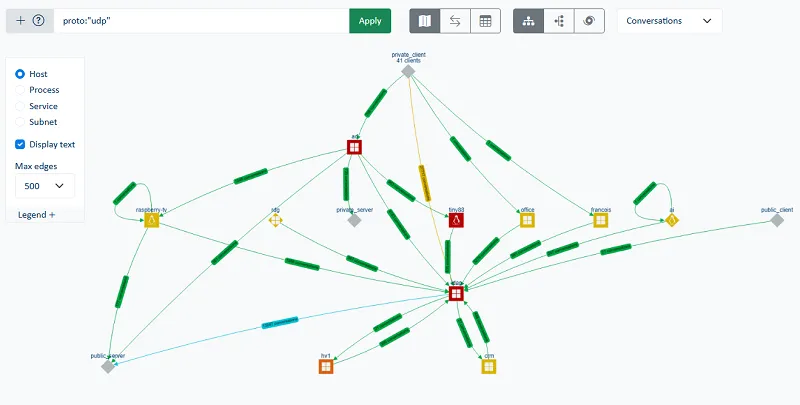
This centralized monitoring greatly simplifies troubleshooting by making dependencies between services visible without having to manually maintain flow matrices or static maps. It allows associating a degradation observed on an application with a particular network phenomenon, identifying peaks in TCP drops or retransmissions and detecting an increase in latency linked to a change in behavior of a third-party service.
IT teams can thus identify in a matter of seconds:
- The most heavily used servers
- The dominant incoming and outgoing flows
- Dependencies between applications
- Interactions between internal resources and external services
With a consolidated view of traffic, correlating network events and application behavior becomes quick and easy, a major asset for troubleshooting and continuous optimization.
3. Granular analysis by server, application and process
The real difficulty in network analysis lies not in collection but in interpretation. A TCP flow on a given port means nothing until you know which process sent it, which application it serves, when it was initiated and for how long. Traditional network tools often stop short of this level of detail, leaving it up to System/DevOps teams to make manual correlations.
ServicePilot NetTrace takes a completely different approach. By directly observing the system's TCP/IP stack, it links each socket to its parent process, identifying the executable, the binary path, the associated user and even the application instance in a multi-service environment. This ability to contextualize flows at the process level is crucial for distinguishing business traffic from system traffic. For example, it allows you to differentiate between traffic generated by a PostgreSQL database, a monitoring module, or a third-party application component running on the same server.
This makes it possible to answer key questions when analyzing server behavior, such as:
- Which application consumes the most bandwidth?
- Which processes generate unusual or unauthorized traffic?
- Which ports are actually used and by which applications?
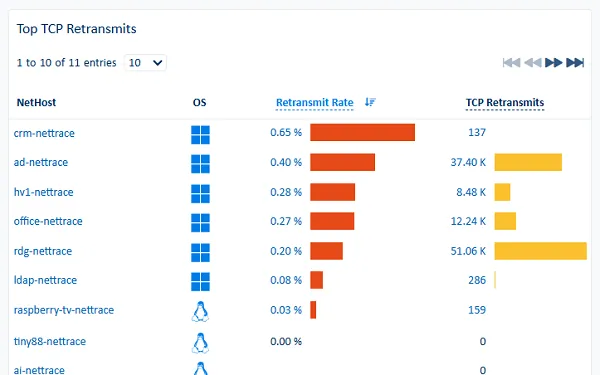
- What are the retransmission, rejection and reset rates for a given service?
This granularity transforms a global view (“server A generated 10 GB of traffic over 25 minutes”) into actionable information (“process B on server A exchanged 10 GB with database D on server C from port E over 25 minutes”).
NetTrace lets you capture live packet data (PCAP) directly from the browser. With one click, you can launch a trace on any server and download the packets' traces for detailed analysis.
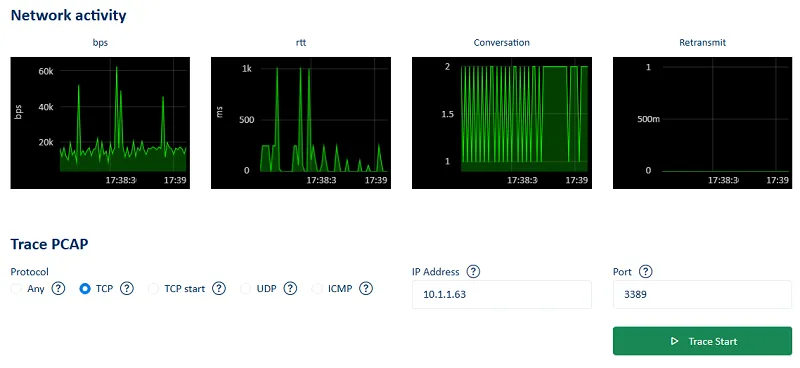
Going into this level of detail radically changes our understanding of network behavior. We can observe in real time which applications are saturating bandwidth, which processes are establishing unexpected connections and which application steps are consuming the most network resources in a given workflow. In shared environments with sometimes ephemeral instances or services, this capability provides the transparency needed to accurately attribute network consumption to a given service.
The result: faster diagnosis, increased business understanding and naturally enhanced security.
4. Automatic detection of anomalies and suspicious behavior
One of the major challenges of traffic analysis is detecting abnormal behavior, whether it is a technical incident or potentially malicious activity. On an application server, a sudden increase in the number of outgoing connections, a massive and unusual transfer or excessive demand on an external service can reveal a failure, misconfiguration or security policy violation.
NetTrace incorporates detection logic based on observing traffic variations over time, highlighting deviations from the usual behavior of a process and identifying connections that fall outside expected patterns. This mechanism makes it possible to quickly flag atypical flows, communications to addresses that have never been contacted before or volumes that far exceed normal operating windows.
This capability is essential for strengthening security posture. By observing flows from the server's perspective, NetTrace detects what network equipment does not always see: legitimate processes behaving abnormally, hijacked services, discreet downloads, unusual internal transfers or weak signals of exfiltration. This server-centric approach provides a solid foundation for cyber observability, which is essential for maintaining a high level of control in exponentially growing distributed environments.
5. Data historization, trends and forecasts
Modern monitoring is not limited to responding to incidents, it must also allow you to anticipate. Long-term traffic analysis is a rich source of data for studying load trends, understanding seasonal variations and forecasting future needs.
NetTrace keeps a detailed history of traffic flows by server, application and process. This information is not only used to analyze past incidents: it also helps identify traffic cycles, measure service growth and detect the gradual emergence of new traffic flows. Observing these trends facilitates capacity planning, particularly when it comes to forecasting load increases, redistributing certain services and assessing the impact of a migration or configuration change.
This analytical dimension transforms network traffic into a true strategic indicator. Rather than observing occasional saturation or load variations, teams have a continuous, contextualized view of network behavior over time. This enables them to make informed decisions, optimize resources and adapt the architecture before limitations become bottlenecks.
Dynamic flow matrix: a pillar of modern observability
Flow matrix and traffic analysis are no longer tools reserved for network experts. Today, they are a fundamental part of any observability strategy, combining performance, security, and application understanding.
The ServicePilot NetTrace technology provides a level of precision and context that is essential in today's distributed systems. By combining multi-platform collection, consolidated visualization, application granularity, anomaly detection, and historical analysis, it is an essential building block for monitoring.
Thanks to this approach, IT teams finally have a clear view of what is really happening within servers and can accurately correlate network phenomena with application behavior. This detailed understanding is crucial for enhancing performance, improving resilience and ensuring long-term system security.
System traffic observability becomes a strategic tool and your decisions become more accurate.
