Observability of dynamic environments & vertical correlation
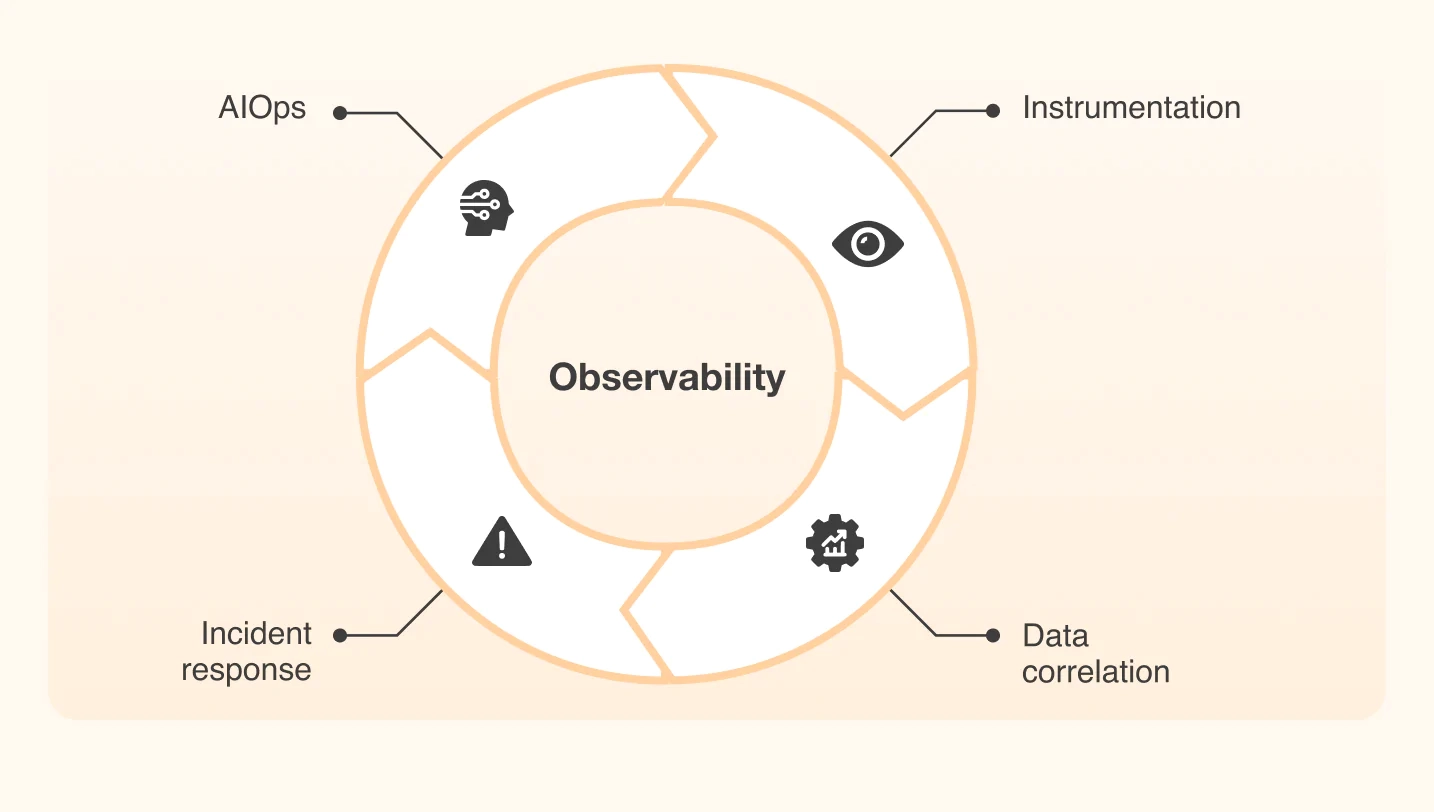
Mastering the complexity of K8s through full-stack observability
Modern infrastructures no longer resemble a set of clearly identified servers connected by a few network devices and running a limited number of applications.
They have become distributed. A single business transaction can go through an application, multiple containers, a Kubernetes cluster, a virtual machine, a hypervisor, a shared physical server and a set of network devices before reaching its destination. At each stage, metrics, logs, traces and events are generated.
These architectures offer great flexibility, but they significantly complicate troubleshooting. When an application slows down, the root cause of the problem could lie in the code, the container, the Kubernetes node, the storage or even a degraded TCP connection. Operations teams must then consult multiple tools, compare heterogeneous data and attempt to manually reconstruct the dependencies between components.
Full-stack observability addresses this challenge by providing a unified view of the entire system. Through automated data collection, data enrichment and dynamic correlation, ServicePilot connects application, Kubernetes, network and infrastructure signals.
The goal is no longer simply to know that a component is experiencing an anomaly. It is about understanding exactly how that anomaly affects the business service and what dependencies might explain its occurrence.
In this article, we will explore how lightweight data collection based on open standards, notably OpenTelemetry, can be integrated into Kubernetes environments and how ServicePilot’s vertical correlation connects the application to the physical infrastructure running it.
☁️ Observability of dynamic environments and full correlation
The goal of full-stack observability is to create a coherent representation of the system, from the application down to the physical network.
It is not enough to have a separate Kubernetes dashboard, network software and APM tool. The challenge lies in automatically linking the observed objects: A request, a service, a pod, a node, a virtual machine, a hypervisor and the network path taken.
Why Kubernetes makes observability more difficult
Kubernetes provides considerable elasticity, but this flexibility automatically increases operational complexity.
Workloads are dynamically scheduled. Pods are created, moved and then deleted. IP addresses can change. A logical service can distribute traffic across multiple replicas, which are themselves spread across different physical or virtual nodes.
A user request might follow a path similar to this: User → Load balancer → Ingress controller → Kubernetes service → Application pod → Database → Shared storage.
Added to this application path are the execution layers: Application → Container → Pod → Kubernetes node → Virtual machine → Hypervisor → Physical server → Network and storage.
A slowdown observed at the application level may therefore originate several layers below. The operations team must therefore be able to answer several questions:
- Does the problem stem from the application or the infrastructure?
- Is the pod constrained by CPU, memory or the network?
- Is the Kubernetes node itself degraded?
- Is there congestion affecting storage or the hypervisor?
- Are TCP connections experiencing retransmissions?
- Do multiple alerts correspond to a single incident?
- What is the root cause and what action should be taken?
Monitoring limited to a single layer risks confusing symptoms with the root cause.
Native, lightweight data collection with OpenTelemetry
OpenTelemetry provides a standardized framework for collecting metrics, logs and traces from applications and infrastructure. It also helps reduce dependence on proprietary formats and makes it easier to add common metadata to various observability signals.
In a Kubernetes environment, this approach is particularly well-suited to the ephemeral nature of workloads.
Instrumentation must be able to automatically track the creation of a pod, its attachment to a node, its association with a deployment, the Kubernetes service that exposes it, outgoing calls to other components, version changes, restarts and any associated errors or slowdowns.
One of the benefits of data collection integrated into the Kubernetes ecosystem is that it minimizes manual operations. The OpenTelemetry Operator, for example, can automatically inject instrumentation into pods at deployment time, without directly modifying the application code or disrupting the DevOps workflow.
💡 Vertical correlation: From telemetry to topology
Data collection is only the first step. The real value emerges when signals are linked to a topology. The topology then becomes a dynamic model of dependencies. It evolves based on deployments, routing changes and the cluster’s elasticity. This is the principle of vertical correlation, which involves connecting multiple technical layers that are typically monitored separately.
1. Infrastructure
The first layer concerns execution resources:
- Physical servers
- Processors
- Memory
- Network interfaces
- Disks and storage arrays
- Virtual machines
- Hypervisors
- Resource pools
- Temperatures and hardware status
- I/O queues
An application latency alert takes on a whole new meaning when it can be linked to CPU contention on the hypervisor or to a network interface on the physical server reaching capacity. In a multi-site IT environment, a user at a particular site may experience latency due to a firewall or router issue that has nothing to do with the application infrastructure itself.
2. Kubernetes
The Kubernetes layer provides the orchestration context:
- Pod status
- Restarts
- Scheduling
- Replica availability
- Resource limits and requests
- Node status
- Cluster events
- CPU, memory or disk usage
- Services and endpoints
- Ingress
- Persistent volumes
- Network rules
The goal is not simply to monitor Kubernetes as a product. It is to understand the cluster’s impact on the business service.
3. Layer 4: TCP and UDP
Applications can continue to respond even while experiencing significant connection degradation.
Layer 4 allows you to monitor, in particular:
- Connection establishment latency
- TCP retransmissions
- Packet loss
- Resets
- Connection refusals
- The number of active connections
- Overloaded ports
- Imbalances between clients and servers
- Throughput variations
- Round-trip times
A TCP retransmission is not necessarily the direct cause of an application incident, but it is an important indicator. When it increases simultaneously with request durations and network interface congestion, it can provide a particularly valuable causal link.
4. Applications
The application layer provides the metrics closest to the user experience:
- Request duration
- Error rate
- Cross-service calls
- Distributed traces
- Exceptions
- Internal queues
- Database response times
- Calls to external APIs
- Throughput and transaction volume
A distributed trace may show that a request spent 30 milliseconds in the business logic but 800 milliseconds waiting for a network connection. Without correlation with the TCP layer and the infrastructure, this discrepancy would be difficult to interpret.
🚀 ServicePilot: Unified observability to accelerate troubleshooting
OpenTelemetry facilitates the use of consistent metadata across different signals, but full correlation also requires a backend like ServicePilot capable of linking logs, metrics, traces and events within a single analytics platform.
For ServicePilot, this capability forms the foundation of true full-stack observability: Moving from an isolated signal to a comprehensible chain of dependencies.
Linking symptoms to possible causes
A response time alert does not necessarily identify the cause of an incident. It merely indicates that a degradation has been observed in the service. To understand its origin, you need to be able to correlate it with other signals that appeared at the same time.
With ServicePilot, an increase in request duration can be examined in conjunction with:
- A recent deployment change
- An increase in TCP retransmissions
- CPU saturation on a node
- A network throttling issue with the container
- Memory or disk pressure
- Degradation of a persistent volume
- Overload of a hypervisor or shared physical server
- An increase in the error rate of a remote service
- TCP retransmissions
- Packet loss on an interface
- An issue with network equipment at a specific site
- Degradation of the underlying storage
Correlating this information helps teams distinguish between symptoms and probable causes. It reduces investigations based solely on assumptions and makes it easier to prioritize corrective actions.
Reducing incident resolution time
The value of full-stack observability is most evident in situations where time is of the essence. When a critical service slows down, teams must quickly determine the scope of the incident, identify the affected components and assess its business impact.
By consolidating relevant information within a single analytical context, ServicePilot helps reduce the need to switch back and forth between tools and speeds up the diagnostic process. Teams gain a clearer view of the dependencies between services and can focus their efforts on the components most likely to be causing the performance degradation.
This approach is also valuable outside of incident scenarios. It can be used to:
- Validate the impact of a new deployment
- Identify the services that are most dependent on a given infrastructure
- Anticipate the risk of saturation
- Compare performance across multiple versions
- Analyze consumption trends
- Document the actual topology of an environment
- Verify the effects of a network or infrastructure change
ServicePilot, from visibility to action
In a Kubernetes environment, visibility can no longer be limited to the status of pods or resource usage. An application’s performance depends on a set of interconnected layers: code, containers, nodes, virtual machines, hypervisors, networking and physical infrastructure. Effective observability must therefore be able to track components despite their dynamic nature and preserve the context necessary for their analysis. Automated data collection, enrichment with Kubernetes metadata and the correlation of metrics, logs, traces and events form the foundation of this approach.
Observability should not merely produce more data. It must make this data understandable and directly actionable by the teams responsible for ensuring service availability. By combining collection, enrichment, topology and correlation, ServicePilot provides a shared view for application, DevOps, network and infrastructure teams. Each team can maintain its own level of analysis while sharing a common technical context.
It is this ability to connect the different layers that enables ServicePilot to transform fragmented monitoring into true full-stack observability: observability designed not only to detect anomalies, but also to quickly understand their impact and guide teams toward the appropriate actions.
With ServicePilot, full-stack observability becomes a tool for operational insight: it connects the user experience to technical components, enabling faster incident diagnosis and better management of the complexity of modern IT environments.
