The future of server monitoring: observing network flows
What is network flow monitoring for servers?
NetTrace is a technology developed by ServicePilot that captures network flows on Windows, Linux and IBM z/OS servers. Network connection monitoring on servers consists of collecting, recording and analyzing incoming and outgoing traffic.
This not only allows you to track traffic, but also to analyze interactions between services, applications, hosts, clusters or external dependencies for which your IT services are reliant upon.
Why is server network flow monitoring crucial?
Modern applications do not live in isolation. They rely on a network of services, APIs and infrastructure that all need to work in harmony. When a slowdown happens, your users do not care whether it is the application or the network — they just want it fixed.
But here is the challenge: networks are complex, dynamic and often opaque. Traditional monitoring tools leave blind spots and troubleshooting can turn into finger-pointing between several IT teams.
ServicePilot NetTrace is designed to change that. By automatically discovering all network communications, surfacing performance hotspots and unifying insights across your stack, NetTrace helps you see - and solve - issues faster.
Monitoring network connections on hosts is essential to ensure system performance, reliability and security. It offers:
- Total visibility: Tracking network connections at the server level provides a detailed understanding of who is communicating with whom, when and how. This visibility is essential for detecting bottlenecks or anticipating failures.
- Performance optimization: Traffic analysis helps identify where slowdowns occur to adjust server and application configurations as well as improve efficiency.
- Cloud traffic analytics: The ServicePilot Agent deployed on a VPS/VDS or bare-metal machine provides visibility into network traffic, even in Cloud environments.
- Anomaly detection and security: It can help identify suspicious traffic such as unusual connections, intrusion attempts, unexpected large transfers... It is a key tool for strengthening cybersecurity.
- Regulatory compliance: In environments subject to strict standards (finance, healthcare, industry, government, military, etc.), NetTrace documents network activity to facilitate audits and meet compliance requirements.
Identify errors, bottlenecks and service latencies
Now picture this: a critical customer-facing service slows to a crawl during peak hours. The application logs are not showing errors but users are frustrated. Where do you start if basic metrics do not show anything?
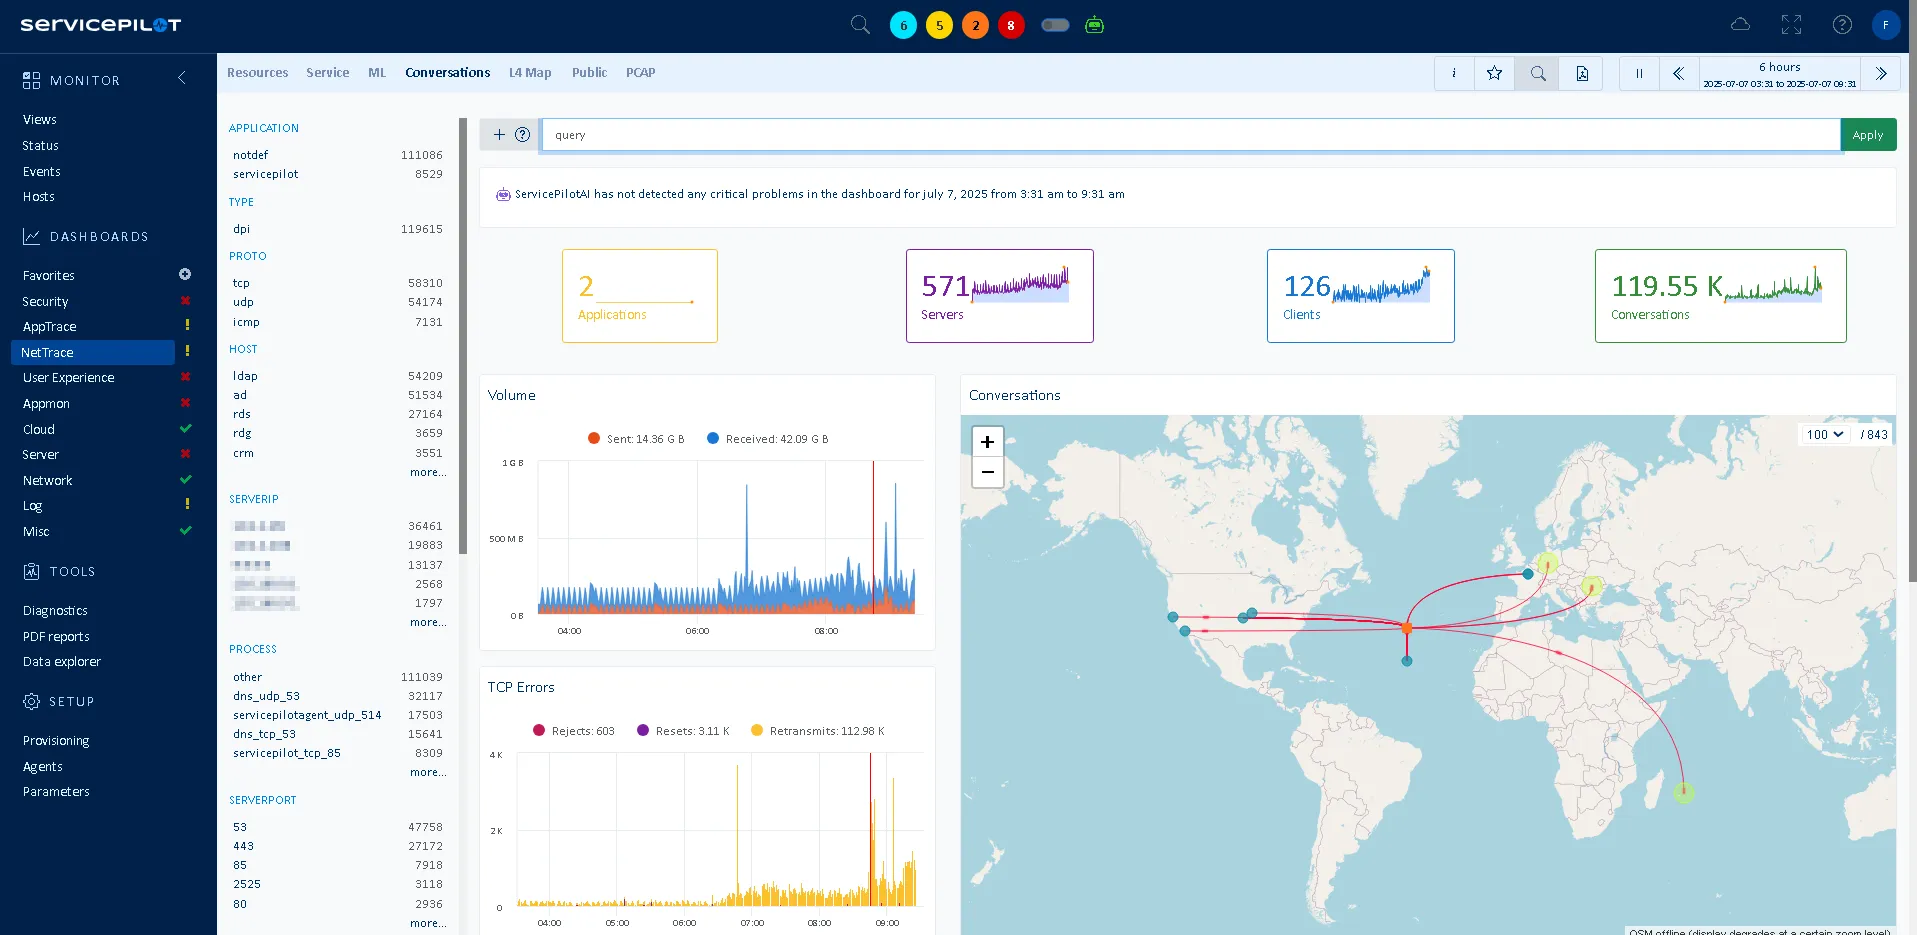
NetTrace provides ready-to-use dashboards that surface throughput, latency and error rates across all your conversations. With just a glance, you can identify spikes in retransmissions, saturated links or slow paths between key services. Maybe you notice that traffic between your API layer and database consistently shows higher latency than other flows. Or that a single region is driving most of your packet loss. NetTrace makes these bottlenecks visible instantly so you can act before users feel the pain. Instead of chasing hunches, you troubleshoot with data — and resolve issues in minutes, not hours.
Servers, whether Windows or Linux, are at the heart of IT operations. The ServicePilot Agent and an Auto-provisioning rule make it possible to automate the monitoring of network communications in order to go beyond typical metrics such as Ping, SNMP, WMI, etc.
The possibilities for analysis are endless: monitoring of public flows and IP addresses, monitoring of TCP Flags by application or server... This monitoring is complemented by key performance indicators (KPIs) such as system/network response times, data/packet volumes and more, providing more useful data for troubleshooting incidents in complex dynamic architectures.
Here are some important indicators and their meanings:
- TCP Reset: Indicates the abrupt termination of a connection. A high number of resets may indicate network problems or denial-of-service attacks. A study has shown that on a large-scale network, a reset rate higher than 5% may indicate network or security problems.
- TCP Reject: Connection refusal. An increase in rejections may indicate unauthorized access attempts.
- TCP Retransmit: Retransmitted packets. Frequent retransmissions may indicate network problems such as packet loss or congestion.
- System Response Time: Monitor server response time to ensure applications are running efficiently. High response time may indicate server performance issues or excessive load that affects the performance of critical applications.
- Network Response Time: Measure latency to evaluate network performance. High network response times may indicate routing or congestion issues.
- Data Volume in Bytes and Packets: Track the volume of data exchanged to identify traffic trends and adjust network capacity. Monitor the number of packets to detect anomalies in data flows. An unexpected spike in data volume may indicate a massive download or a DDoS attack.
Visualize host and application topology in real time
Suppose that you are about to migrate an application to the cloud. Everything looks fine on paper, but what if a forgotten service is still relying on that old on-prem database?
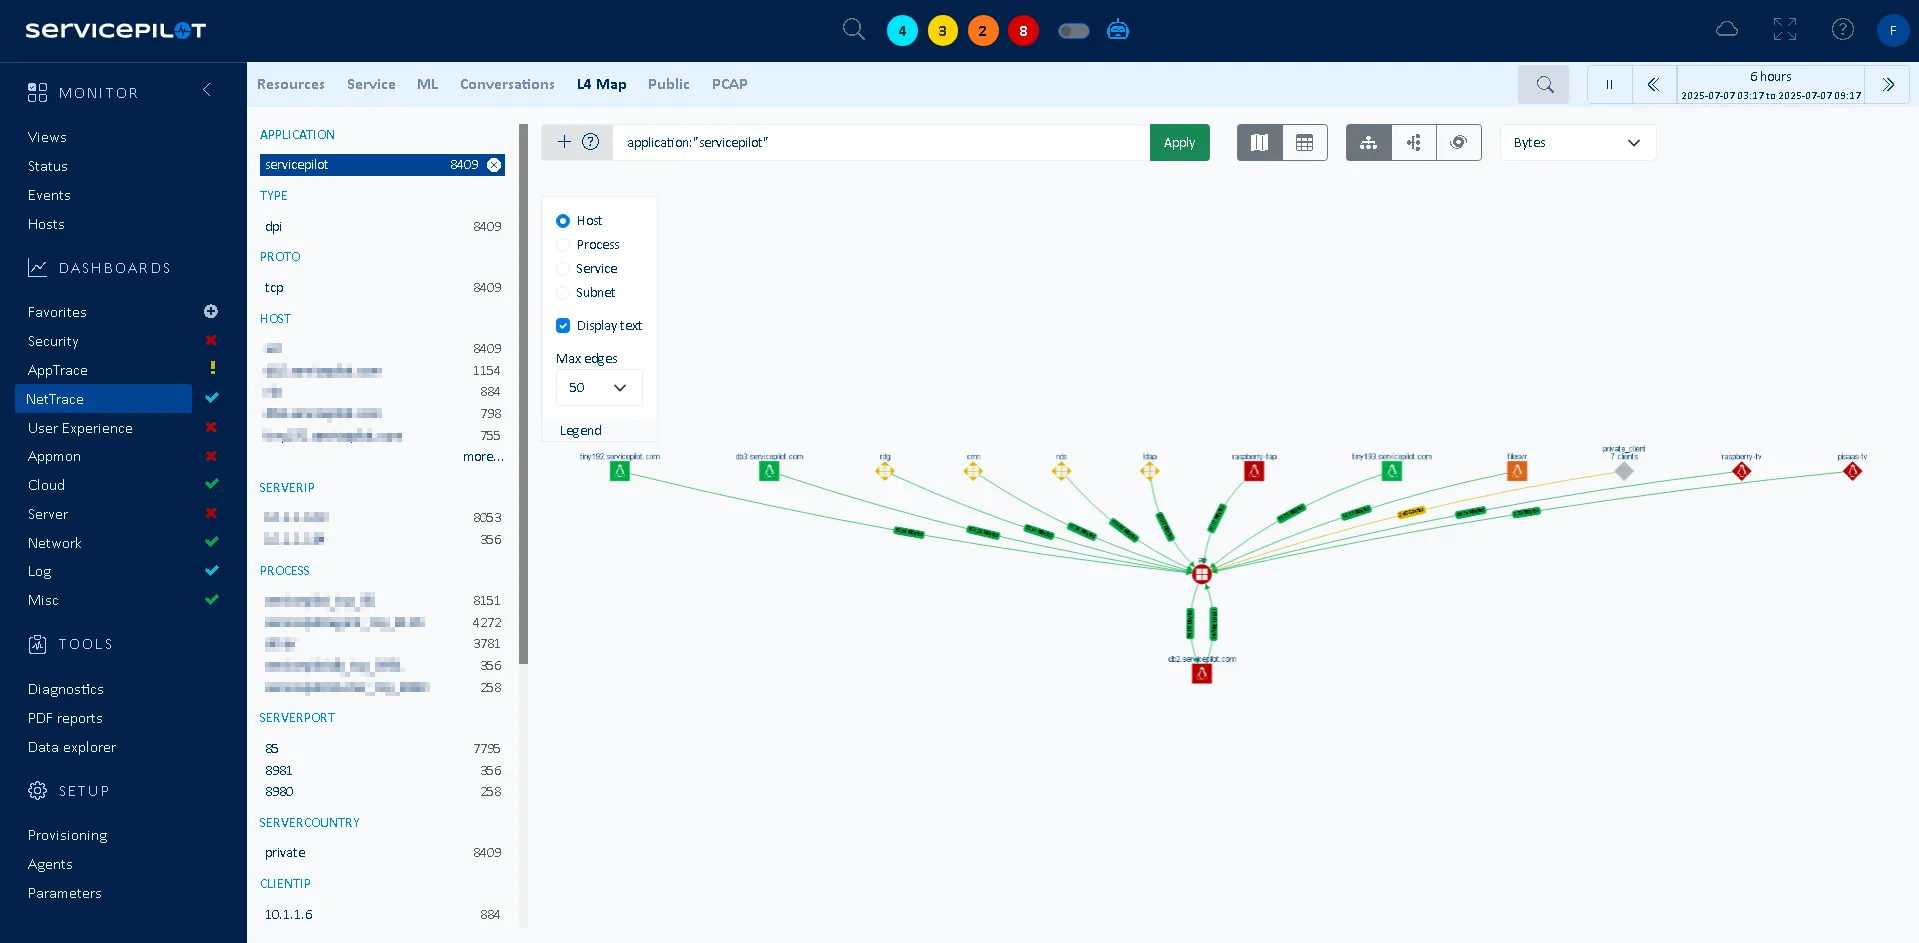
With NetTrace, you do not have to wonder. The moment you deploy the Agent, it automatically maps all L3 and L4 communications between your servers, applications, and services. The result is a live topology map of your environment — one that reflects real traffic, not outdated diagrams. You can zoom into a service, filter by host or watch dependencies update dynamically as your infrastructure changes. Instead of hidden surprises, you get clarity: every dependency, every flow, in one place. You enter a migration knowing exactly what will break if a connection is cut — and how to plan accordingly.
ServicePilot and its NetTrace technology do more than just collect metrics; they highlight information through visual and practical interfaces:
- Dynamic and automated mapping
- Real-time and historical dashboards
- PCAP file export
- Events and alerting
- Automated PDF reports
NetTrace offers a multitude of key features that enable effective formatting of critical information for system flow monitoring. Detailed mapping of application links between servers makes it easier to identify and understand interactions between different applications within the environment. Dynamic dashboards provide essential indicators such as volume, errors by traffic type, protocols used and client-server exchanges. Finally, real-time alerts ensure rapid response to detected anomalies while detailed PDF reports automate data analysis to help with proactive IT infrastructure management.
Troubleshoot with on-demand packet traces
Sometimes you need to go beyond dashboards. Maybe you have spotted suspicious traffic or you want to validate what is happening on the wire.
NetTrace lets you capture live packet data (PCAP) directly from the browser, without leaving the platform. With one click, you can launch a trace on any server and download the packets' traces for detailed analysis.
For example, if you see unusual traffic leaving a critical host, you can start a capture and confirm whether it is a misconfigured service or something more serious. You get the deep-dive visibility of traditional packet analyzers — seamlessly integrated into your monitoring workflow.
The benefit of this feature is when anomalies appear, you have the tools to prove, diagnose and resolve them.
From packets to topology: simplifying server monitoring
By integrating ServicePilot's NetTrace technology into their observability strategy, IT teams can easily:
- See every dependency with automatic discovery and live topology maps.
- Identify bottlenecks fast with real-time performance dashboards.
- Unify the teams by correlating application and network insights.
- Go deep when it matters with built-in packet capture.
Automatic flow monitoring is not limited to network equipment, it also extends to virtualized and Cloud servers, where the performance and security of critical systems are at stake. Augmented visibility of system behavior enables application performance improvements, enhanced cybersecurity and compliance posture.
👉 Ready to see your own network story? Start your free trial of ServicePilot NetTrace or request a demo today.
