Monitoring Nvidia GPU cards
What can GPU cards be used for?
Nvidia GPUs are central to modern artificial intelligence infrastructure. Artificial intelligence can be divided into three main disciplines: predictive, generative, and agentic. Predictive AI uses models to anticipate future events based on historical data. Generative AI, on the other hand, creates new content such as images, text, or videos. Finally, agentic AI focuses on creating autonomous agents capable of making decisions and interacting with their environment.
To deploy an AI solution in a private data center, several steps are necessary. First, it is crucial to have the right infrastructure in place. This includes installing GPU (Graphics Processing Unit) cards, which are essential for the intensive calculations required by AI models. At the same time, software such as Ollama on Linux must be installed to manage and run these models.
Once the infrastructure is ready, it is time to choose a Large Language Model (LLM). These models come in the form of files several gigabytes in size. Popular options include Mistral, Qwen, and OpenAI, available in paid or free versions. It is important to note that the size of the model in gigabytes must not exceed the VRAM (Video RAM) capacity of the GPU card used. For example, if your GPU card has 16 GB of VRAM, you will need to choose a model whose size does not exceed this limit.
After selecting and installing the appropriate LLM, the AI is ready to process requests via a REST API. This interface allows external applications to interact with the AI model by sending HTTP requests and receiving responses. This facilitates the integration of AI into various systems and services, offering maximum flexibility.
This article details how to effectively monitor Nvidia GPU cards, from hardware specifics to metrics to collect, and explains how ServicePilot offers comprehensive monitoring in this area.
What are Nvidia GPUs?
Nvidia GPUs are available in “consumer” (GeForce/RTX) and data center (Tesla/A100/H100, etc.) ranges. Consumer GPUs are optimized for real-time graphics rendering (video games), with the goal of minimizing latency per rendered image. Conversely, data center GPUs are designed for intensive parallel computing. They process massive batches of data simultaneously without worrying about the latency of a single operation, but by maximizing the number of operations per second. For example, training a large language model (LLM) is a massively parallel task involving giant matrix multiplications. This is an area where data center GPUs such as the Nvidia H100 excel, executing trillions of operations per second.
Data center GPUs also offer advanced hardware features compared to consumer cards. They have much more video memory and support error-correcting code (ECC) memory. For example, a H100 can hold up to 80 GB of HBM3 memory, compared to ~24 GB of GDDR6X on a gaming card. This is essential for ensuring the reliability of long and massive calculations, as a single bit inversion can corrupt a model that has been trained for weeks. A GPU such as the H100 therefore includes specialized units capable of half-precision (FP16/TF32) or even FP8 calculations to drastically accelerate the training and inference of neural networks. These specific features (massive memory, parallel computing, AI cores) make Nvidia GPUs essential components of modern AI workloads. They are ubiquitous in production and provide computing power that CPUs cannot deliver.
Monitoring GPUs in an AI/ML and HPC (High Performance Computing) environment is therefore vital for detecting bottlenecks (resource saturation, thermal throttling, memory errors, etc.) and ensuring that these expensive resources deliver the expected performance.
Collecting GPU metrics
There are several methods for collecting metrics from Nvidia GPUs:
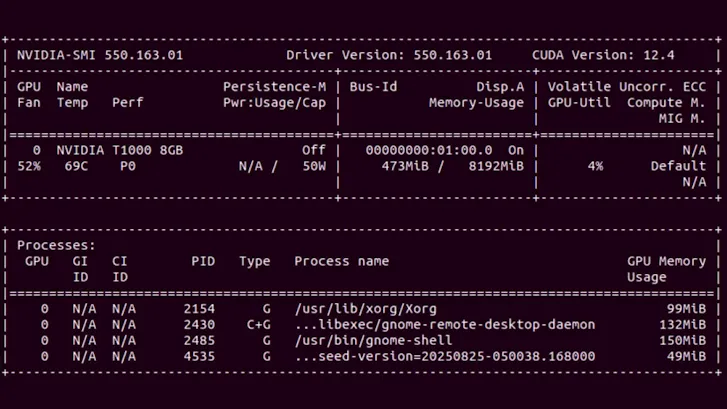
• nvidia-smi (System Management Interface): this command-line utility, provided with Nvidia drivers, gives a snapshot of the GPU status via NVML libraries. By typing nvidia-smi, you can obtain real-time information on GPU usage, memory consumption, temperature, power, etc. It is the fastest tool for checking that a GPU is working and seeing its load at a given moment. However, nvidia-smi does not record metrics continuously or historically. For continuous, centralized monitoring, you need to use dedicated tools.
• NVIDIA DCGM (Data Center GPU Manager): This is Nvidia's official software suite, consisting of several tools for managing and monitoring GPUs in a server environment. DCGM runs in the background on GPU nodes and exposes detailed telemetry for each GPU (usage, memory, temperature, power, etc.) via NVML libraries. Nvidia also offers a Prometheus DCGM exporter that exposes these metrics over HTTP so that they can be scraped by a Prometheus collector or other agent (Telegraf, etc.). In Kubernetes, the NVIDIA GPU Operator deployment natively integrates DCGM Exporter to publish GPU telemetry and allows you to build dashboards.
Important GPU metrics to monitor
Once data collection is in place, it is important to define the key indicators. Nvidia GPUs provide numerous performance and status counters, the main ones to monitor in an AI/ML context being:
• GPU utilization – the percentage of time that the GPU's computing units (Streaming Multiprocessors) are executing tasks. This is the utilization rate of the CUDA cores, the main indicator of GPU compute load. Utilization close to 100% indicates that the GPU is saturated with computation (potentially a bottleneck), while very low utilization may indicate a waste of resources if the GPU remains idle when there is demand.
• Memory consumed – the amount of GPU memory used by applications compared to the total available memory. Data center GPUs offer tens of gigabytes of VRAM that must be monitored to avoid out-of-memory errors during inference or training of heavy models. Remaining free memory is a metric to examine in order to anticipate VRAM saturation, especially since LLMs often fit entirely in GPU memory.
• GPU memory usage – the utilization rate of the GPU memory controller, i.e., the percentage of time during which the GPU memory is being read or written to. This indicates whether the bottleneck is in memory exchange (e.g., VRAM saturated in throughput, which can limit the GPU even if the compute cores are not at 100%). Very high memory usage suggests that GPU memory bandwidth is the limiting factor (common on models handling huge tensors).
• GPU temperature – the temperature of the GPU, in degrees Celsius. Nvidia GPUs can reach over 80°C under full load. A temperature that regularly exceeds ~85°C is critical and can lead to throttling (automatic frequency reduction to prevent overheating). It is therefore advisable to monitor this metric, as Nvidia often indicates ~85°C as the danger threshold for most data center GPUs.
• Power consumption – the GPU's power consumption in watts at a given moment. AI tasks are energy-intensive, so an RTX/5090-type GPU can consume more than 600W for each request. Monitoring power consumption allows you to manage the electrical and thermal capacity of the data center and detect abnormal situations (e.g., a GPU consuming more than usual for the same load may indicate a problem). Sustained high consumption may also indicate that a workload is fully utilizing the GPU and potentially overworking it over time.
• PCIe bandwidth – PCIe (Peripheral Component Interconnect Express) connectivity between the GPU and CPU. This is a critical link in GPU performance, especially in AI and multimedia environments where large volumes of data are transferred between system memory and GPU memory. The PCIe generation (Gen3, Gen4, Gen5, etc.) and link width (x4, x8, x16) determine the maximum theoretical bandwidth.
• Video encoding – hardware units dedicated to video encoding (NVENC) and decoding (NVDEC), used in streaming workflows, GPU virtualization (VDI), or certain AI multimedia pipelines (vision, image recognition). Since these engines are independent of CUDA cores, it is essential to monitor their activity separately. Monitoring the number of NVENC sessions, the encoded frame rate (FPS), and the encoding latency of a frame can help detect NVENC engine saturation, overly complex compression, or excessive competition between streams.
• Clock frequencies – clock frequencies are fundamental indicators of GPU health and performance. There are several different frequencies: GPU clock, SM clock, Memory clock, etc. These frequencies can vary dynamically depending on load and temperature: the GPU adjusts its frequency based on Power Management (Dynamic Boost, Thermal Throttling, etc.). In production, it is therefore essential to monitor variations between the current frequency and the maximum supported frequency. For example, a GPU or SM frequency that regularly drops below the nominal target is a sign of throttling (thermal or energy). Correlated with temperature and power, this information can be used to identify faulty ventilation, an undersized power supply, or an overly restrictive energy policy.
Integrated dashboards and alerts
In addition to simplified data collection, ServicePilot provides ready-to-use dashboards for Nvidia GPUs. The global dashboard provides an overview of GPU health and displays key metrics for each card in the compute cluster, making it easy to compare temperatures, power consumption, average VRAM usage, and more. Detailed individual dashboards for each GPU allow you to quickly correlate GPU KPIs to identify the cause of under- or over-utilization.
ServicePilot also makes it very easy to customize dashboards to combine widgets according to each team's needs. You can filter and organize data to create unified views that correlate multiple data sources within a single screen. These interactive and intuitive dashboards make it easy to make visual correlations. For example, you can display GPU usage and network throughput for a service side by side, or GPU metrics with CPU metrics for the same server to identify abnormal behavior. This approach allows you to see all of a system's parameters at a glance to quickly diagnose problems when they arise.
When it comes to alerting, ServicePilot stands out for its adaptive and intelligent alerting capabilities. The main KPIs have adjustable static thresholds, but the platform also offers advanced alerting mechanisms that leverage statistical analysis and machine learning. In practice, this means that dynamic thresholds can be activated that adjust based on observed trends. For example, the system can automatically establish the “baseline” for GPU utilization at different times of the day and trigger an alert only if utilization deviates significantly from this normal range (rather than from an arbitrary absolute threshold). This self-adaptive threshold avoids false alerts during predictable peaks (night batches, etc.) and highlights real anomalies (unusual activity outside the profile). The goal is to implement proactive problem detection by analyzing the temporal evolution of metrics and their interactions rather than simple fixed thresholds.
ServicePilot prioritizes truly critical alerts and reduces noise. ML anomaly detection algorithms automatically identify any deviation from normal service performance or availability levels, drastically reducing the volume of alerts to be processed. Operators can focus on important incidents without being overwhelmed by notifications for minor or expected variations.
Use cases for GPU monitoring
⚡ Energy optimization in a data center
A technology company operating a large data center dedicated to training artificial intelligence models observed a significant increase in its operating costs, mainly related to the energy consumption of its GPUs. These graphics processors are used in large numbers to train complex neural networks, particularly in the field of natural language processing (NLP).
Findings: Analysis of power consumption data revealed that some GPUs were consuming a lot of energy without a proportional gain in performance. Upon investigation, the company discovered that several models were not properly optimized for its GPUs, resulting in inefficient energy use. In addition, some units continued to consume electricity even when they were partially inactive during data preprocessing phases.
Result: By identifying these inefficiencies, the company was able to readjust its models and workloads, significantly reducing energy expenditure while improving the productivity of its GPUs.
🚗 Video processing for autonomous vehicles
A company developing autonomous vehicles relies on GPUs to analyze video streams from its onboard cameras in real time. These calculations enable object detection, trajectory planning, and instant decision-making.
Challenge: Real-time processing requires rigorous graphics memory management. Exceeding memory capacity can cause critical delays in operations such as obstacle recognition or lane keeping, compromising vehicle safety.
Solution: By closely monitoring GPU memory usage, engineers were able to anticipate load peaks and dynamically adapt processing. This continuous monitoring ensures stable performance and reliable decisions by the embedded system, even in complex and dynamic environments.
🏥 Medical research and imaging center
At a medical research center, a team is using GPUs to train a tumor segmentation model on 3D images from CT and MRI scans. These highly detailed image volumes place heavy demands on graphics memory.
Problem: With the increase in data volume, researchers encountered “Out of Memory” (OOM) errors caused by insufficient image buffer space on GPUs. High-resolution 3D images saturated the memory, often interrupting the training process and delaying the project's progress.
Approach taken: Researchers implemented a subsampling and patch learning strategy, cutting images into smaller sections that were processed individually. This optimization significantly reduced memory consumption, enabling continuous and stable training without compromising model accuracy.
🌦️ Climate research and weather simulations
A climate research institute operates a GPU cluster to perform large-scale weather simulations. These models require extensive parallel computing to accurately predict changes in atmospheric conditions.
Observation: Researchers noticed that the multiprocessor frequency (SM clock) remained high while overall GPU utilization remained low. Analysis revealed a memory-related bottleneck: the GPU was constantly waiting for data transfers from main memory or the PCIe bus, limiting its computing power.
Optimization: By revising memory access patterns and streamlining data transfers, the team reduced wait times and improved parallel processing efficiency. This optimization accelerated simulations while maximizing the use of available hardware resources.
Turnkey monitoring of Nvidia GPUs with ServicePilot
Monitoring Nvidia GPUs is no longer limited to collecting a few hardware counters: it is now a strategic observability issue for all modern AI, high-performance computing, and graphics rendering infrastructures. Between massively parallel workloads, rapid thermal variations, and dynamic behaviors related to power management, a GPU is a living component whose performance can change rapidly. Without accurate and continuous monitoring, teams quickly lose visibility into what really determines the stability and performance of their workloads.
ServicePilot's turnkey approach transforms GPU monitoring into a comprehensive and easy-to-deploy observability service. DevOps, system engineers, and data engineers can monitor their Nvidia resources without spending hours maintaining dashboards or homemade scripts. Each GPU becomes a fully integrated part of the monitoring ecosystem, visible, analyzed, and correlated in the same interface as the rest of the infrastructure.
ServicePilot offers modern GPU observability with simplified, automatic integration, intelligent KPI analysis, and a unified view of hardware performance. For any organization leveraging the power of Nvidia GPUs, it guarantees reliable, scalable, and immediately actionable monitoring.
👉 Need visibility into the performance of your Nvidia GPUs? Start your free trial of ServicePilot or request a demo today.
