Understanding and using ServicePilot Search objects

What is a ServicePilot Search object?
IT systems are producing ever-increasing amounts of data: application logs, system metrics, network events, business KPIs and various telemetry data. The ability to extract, analyze and transform this data into relevant indicators has become a major challenge for IT and business teams. How can this raw data be effectively transformed into relevant indicators and usable objects in ServicePilot?
To meet this need, ServicePilot offers a powerful concept: Search objects.
A Search object is a standard ServicePilot object fed directly by a query executed in the ServicePilot internal database.
The operating principle is simple. Executing a query allows the ServicePilot search engine to filter metrics, logs or events according to defined criteria. This allows ServicePilot to extract or aggregate the corresponding data so that it can be stored in an object with a timestamp and updated at regular intervals. This object then becomes a data source like any other in ServicePilot, benefiting from all the platform's features: graphs, dashboards, reports, alerts, correlations, etc.
ServicePilot provides multiple packages with built-in thresholds, but also offers the flexibility to deepen statistical analysis and refine monitoring according to specific needs.
Concrete use cases
Transforming logs into metrics
Aggregating system, network, application, and security logs via a ServicePilot Search object provides an overview of critical events. By highlighting anomalies and significant trends, such as a sudden increase in connections or authentication failures, you anticipate potential problems and strengthen your IT security.
For example, errors in applications and databases can be a crucial indicator of underlying problems. By creating a ServicePilot Search object that counts these errors, you view fluctuations in their volume in real time and can configure alerts to react instantly when the critical threshold is reached.
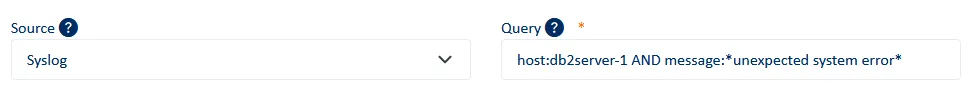
It is easy to count the number of errors in a DB2 database among the Syslog messages received:
→ Creation of a query filtering the target database “db2server-1” and the message type “*unexpected system error*”
→ Count of these occurrences every X minutes with the object Search
→ Triggering of an alert as soon as the defined threshold is reached and visualization of the trend
Metrics aggregation and statistics
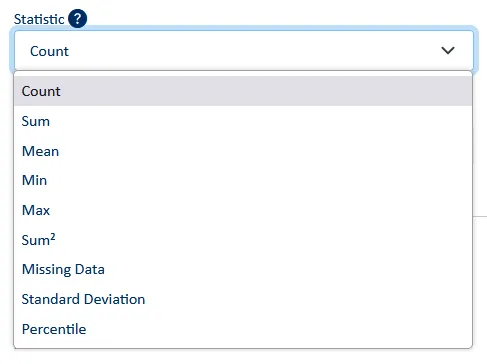
ServicePilot Search objects offer a powerful and flexible solution for aggregating metrics, allowing users to transform disparate raw data into consolidated, actionable information. Operators can be applied to the entries discovered by the query to produce a resulting value: count, sum, average, min, max, sum squared, percentile, standard deviation, etc.
Let's take the example of a cluster of several IIS servers on which we want to monitor overall performance. By configuring a Search query that targets all IIS instances in the cluster, it extracts the relevant metrics and aggregates them in real time. We may want to calculate the average number of active connections across the entire cluster or cumulate the queries processed by all servers.
With this aggregated data, graphs are created automatically and can be used in custom maps or dashboards to visualize the overall performance of the IIS cluster.
It is also possible to configure alerts to be notified when critical thresholds are exceeded, such as a sudden increase in the number of requests or a significant drop in active connections.
Monitoring business application KPIs
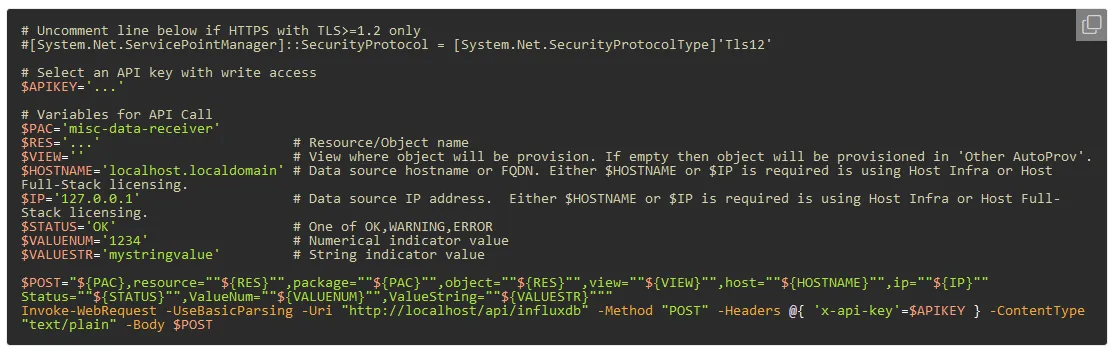
ServicePilot offers the flexibility to receive any type of data via a simple command and the "misc-data-receiver" package, enabling seamless integration of custom data.
By creating custom KPIs from ServicePilot Search objects, you can provide business teams with key performance indicators to integrate into maps or dashboards. Tracking business events, such as transactions, jobs or processes is essential to ensuring operational efficiency.
Here are some concrete examples:
- Number of orders received
- Number of successful/failed processes
- Average duration of a business process
- Business KPIs
By integrating KPIs specific to your industry, you can align technical monitoring with your company's strategic objectives. This allows you to monitor and correlate important business data to make informed decisions and optimize processes.
The absence of expected events can sometimes be as revealing as their presence. By configuring a ServicePilot Search object to detect these absences, you can quickly identify service interruptions or malfunctions that might otherwise go unnoticed. For example, when monitoring financial transactions, if no transactions are recorded during a given period (e.g., one hour), this could indicate a problem with the payment processing system or a service interruption.
How to create a ServicePilot Search object?
When creating a Search object, it is essential to adopt a few best practices to optimize its performance. It is crucial to always check the relevance of queries to avoid overly broad results and to use precise filters to improve performance. In addition, it is recommended to set frequencies appropriate to the volume of data processed and to share saved queries to standardize usage between different teams. Finally, correlating multiple Search objects enriches the analysis and provides more complete and accurate results.
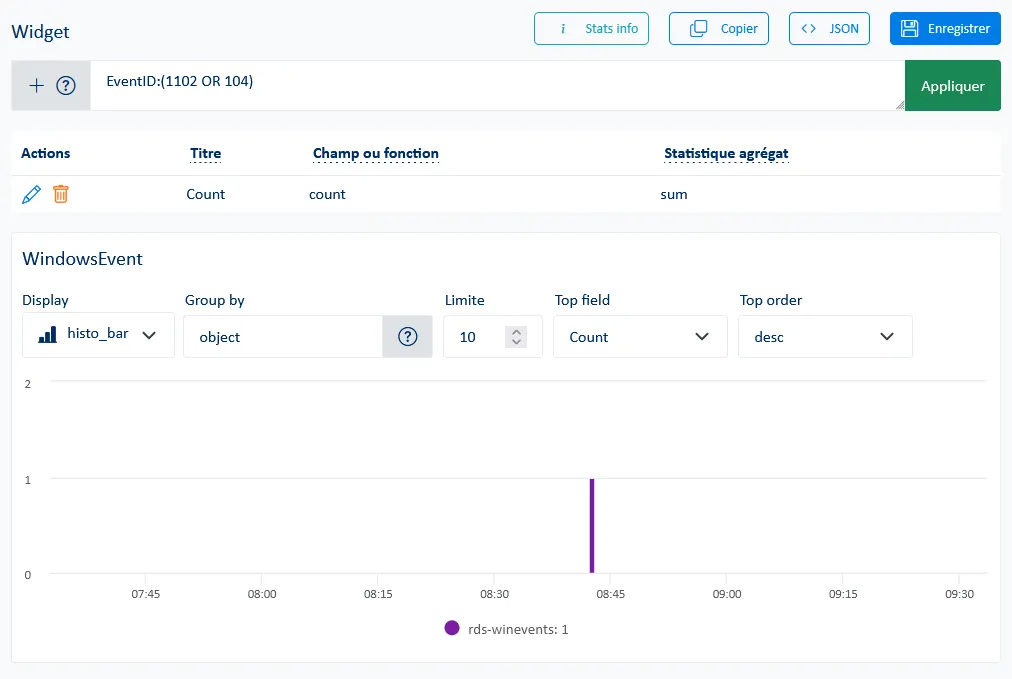
In the following example, we will search for and count Windows events with ID 1102 or 104 (Windows Event Logs Cleared). These Windows Events highlight log deletion activities. Such behavior is significant because it may indicate an attempt to cover up traces after malicious activities. If proven malicious, this action could hinder criminal investigations and allow attackers to go undetected.
Security Event ID 1102 is a security event indicating that the audit log has been cleared.
System event ID 104 indicates that the application logs have been deleted.
These events should not normally appear unless the logs are manually deleted by an administrator or by a process. It is therefore recommended that you monitor them regularly to detect any security breaches.
Step 1: Test the search query
- Go to the “Data Explorer” interface
- Select the “WindowsEvent” collection under the “Object Log” category
- Test the query “EventID:(1102 OR 104)” to check the results
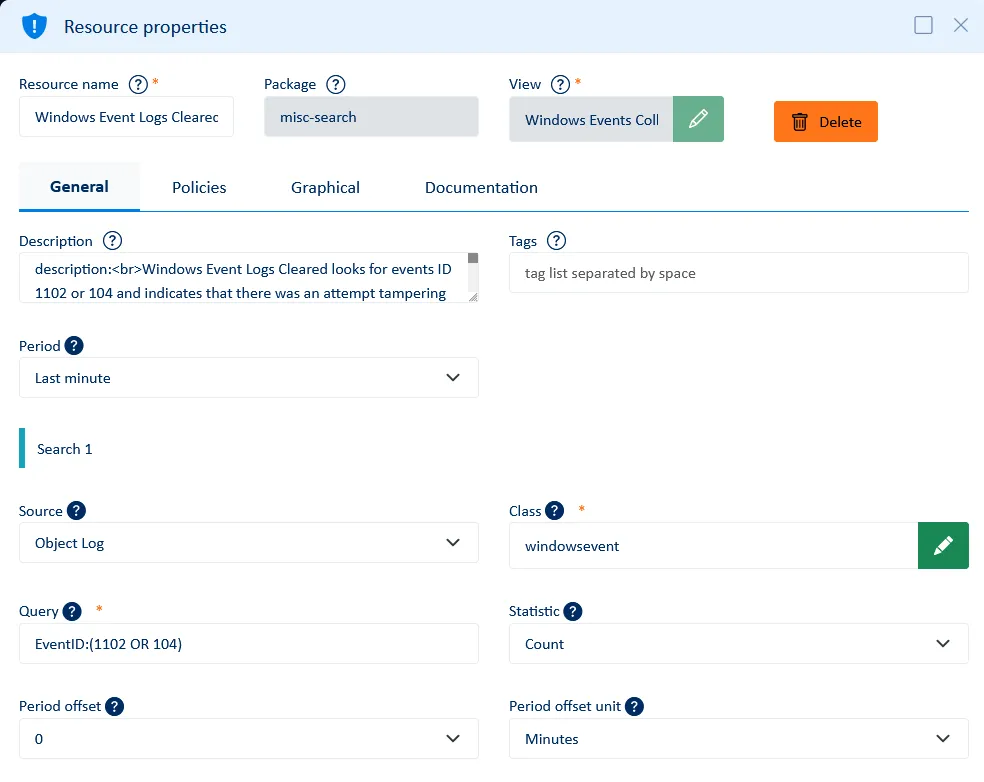
Step 2: Configure the Search object
- Go to “Provisioning” and deploy a “misc-search” package
- Enter the name of the search and, if desired, a description
- Enter the “Object Log” source and the “WindowsEvent” class
- Insert the query created in step 1, “EventID:(1102 OR 104)”
- Adjust the execution frequency and, if necessary, choose the statistical operations (count, avg, sum, min, max, etc.) to apply. In this case, we can leave the Count default value
- Click on the “OK” button and then “Save” to deploy the Search object
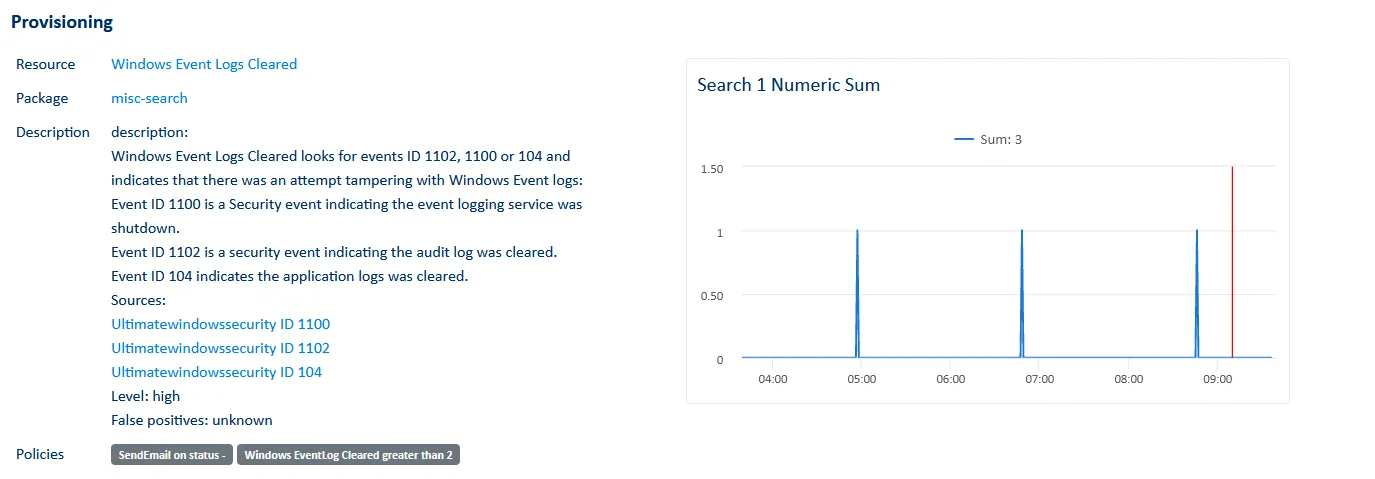
Step 3: Validate and use the data
- Check the consistency of metrics and adjust if necessary. For greater granularity, we may want to define a second query in the same object to count events 1002, then a third targeting the number of events 104
- Visualize the evolution over time to define a threshold in a Threshold Policy
- Integrate the object Search into custom dashboards and maps
- Configure an Alert policy to be notified by email when the defined threshold is exceeded
Transform raw data into operational insights
ServicePilot Search objects are an essential building block for taking full advantage of the data accumulated in your IT environments.
They allow you to:
- Transform raw data into standard objects and indicators
- Create smart alerts
- Monitor and visualize trends
- Integrate data into dashboards and maps
- Speed up analysis and troubleshooting
- Improve monitoring accuracy
They offer a simple, powerful and flexible way to leverage your logs, metrics and events to improve monitoring quality and operational performance.
