Distributed Tracing with OpenTelemetry
Instrumentation and Application Tracing
Traces of Java, .NET, PHP, Node.js, Ruby, Python, Go, or C++ applications are essential in order to have full visibility on performance and service to users. The visualization of Key Performance Indicators (KPIs) such as error rates, latencies on response times, details of SQL or Web queries, or the in-depth analysis of end-to-end transactions, allows to detect upstream errors and potential sources of incidents. This aims to reduce the impact of the causes of application service performance degradation and improve the digital experience for users.
Learn moreMonitoring and Tracing of Distributed Applications
Today's modern Internet services are often implemented through complex architectures and huge distributed systems. This type of application is often the result of a coordination between several development teams, perhaps with several programming languages, on tens or hundreds of machines, on different sites, hence the need to have a tool allowing global application monitoring, system and infrastructure correlation and a detailed view of the code related problems and queries thanks to the instrumentation of application traces.
Learn more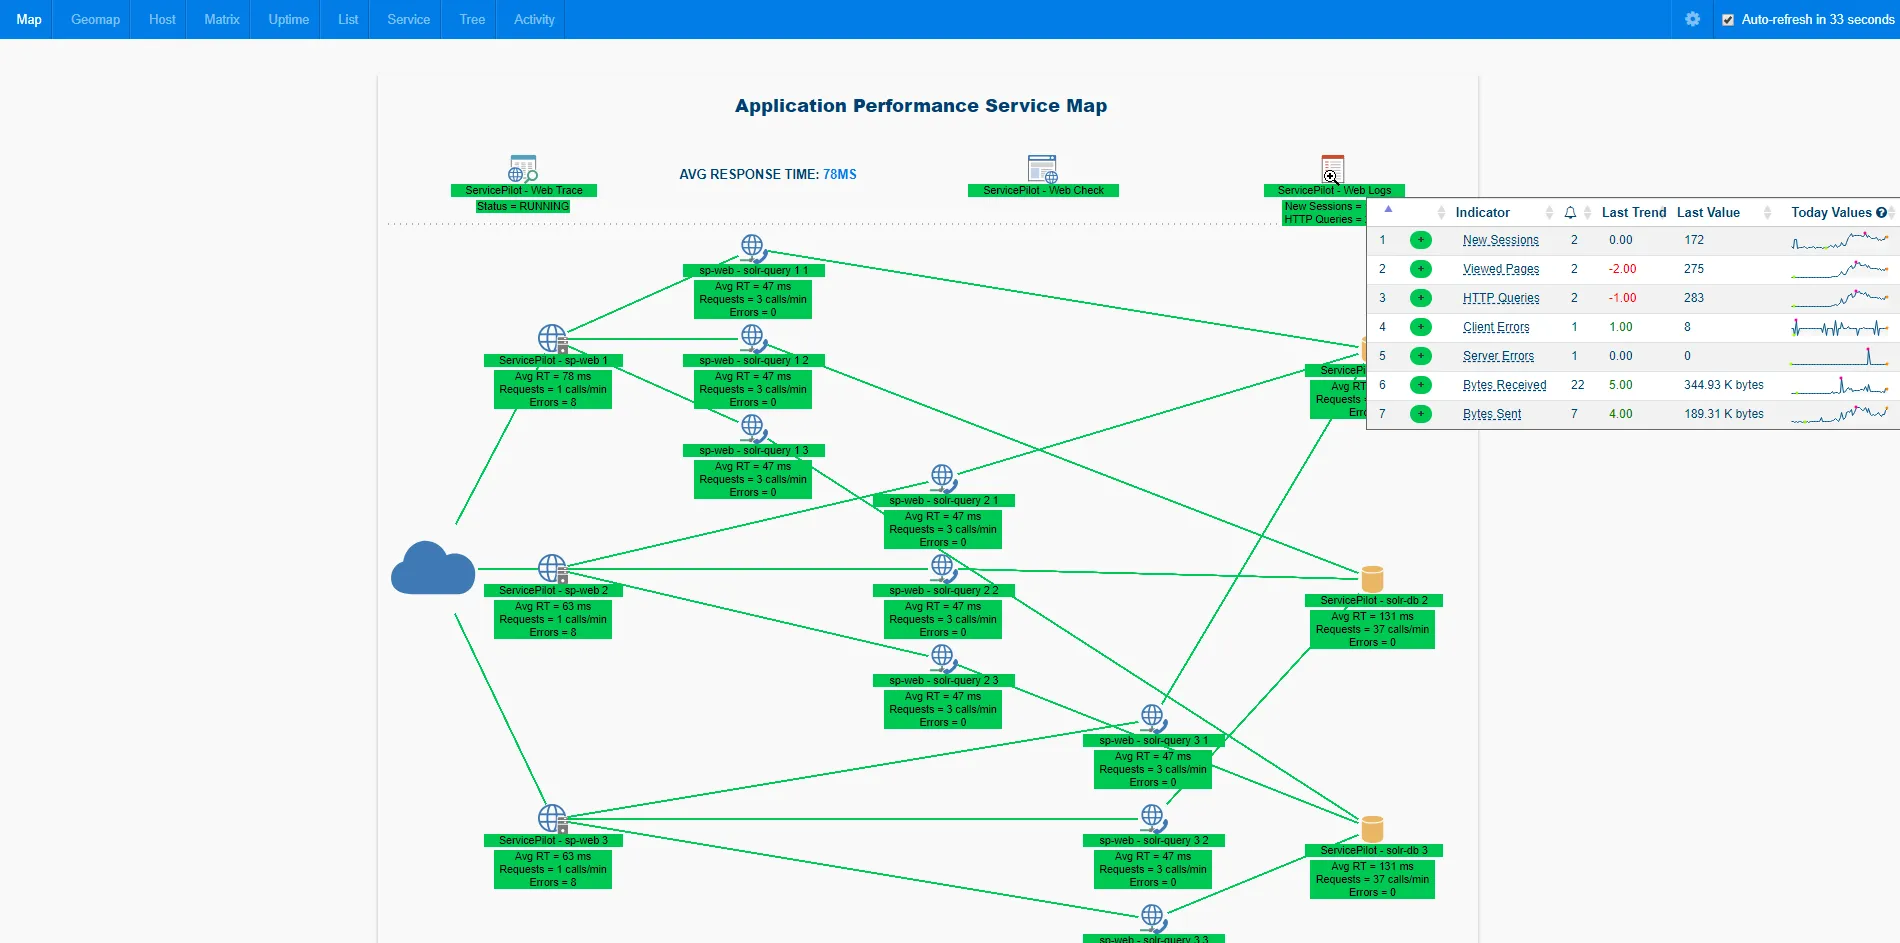
Web HTTP Transaction Analysis
More than 80% of applications must be accessible via the Web and quality of service must be optimal from anywhere. Companies are daily confronted with this situation and the real-time monitoring of the performance of Web applications makes it possible to react quickly and to prevent a critical situation from deteriorating and leading to a loss of activity.
Learn more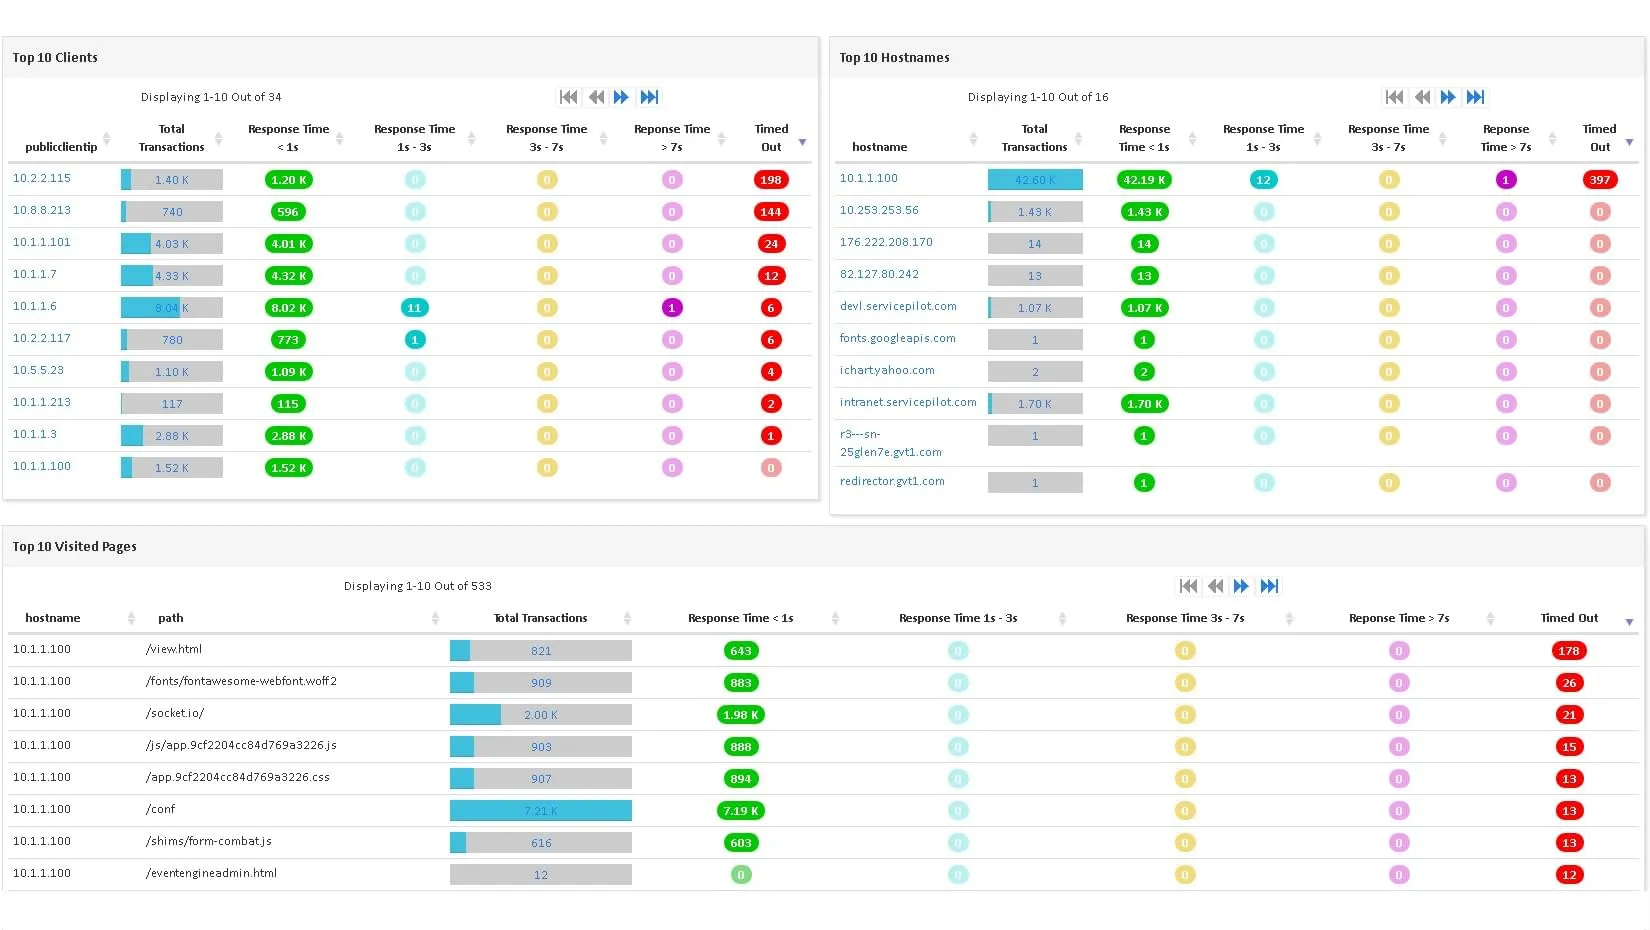
Collecting and analyzing transactions and application traces allows you to make the right decisions to improve the user experience.
But WHO are the users who have encountered 404 errors? What are the most visited URLs on my web application?
Monitoring Java applications in real time
Collect directly the transactions of your Java web applications. The analysis of the collected traces provides you with visibility on user behavior and application performance.
Monitoring.NET applications and dependencies
Analyze.NET application transactions to classify application components by error or response time and help you understand how your application is used.
Identification of critical transactions
Identify at a glance the web page loading time indicators, errors and slow transactions for all your HTTP Web applications to fully understand service degradations.
Complete end-to-end visibility
Add the monitoring of servers and networks with applications to get the end-to-end vision you need to understand the service delivered to users and to locate incidents.
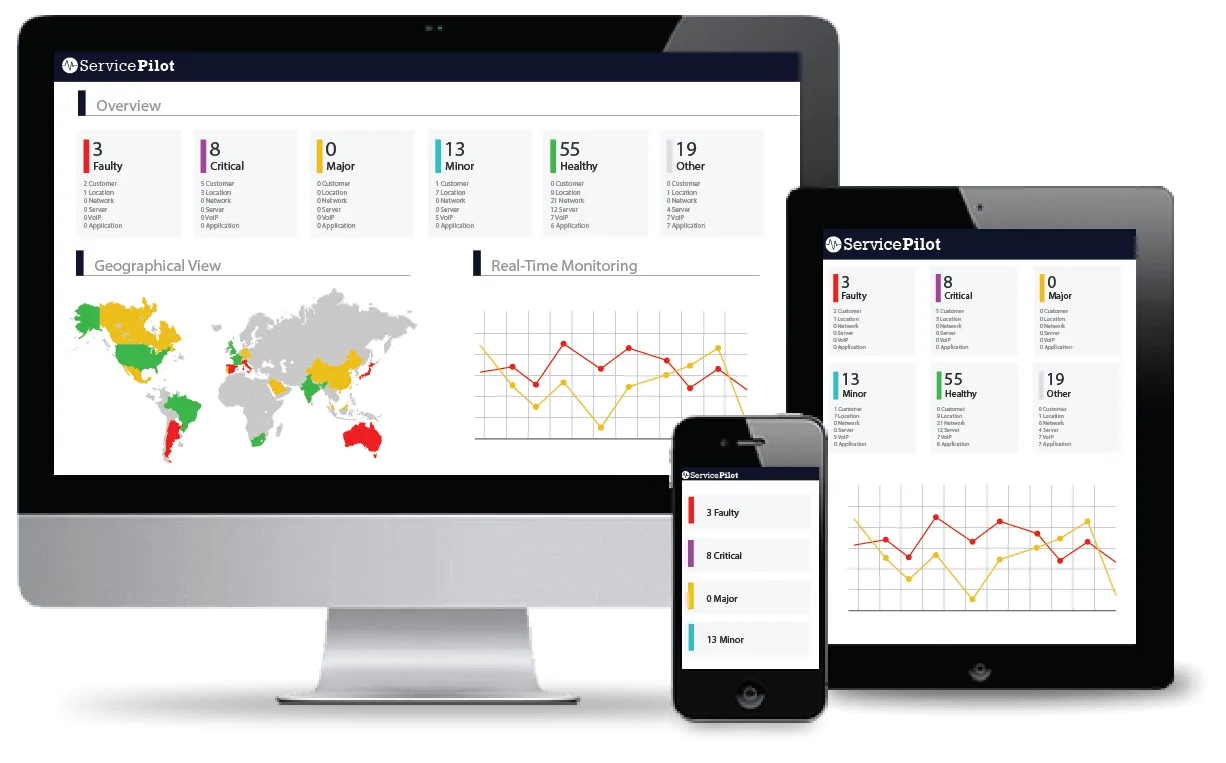
Free installation in
a few clicks
SaaS Plateform
- No on-premise software setup, servicing and configuration complexity
- Instant setup, complete and pre-configured to ensure robust monitoring
OnPremise Plateform
- Contracts and commitments over time ( > 1 year)
- Performance, Data Storage and Infrastructure Management
- 2 additional solutions: VoIP and Mainframe monitoring
