In-depth Application Transaction Analysis
Comprehensive Analysis of Web Application Transactions
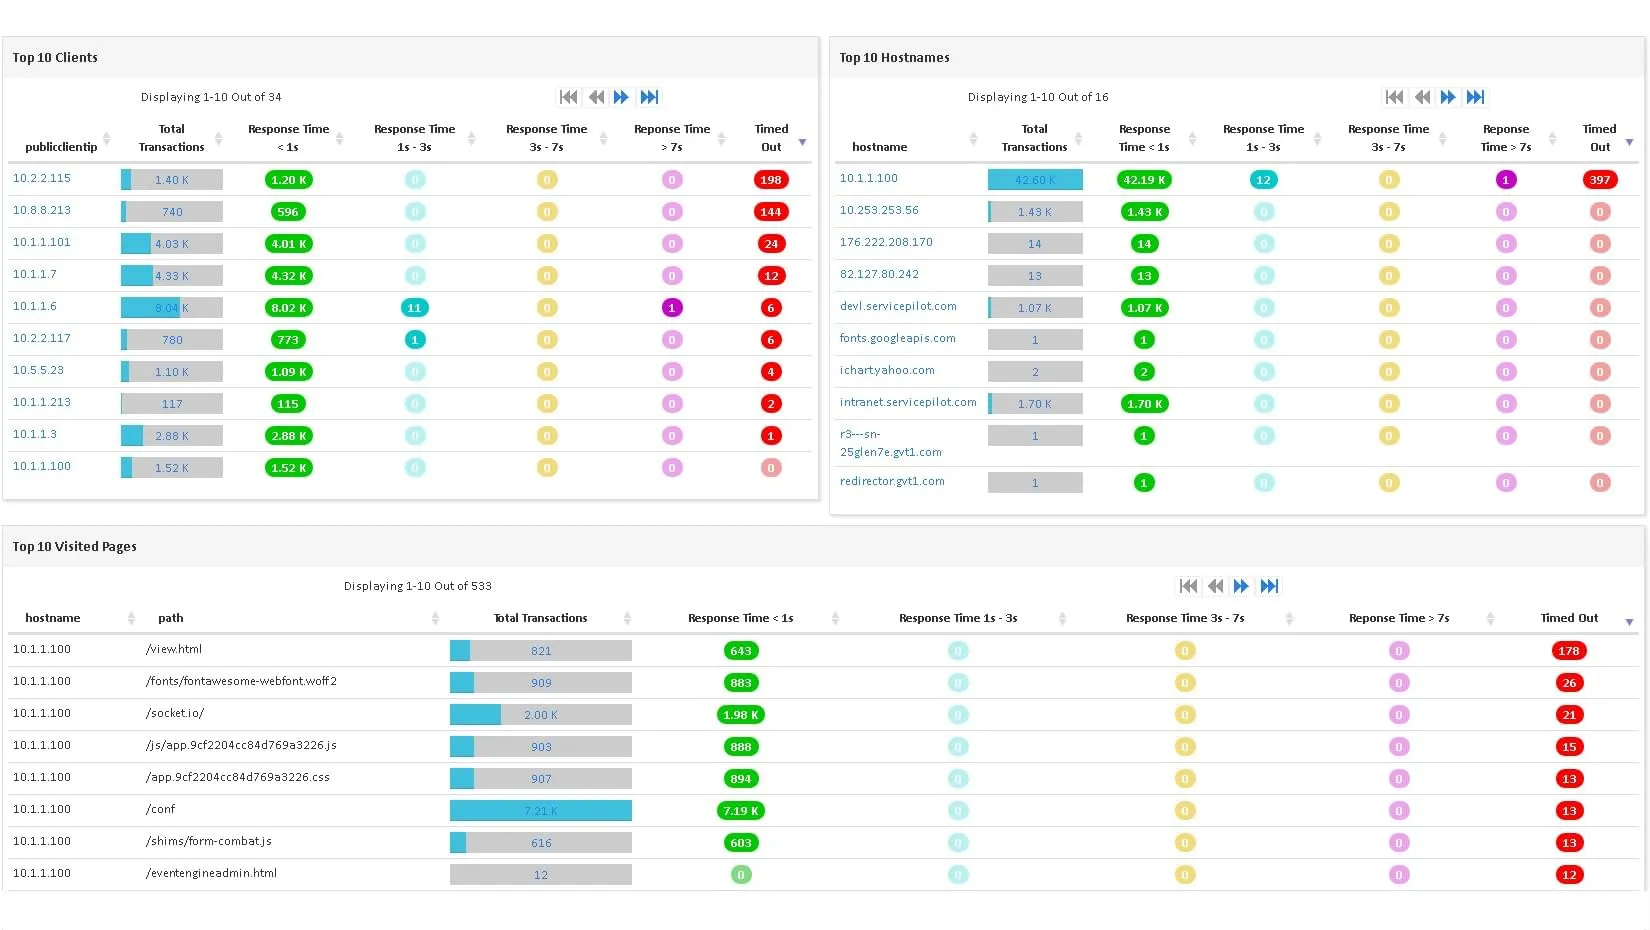
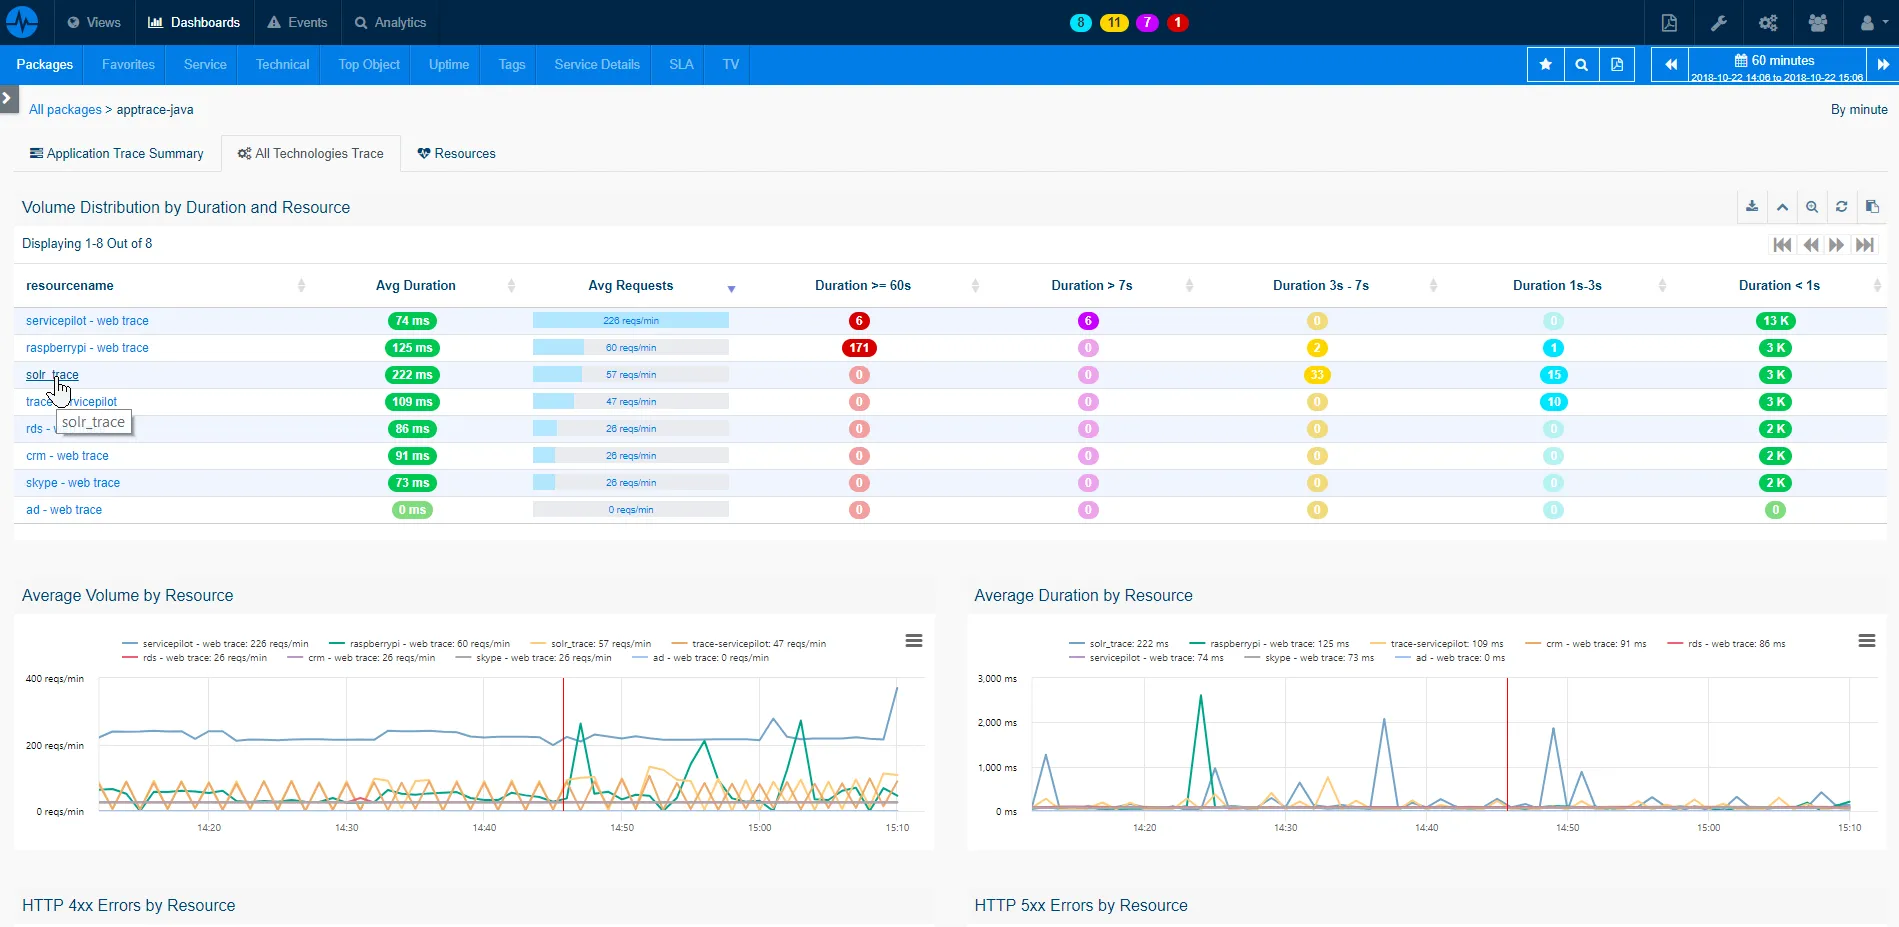
ServicePilot's detailed transaction observation and analysis capabilities empower you to identify and prioritize issues, enhancing the availability and performance of your applications. Our concise dashboards display transaction volume and response times by Tops Clients, Hostnames and visited pages, providing a holistic view of your web applications' utilization.
Imagine a high-traffic e-commerce website using ServicePilot to monitor and optimize their web transactions. This insight allows them to identify slow pages, prioritize fixes and improve overall performance, resulting in a more satisfying user experience.
- The key benefit of this feature is the detailed insight into web application transactions
- By understanding these transactions, you can ensure optimal application performance and availability, leading to improved user experience and satisfaction
Utilizing Raspberry PI as an Applicative Traffic Probe
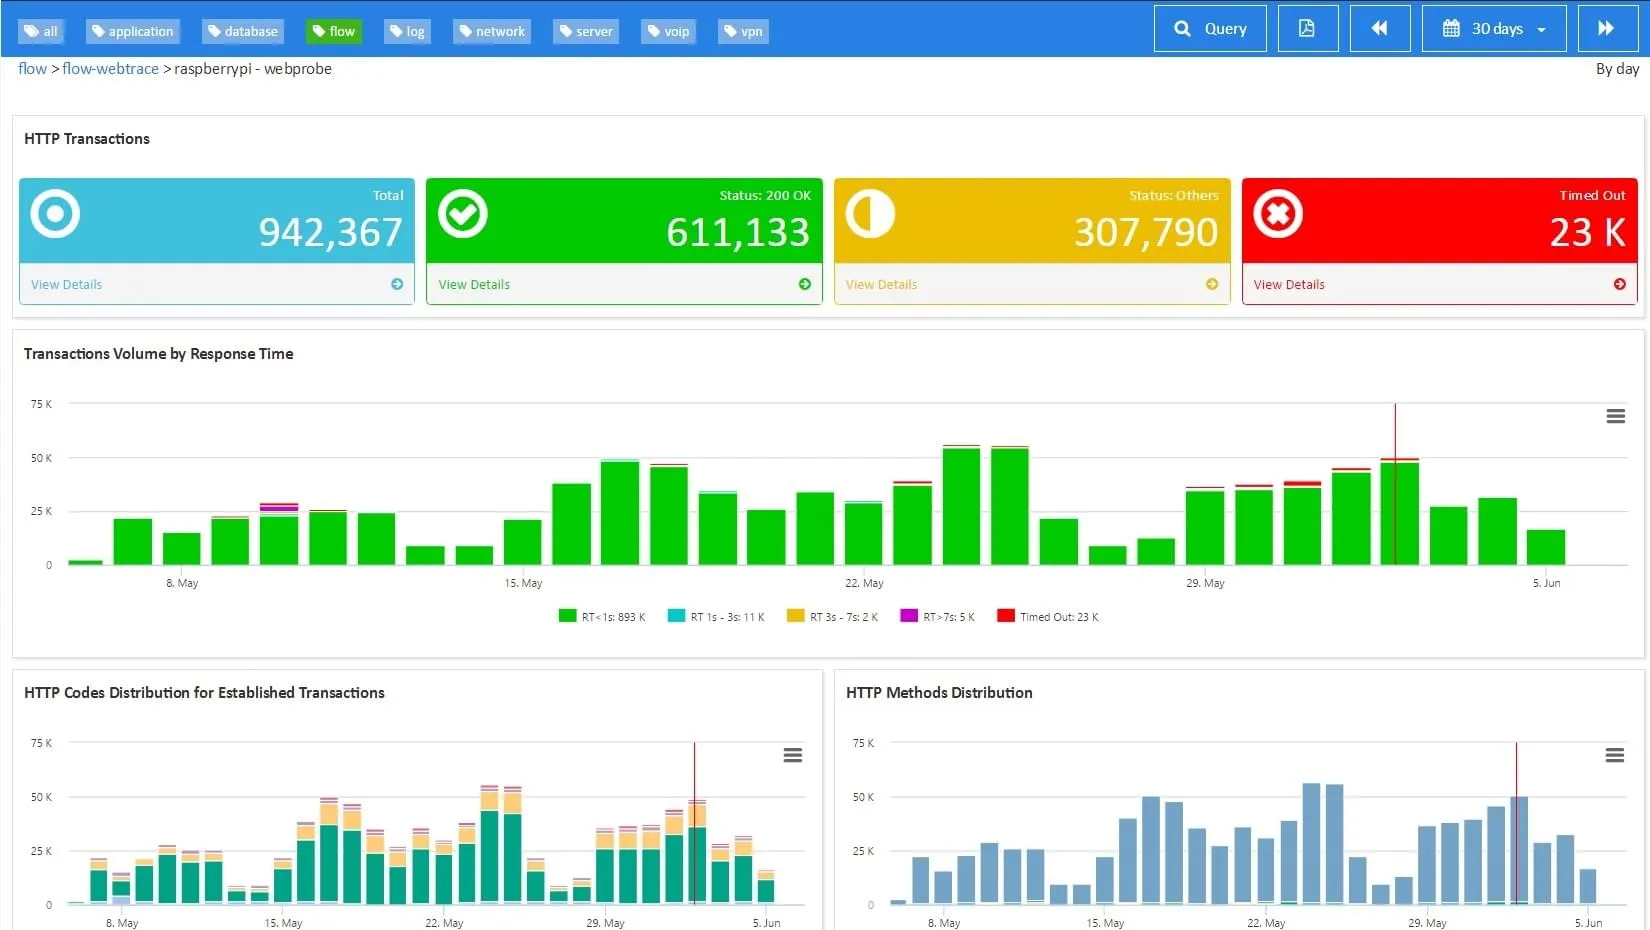
ServicePilot Agent can be installed not only on your Windows or Linux application servers but also on a Raspberry Pi device. You can transform this compact hardware into a network probe by connecting it to a mirror port on your network equipment, enabling it to analyze all HTTP transactions.
For instance, a small-to-medium business could use a cost-effective Raspberry Pi device as a network probe, providing them with deep insights into their HTTP transactions, helping identify performance bottlenecks and optimize application performance.
- The advantage of this feature is the ability to transform low-cost devices like Raspberry Pi into a powerful network probe
- It provides crucial insights into HTTP transactions and helping ensure optimal performance
Troubleshooting Slow Applications
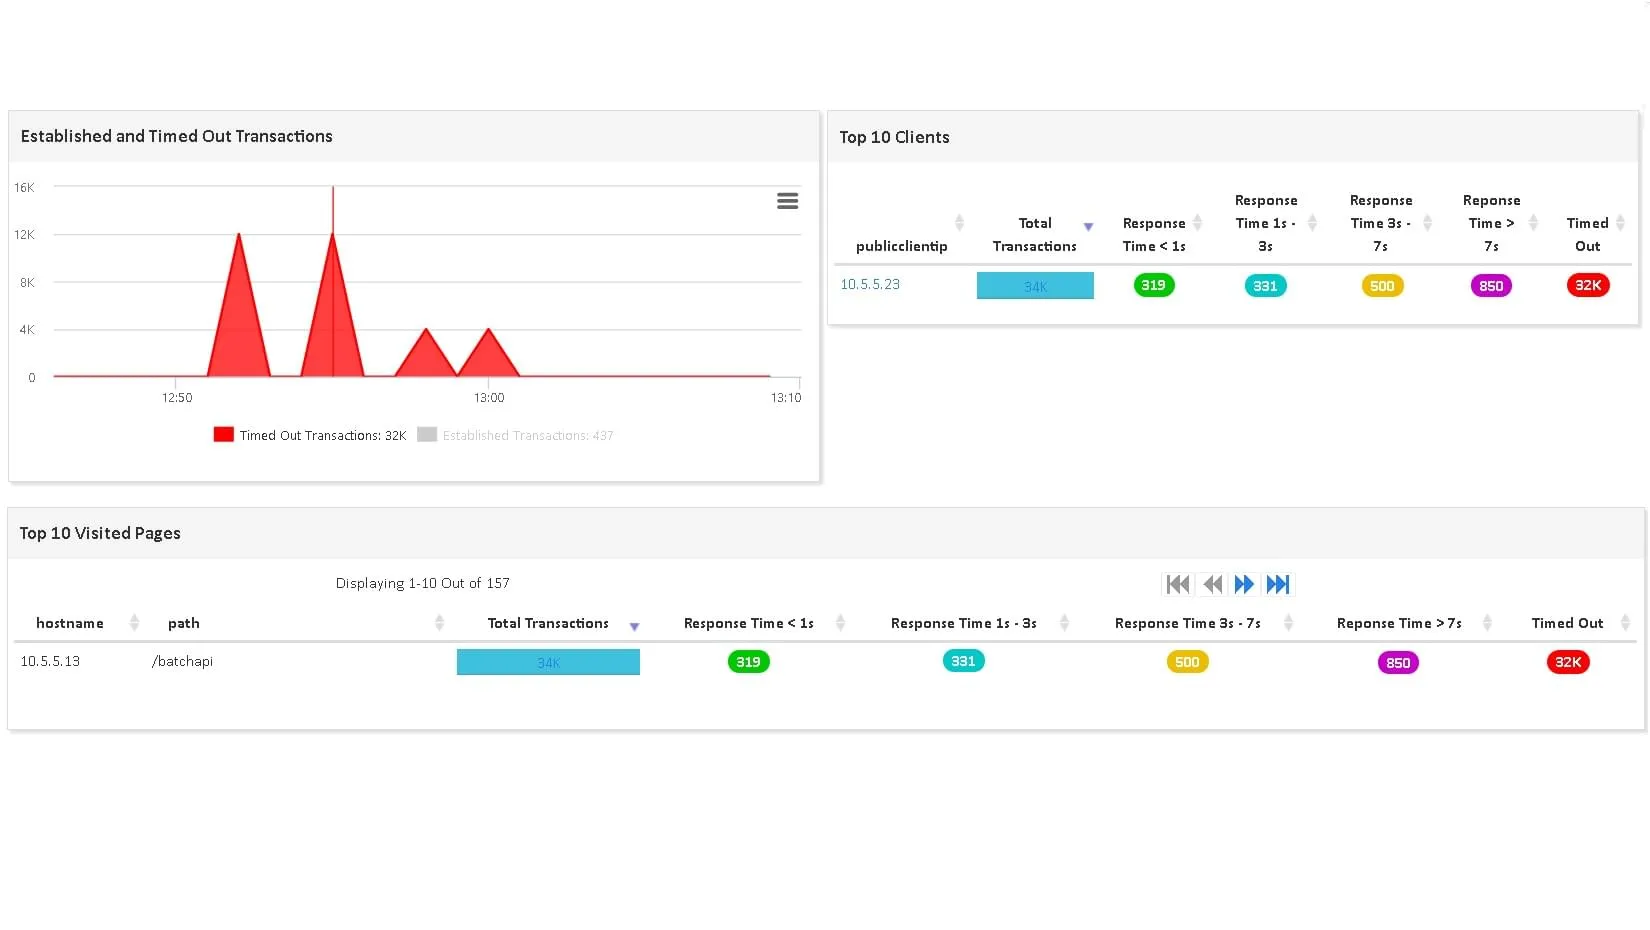
By capturing and analyzing IP packets on your application server's network interface, you can comprehend local or remote traffic per user and measure the response time of each transaction. This insight allows for transaction classification based on response time, identification of transactions slowing down the application and understanding which users are most impacted by delays. You can ensure that response time objectives and user satisfaction (APDEX) are met across desired geographic locations.
Consider a Software as a Service (SaaS) provider using ServicePilot to monitor and optimize their application performance. This allows them to quickly identify and address slow transactions, ensuring a high-quality user experience across all geographic locations.
- The primary benefit of this feature is the ability to quickly identify and troubleshoot slow applications
- You can meet your response time objectives and maintain high user satisfaction
Detection of Errors and Exceptions
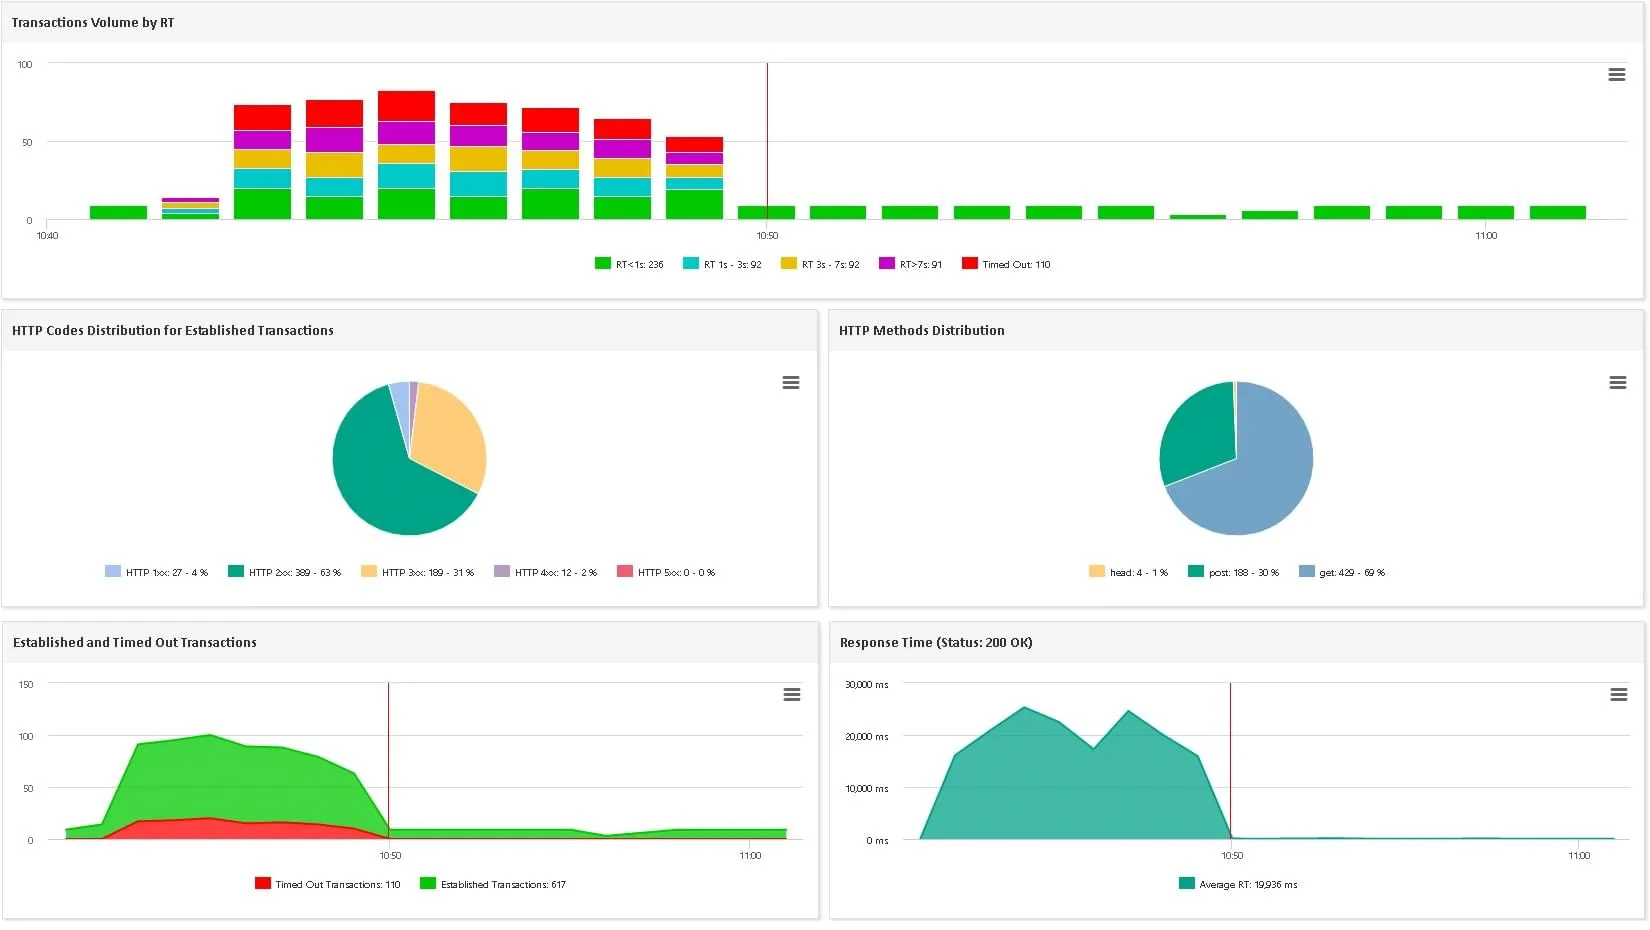
The ServicePilot Agent collects HTTP transactions from your applications, enabling the identification of a high number of transactions with response times exceeding the norm and timeouts. A simple click will give you a distribution of HTTP codes for established transactions, helping you understand the problems. Historical graphs and a search engine facilitate the analysis of recurring problems.
For example, an online retailer could use this feature to identify errors and exceptions in their web transactions. This insight allows them to quickly identify and resolve these issues, ensuring a smooth user experience.
- The benefit of this feature is the ability to quickly resolve errors and exceptions in your HTTP transactions
- It improves overall application performance and user satisfaction
The users of our applications and our web providers give us feedback on the performance, but we want to be able to get our own idea with objective indicators.
ServicePilot APM Transactions Monitoring
Web Transactions
HTTP transaction collection via a software probe on Windows, Linux server or a Raspberry PI
Application Traffic
Traffic analysis including transaction volume, response time, http codes, customer top 10, hostnames and visited pages
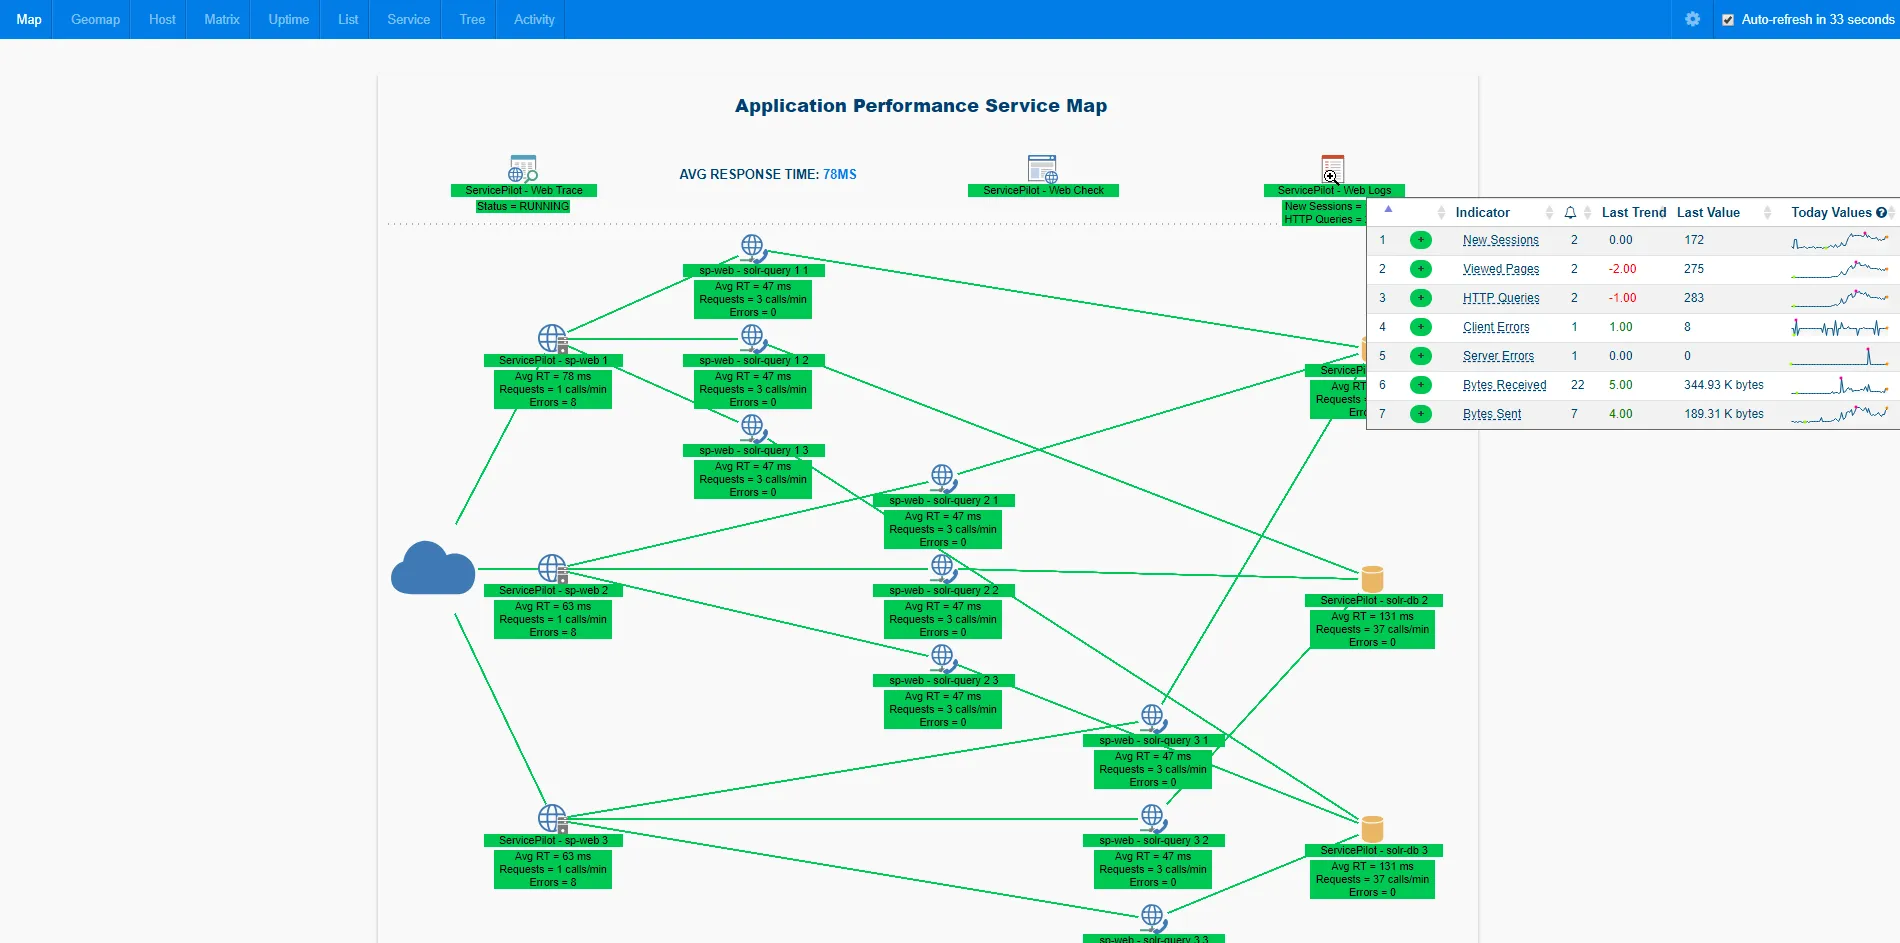
Local or Remote APM
Web application availability and performance analysis hosted in public or private Clouds
Detailed Insights
Transaction performance optimization to help prioritize issue resolution and respect the SLA
Application trace integration
Other Application trace Solutions
Free installation in
a few clicks
SaaS Plateform
- No on-premise software setup, servicing and configuration complexity
- Instant setup, complete and pre-configured to ensure robust monitoring
OnPremise Plateform
- Contracts and commitments over time ( > 1 year)
- Performance, Data Storage and Infrastructure Management
- 2 additional solutions: VoIP and Mainframe monitoring
