DevOps & SRE metrics: Golden Signals, USE and RED
Essential DevOps & SRE metrics: Golden Signals, USE and RED
Modern observability is no longer limited to collecting metrics: it involves modeling a system’s behavior, detecting deviations and correlating signals to drastically reduce MTTR. DevOps and SRE teams must rely on reliable, actionable and standardized metrics to ensure performance, availability and user experience.
This is where the Golden Signals, USE and RED frameworks come into play. Each provides a complementary lens for analyzing a system’s health. Combined with an observability platform like ServicePilot, they become a powerful tool for managing complexity.
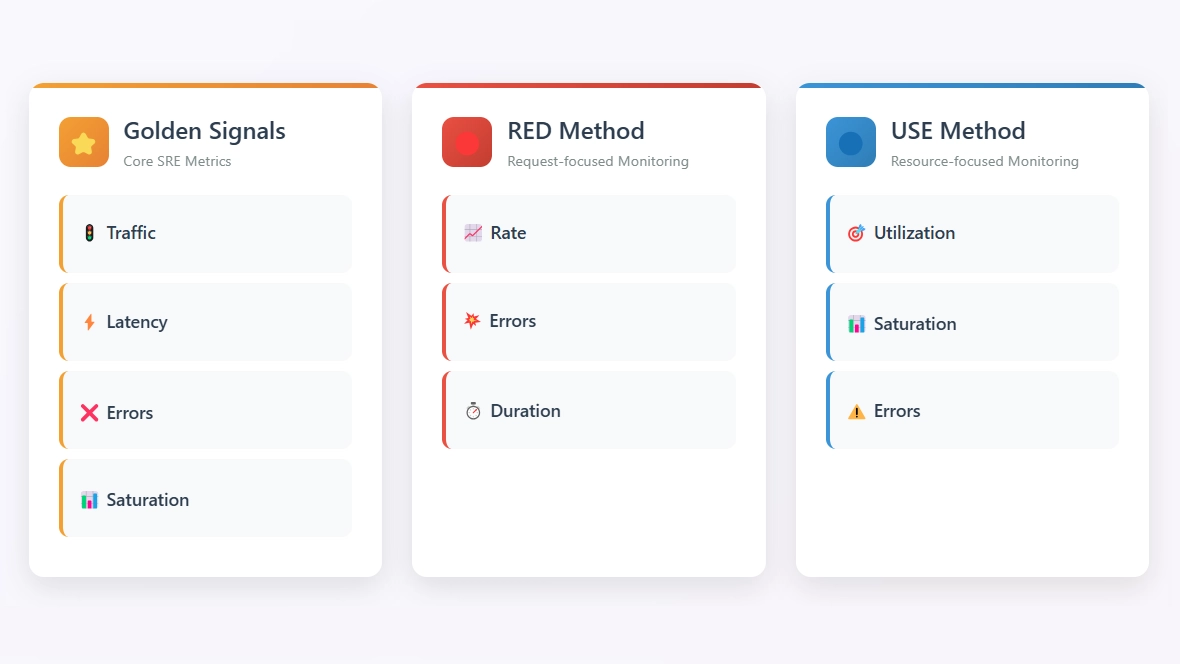
⭐ Golden Signals: The SRE foundation for monitoring services
Golden Signals are designed to measure the direct impact on the end user. They were popularized by Google SRE and define four essential metrics for any distributed service (latency, traffic, errors and saturation).
Latency: Response time as perceived by the user
Latency is the time it takes to process a request from start to finish. It is the service’s overall response time, as perceived by the user.
It is essential to distinguish between the latency of successful requests and that of failed requests. An HTTP 500 error can sometimes be returned very quickly, for example when a critical backend service is unavailable. Including these responses in overall latency statistics skews the analysis, because a quick error does not reflect good performance.
Conversely, a slow error is even more problematic, as it combines failure with a poor user experience. It is therefore essential to measure the latency of errors separately rather than simply excluding them from calculations.
Traffic: Request volume or service load
Traffic represents the pressure placed on a service and is measured using a metric appropriate to the type of system:
- For a web application, we generally use the number of HTTP requests per second.
- In an audio streaming service, relevant metrics may include network throughput or the number of concurrent sessions.
- For a SQL database, we would instead monitor the number of SQL transactions per second.
The goal is to choose a metric that accurately reflects the actual load.
Errors: Failure rate or incorrect responses
Errors correspond to the volume of requests that do not behave as expected, visible to the end user. They can be:
- Explicit, such as HTTP 5xx codes.
- Implicit, for example, an HTTP 200 response returning incorrect content.
- Defined by a business rule, for example, treating any response that exceeds a contractual time limit as a failure.
When protocol codes are insufficient to describe all failure scenarios, it may be necessary to add internal mechanisms to detect partial degradations.
The detection method varies depending on the type of error: a load balancer can easily detect HTTP 500 errors, but only an end-to-end test can identify incorrect content.
Saturation: Approaching a bottleneck
Saturation indicates how close a service is to its limits and highlights the most constrained resources. It can manifest as saturated thread pools, request backlogs, a full HTTP queue, etc.
In complex architectures, saturation can be supplemented by a capacity metric:
- Can the service handle twice as much traffic?
- Can it handle only 10% more load?
- Is it already struggling with the current load?
For very simple services, a load test result may be sufficient. But in most cases, we rely on indirect indicators such as CPU utilization or network throughput, which limits are known. An increase in latency, particularly the P99, is often an early indicator of saturation.
Saturation also involves the ability to anticipate problems, for example: “The current data volume indicates that the database disk will be full in four hours.”
🟦 USE: Ideal for troubleshooting infrastructure
The USE (Utilization, Saturation, Errors) framework, proposed by Brendan Gregg, is used to analyze system resources. It applies to all hardware resources to diagnose infrastructure issues.
Utilization: Percentage of resource usage
Utilization measures the proportion of time during which a resource is occupied:
- CPU utilization
- Read/write I/O throughput
- Used memory vs. allocated memory
- Network interface utilization
However, caution is needed:
- 100% CPU utilization is not always a problem (e.g., batch workloads).
- Low utilization can mask saturation (e.g., CPU waiting for I/O).
Saturation: The limits of a resource
Saturation represents the hardware limit of a resource and is the source of bottlenecks. It is often more critical than utilization. Golden Signals saturation is a functional saturation, related to the service’s ability to absorb the load, whereas USE saturation is a hardware-related saturation, linked to the hardware or the kernel, indicating that a resource can no longer keep up with demand.
Examples:
- CPU saturation with CPU run queue > number of cores
- Disk saturation with disk queue > 1
- Network saturation with TCP retransmissions
Errors: Hardware failures or anomalies
These are hardware or system errors:
- Disk errors (SMART)
- Network errors (dropped packets)
- Kernel panics
- OOM kills
🔴 RED: A model for microservices and APIs
The RED (Rate, Errors, Duration) framework, popularized by Prometheus, is a specialized version of Golden Signals, tailored for HTTP/gRPC APIs and microservices. It focuses exclusively on interactions between clients and services, making it a particularly effective tool for diagnosing performance issues in distributed architectures.
RED is often used in Kubernetes environments, Service Meshes (Istio, Linkerd), API Gateways or serverless applications.
Rate: Number of requests per second
Rate refers to the number of requests processed by a service over a given period. It is the primary metric for understanding the actual load placed on a microservice.
It should be measured in RPS (Requests Per Second) or QPS (Queries Per Second) and can be segmented by endpoint, HTTP method, tenant/client or workload type.
This is a critical metric because a sudden change in the Rate can indicate:
- An unexpected traffic spike.
- An issue with automatic scaling.
- A domino effect caused by an upstream service failure.
- An excessive retry loop (often invisible without RED).
Errors: Proportion of failed requests
Errors measure the proportion of requests that fail, whether due to explicit or implicit errors generated by a specific microservice.
There are several types of errors to distinguish:
- Protocol errors, such as HTTP 4xx or 5xx errors.
- Network errors, such as timeouts or TCP resets.
- Application errors, such as exceptions, validation failures or inconsistent responses.
- Dependency errors, such as those related to databases, caches or upstream services.
A stable but low error rate can mask a data consistency issue, a bug in a rarely used endpoint or a gradual degradation of a third-party service.
Duration: Request processing time
Duration refers to the time required to execute a request. It is often measured in percentiles (P50, P95, P99) using histograms. Unlike the latency of Golden Signals, this is the execution time of a specific endpoint, measured within the service itself.
Duration is often the first sign of a performance issue. An increase in P99 may indicate CPU saturation, database contention, a garbage collection issue, network latency or an overload in an upstream service.
📊 How ServicePilot unifies these frameworks
🔸 Golden Signals
Detects visible symptoms: latency, errors, saturation.
→ Ideal for alerting and providing a big-picture view.
🔸 USE
Identifies root causes: CPU saturation, slow disk, network congestion.
→ Perfect for diagnosing nodes, VMs and servers.
🔸 RED
Analyzes the internal behavior of microservices: slow endpoints, specific errors.
→ Essential for API-first architectures.
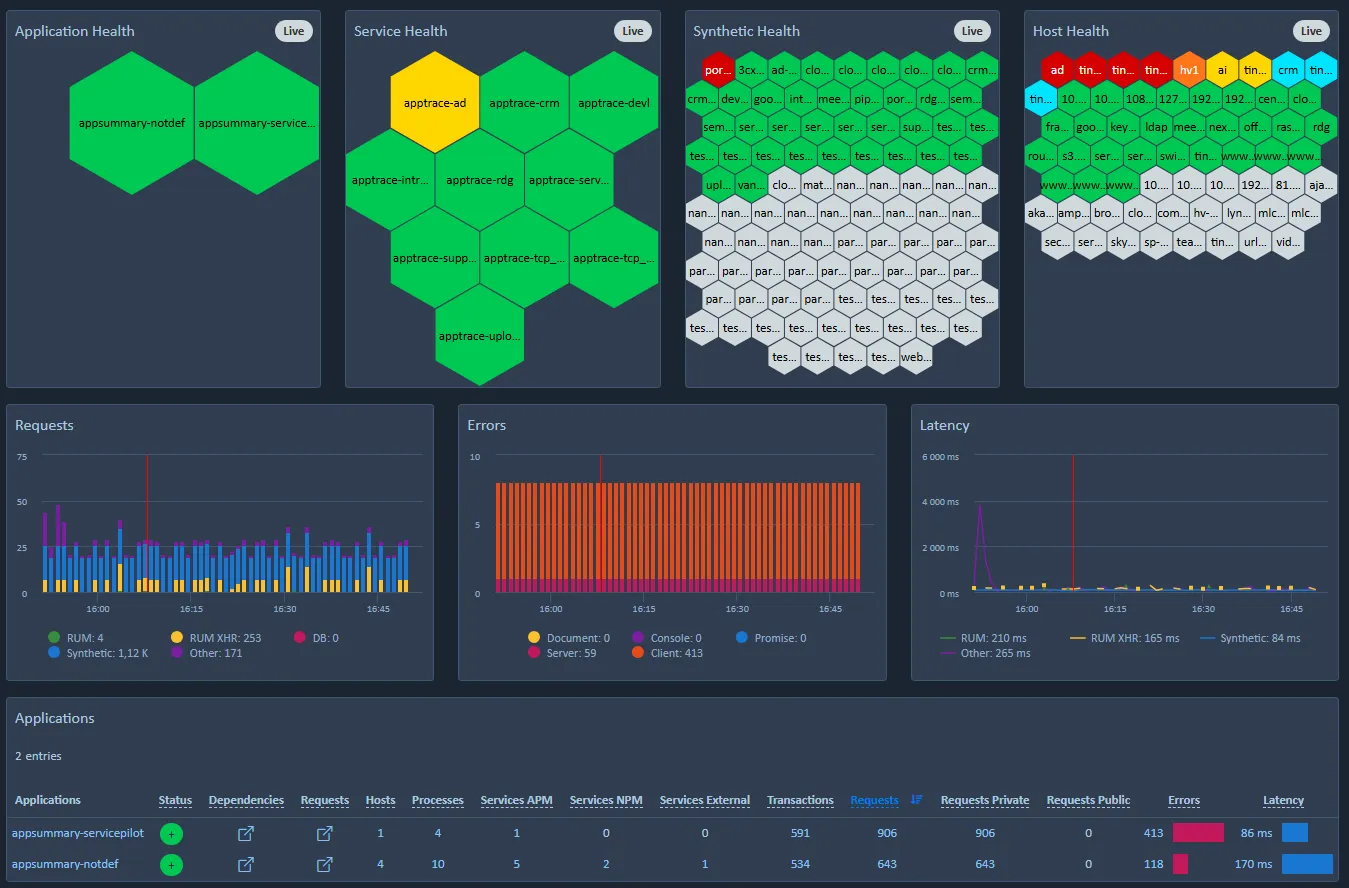
ServicePilot provides a comprehensive view by enabling you to centralize, correlate and visualize these three approaches in a single platform:
- Automatic collection of system, network and application metrics.
- Pre-built dashboards for Kubernetes, servers, databases and APIs.
- Alerting based on Golden Signals, USE or RED.
- Intelligent correlation between logs, metrics and traces.
- Anomaly detection powered by AI.
Conclusion: The power of structured observability
DevOps and SRE teams can no longer rely on isolated metrics alone. The Golden Signals, USE and RED frameworks provide a clear structure for understanding the health of modern systems and applications.
With ServicePilot, these DevOps/SRE frameworks become operational, correlated and actionable, enabling you to:
- Prioritize what really matters.
- Standardize dashboards.
- Speed up diagnostics.
- Align teams around a common language.
- Reduce MTTR through improved visibility.
