Instrumenting applications with OpenTelemetry and ServicePilot
What is OpenTelemetry?
OpenTelemetry emerged from the merger of two major projects: OpenTracing, focused on distributed traces, and OpenCensus, focused on metrics. The merger resulted in a single open standard that has been widely adopted by the industry.
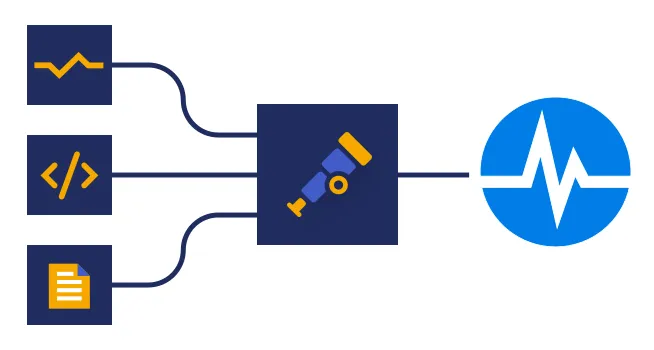
OpenTelemetry (OTel) is an open source project supported by the Cloud Native Computing Foundation (CNCF). It provides a set of tools, APIs and SDKs for collecting three essential types of signals:
- Metrics are numerical measurements such as the number of requests, latency and error rate.
- Traces represent the path a request takes through services. Each trace consists of a sequence of spans, corresponding to a specific operation or step in the processing. For example, a trace associated with a web request may include spans dedicated to authentication, database queries or response generation.
- Logs are textual events describing what is happening in the application, along with their temporal and informational context.
Building observability into applications is no longer just a best practice, it is essential for ensuring their maintenance, optimization and continuous improvement. It empowers developers to deliver reliable, high-performing applications while providing the insights needed to make informed decisions.
Why has OpenTelemetry become so popular?
The goal of OpenTelemetry is simple: to standardize applications' instrumentation and send the telemetry data to an observability backend. The framework stands out for its truly vendor-neutral approach: it offers APIs, SDKs and tools that are not tied to any proprietary ecosystem. Thanks to this neutrality, organizations avoid the risk of vendor lock-in and retain the freedom to choose their back-end observability solution.
Interoperability
OTel works with all the major tools on the market: ServicePilot, Prometheus, Jaeger, Grafana, etc.
Standardization
There is no longer a need to use a different SDK for each monitoring tool.
Flexibility
Applications can be instrumented automatically or manually, depending on your needs.
Rich Ecosystem
OpenTelemetry offers language-specific implementations of the API and SDK for several programming languages:
- .NET
- C++
- Go
- Java
- JavaScript
- Node.js
- Python
- PHP
- Ruby
- Rust, etc.
OpenTelemetry is increasingly being built-in natively to modern software. This trend stems from the growing need to provide out-of-the-box observability without complex configuration. Web frameworks, serverless platforms, container orchestrators and databases are beginning to expose traces, metrics and logs in the OpenTelemetry format right from the moment they are installed. This means teams no longer need to manually add instrumentation libraries: observability is becoming a standard component, built-in from the ground up. This trend will continue to accelerate, making OpenTelemetry a true universal language of telemetry and further simplifying integration with platforms like ServicePilot.
Key components of OpenTelemetry
The API defines the interfaces used to instrument the code independently of the backend used.
Language-specific SDKs allow you to use the OpenTelemetry API to generate telemetry data and export that data to a backend. These SDKs also provide the ability to integrate instrumentation libraries for common frameworks.
The OpenTelemetry Collector is a vendor-agnostic proxy that can receive, process and export telemetry data. It supports receiving telemetry data in multiple formats and sending data to one or more backends. It supports processing and filtering telemetry data before it gets exported. The use of a Collector improves scalability, allows services to offload data quickly and can take care of additional handling like retries, filtering, batching or encryption.
OTLP (OpenTelemetry Protocol) is the native protocol for transporting telemetry data. It supports all signals (traces, metrics, logs, profiles) in a single format, with two transport modes: gRPC or HTTP/protobuf. OTLP is the recommended format for SDK → Collector and Collector → backend communication.
How to instrument an application?
For a system to be observable, it must be instrumented: in other words, the code of the system’s components must emit signals, such as traces, metrics and logs. With OpenTelemetry, there are two main ways to instrument code:
- Auto-instrumentation (or zero-code), a solution that requires no code changes for certain specific languages
- Manual instrumentation, a solution based on developer inclusion in the code using official APIs and SDKs for most languages
Best practices recommend combining both approaches, starting with auto-instrumentation to immediately capture spans for HTTP calls, SQL queries and gRPC calls without modifying the code. Then, add manual instrumentation to critical business operations (payment, order creation, authentication, etc.) to capture manual spans with business attributes relevant to troubleshooting.
In addition to instrumenting the applications themselves, OpenTelemetry provides instrumentation libraries for many third-party components that expose their data in the OpenTelemetry format. For example, it is possible to collect MySQL Enterprise Server command traces, metrics on Claude Code usage or Argo Workflows telemetry. The OpenTelemetry Registry provides a searchable database of instrumentation libraries, collector components and other useful projects in the OpenTelemetry ecosystem.
Golden Signals and their use with OTel & ServicePilot
In the field of observability, not all signals are created equal. To quickly understand a system’s health, SRE and DevOps teams have long relied on a fundamental concept: Golden Signals. Popularized by Google in the context of SRE, these four key indicators make it possible to diagnose the health of a service in a matter of seconds. Thanks to OpenTelemetry and ServicePilot, it becomes possible not only to collect these signals automatically, but also to analyze them, correlate them and trace them back to the root cause in a minimum amount of time.
Golden Signals: the essential foundation for understanding services
There are four Golden Signals:
- Latency: the time required to process a request
- Traffic: the volume of requests received by the service
- Errors: the rate of failed or incorrect requests
- Utilization: the level of resource usage (CPU, memory, threads, etc.)
These signals form the basis of any effective observability strategy. They enable you to immediately answer essential questions:
- Is the service slow?
- Is the service overloaded?
- Is the service returning errors?
- Does the service have the resources it needs to function optimally?
Without these indicators, analysis becomes longer, more complex and often less accurate.
Golden Signals visible in 5 seconds in ServicePilot
Thanks to the OpenTelemetry + ServicePilot integration, Golden Signals are automatically collected and displayed in ready-to-use dashboards. As soon as a service starts sending traces and metrics, ServicePilot generates a summary view that lets you understand the system’s status in less than five seconds:
- A graph showing average latency and the P95 percentile
- A traffic graph showing the number of requests
- A graph showing errors and the error rate
- Easy access to data from the underlying infrastructure
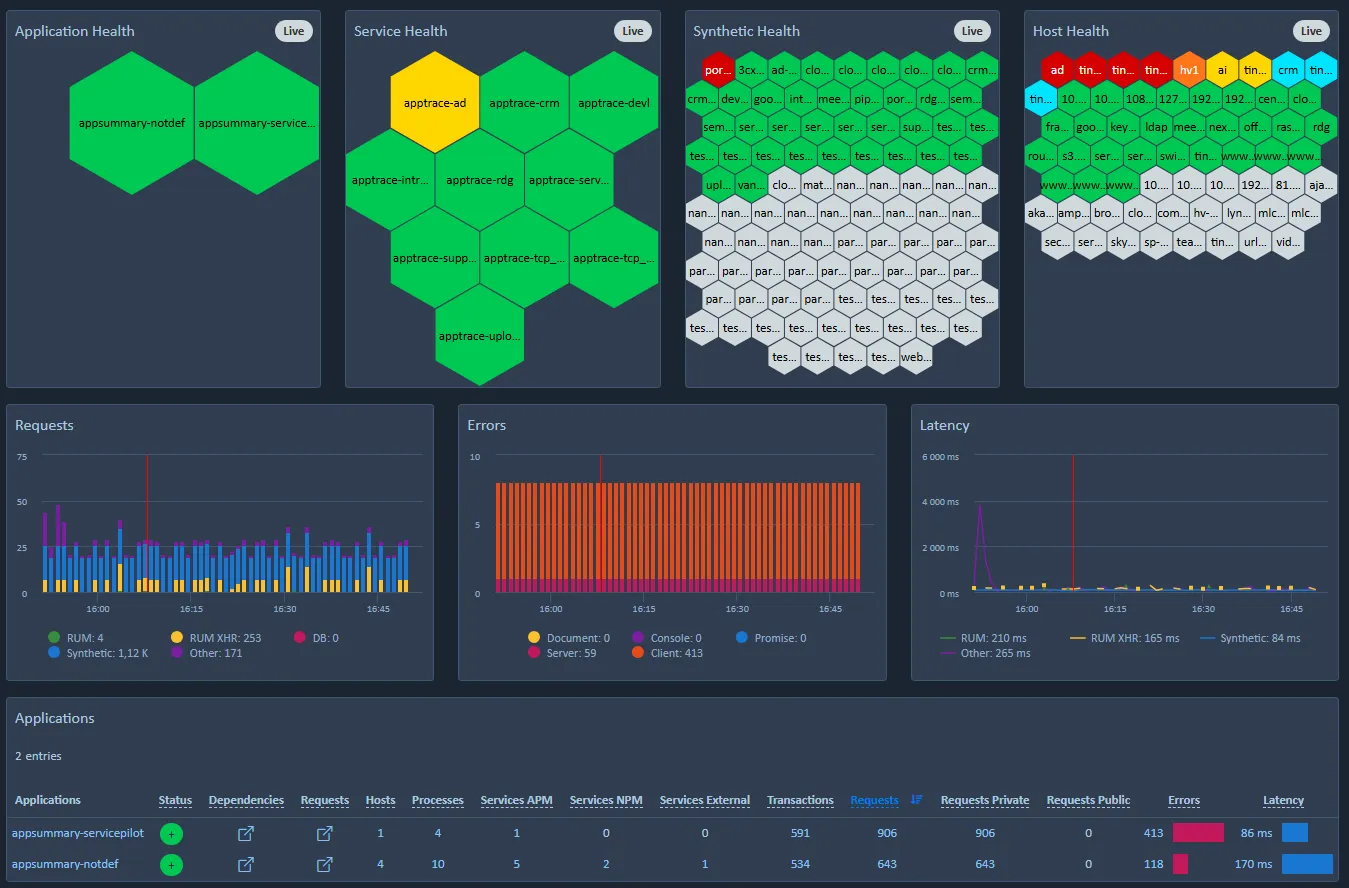
A table consolidates these three metrics (latency, traffic, errors) by application, service or URL to summarize all this information in a single widget. This immediate visibility lets you know instantly whether a service is healthy or requires further investigation.
Drill-down: from the big picture to the details of a request
One of ServicePilot’s major advantages is the ability to switch from the macro view to the micro view with a single click. Starting from an abnormal Golden Signal (such as high latency), you can:
- Click on the affected service
- Open the list of associated traces
- Identify the slowest requests
- Explore their detailed waterfall charts
This quick drill-down helps you understand not only that there is a problem, but also where it is located: in an external call, a SQL query, a downstream microservice or a specific business function.
RCA: finding the Root Cause using correlation
Identifying a problem is one thing. Understanding why it occurs is another. ServicePilot excels at automatically correlating traces, logs, metrics and the underlying infrastructure.
Real-world example:
- Abnormal latency is detected
- A slow trace can be opened
- The waterfall chart shows a particularly long SQL call
- The correlated logs display a database connection error
- Infrastructure metrics show CPU saturation on the SQL server
In just a few clicks, you have reconstructed the entire causal chain.
Golden Signals are not just about applications. They must be viewed in the context of container status, Kubernetes cluster performance, database health, network resources and the cloud services in use. ServicePilot lets you visualize this entire chain in a single interface, making it easier to analyze the root cause and understand the system as a whole.
OTel + ServicePilot for a simplified observability
OpenTelemetry collects raw data. ServicePilot serves as a unified observability backend to analyze this data. Together, they provide a comprehensive observability solution.
Native integration: ServicePilot natively supports HTTP/OTLP, which simplifies configuration and enables automatic data export.
Signal Correlation: data is unified and presented clearly to enable correlation between signals (distributed traces, metrics, logs).
Interfaces and Features: dashboards, alerts, PDF reporting, maps, monitoring dashboards, capacity planning, etc.
Scalability: ServicePilot can ingest large volumes of data without complex configuration.
Time savings: this allows you to focus on analyzing and resolving incidents instead of wasting time configuring and maintaining four additional software applications.
Instrumentation is an essential pillar of modern observability. OpenTelemetry offers an open, flexible and powerful standard for collecting data. By combining it with ServicePilot, you gain a comprehensive platform to visualize, analyze and optimize your application performance.
Whether you are a developer, DevOps professional, SRE engineer, or system administrator, the OTel + ServicePilot integration will help you improve the reliability and performance of your services while simplifying your daily workflow.
