How to create custom cockpits for IT governance
Why "cockpits" are essential for IT management
Enterprises must manage increasingly complex IT systems: hybrid infrastructures, microservices, distributed networks, application dependencies, growing availability requirements, security and more. In this context, having a clear, prioritized and contextualized view of your IT infrastructure is no longer an option, it is a necessity.
This is precisely where ServicePilot’s custom cockpits become a strategic asset. They enable the transformation of a mass of technical data into operational views, tailored to each role, scope and business challenge.
Understanding the key concepts of ServicePilot
Views and subviews: structuring the IT system
In ServicePilot, views form the foundation of any information system representation. They offer the opportunity to model and organize the information system according to a logic that aligns with your operational reality. Views allow you to:
- Structure the information system by layers: network, servers, applications, business services
- Create logical groupings: by site, by environment, by technology
- Isolate sensitive areas: production, security, cloud, etc.
- Navigate from the big picture to the details thanks to a clear hierarchy
Subviews allow you to go further by creating a tree structure and "navigate" through the information system naturally. Each subview can contain:
- Resources with monitored objects
- Other subviews
- Metrics in the form of metadata with tables or counters
- Maps or architecture diagrams, notes, links, graphical elements and more
Subviews play an essential role in readability: they break down complex architectures into coherent sets, each providing a focused view of a functional or technical scope. This also facilitates the distribution of responsibilities and the segmentation of security, as each team can access only the areas that concern them.
Metadata: enriching information
Metadata are visual and contextual representations of data derived from an object, a view, or a resource. They enrich monitoring by adding a layer of interpretation that facilitates the reading of statuses, service levels, or key metrics.
By integrating this metadata into views, it becomes possible to create dynamic cockpits capable of reflecting the health of the IT infrastructure in real time, highlighting priorities and accelerating diagnostics.
Graphical elements: improving readability
Graphical elements and HTML constitute the visual layer of the cockpits and make the information easier to use. Thanks to them, it becomes possible to combine the state of the IT infrastructure with maps, diagrams, interactive topologies or even fully customized HTML visuals.
This design flexibility allows teams to create cockpits that are not only informative but also visually appealing, easy to read and engaging. A well-presented cockpit improves understanding, reduces analysis time and facilitates decision-making.
By combining HTML, images and icons, teams can create a true common visual language shared among technicians, operations managers and business leaders. They become more than just a monitoring tool: they become a clear, intuitive, accessible management interface tailored to each role.
Example: building a cockpit for a business application
Without writing a single line of code and thanks to an intuitive interface, you can simply drag and drop views, insert resources, add graphical elements and integrate metadata to structure a view as you envision it. This no-code visual approach speeds up the design process: in just a few minutes, you can assemble a clear, visually appealing cockpit that is perfectly tailored to a specific scope.
Here is a typical approach for a critical application:
- Create a main view representing the application or the scope to be monitored.
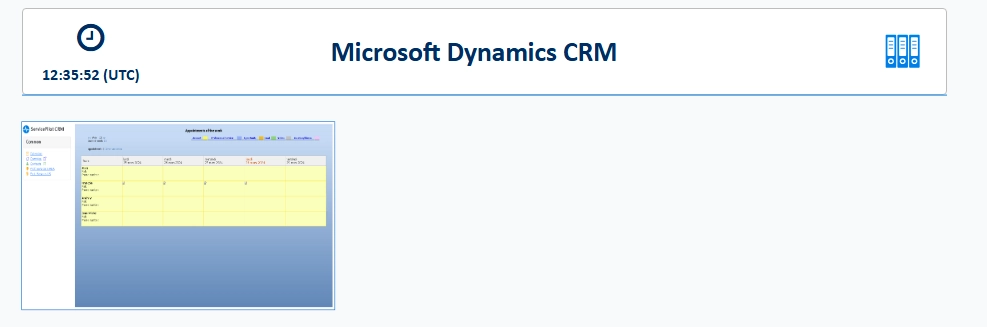
You can modify the graphical representation if necessary. In the following example, a HTML frame can be created with an icon and a title:
<div class="card" style="border: 1px #BDBDBD solid;width: 100%;height: 100%;">
<div class="card-body text-center" style="padding-top: 10px;">
<h4 class="card-title"><img class="" src="archive-business.svg" style="max-width:16px;max-height:16px;margin-right:5px;"><strong>CRM & Billing</strong></h4>
</div>
</div>

The appearance of the view can be changed using the "Text" visual.

The view can be overlayed on the created frame to get the following result.

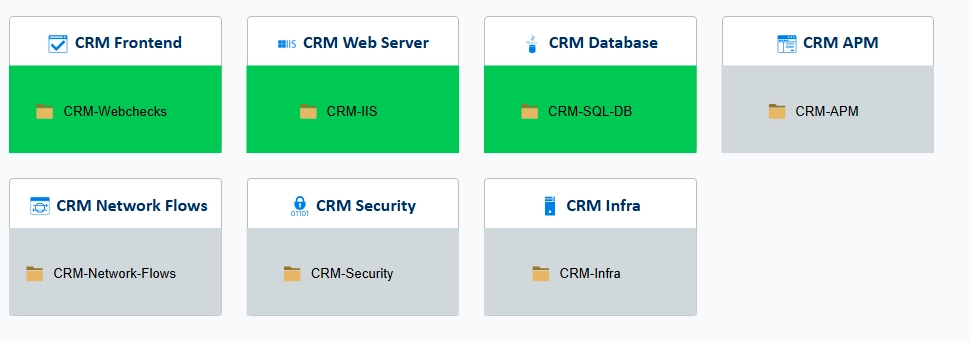
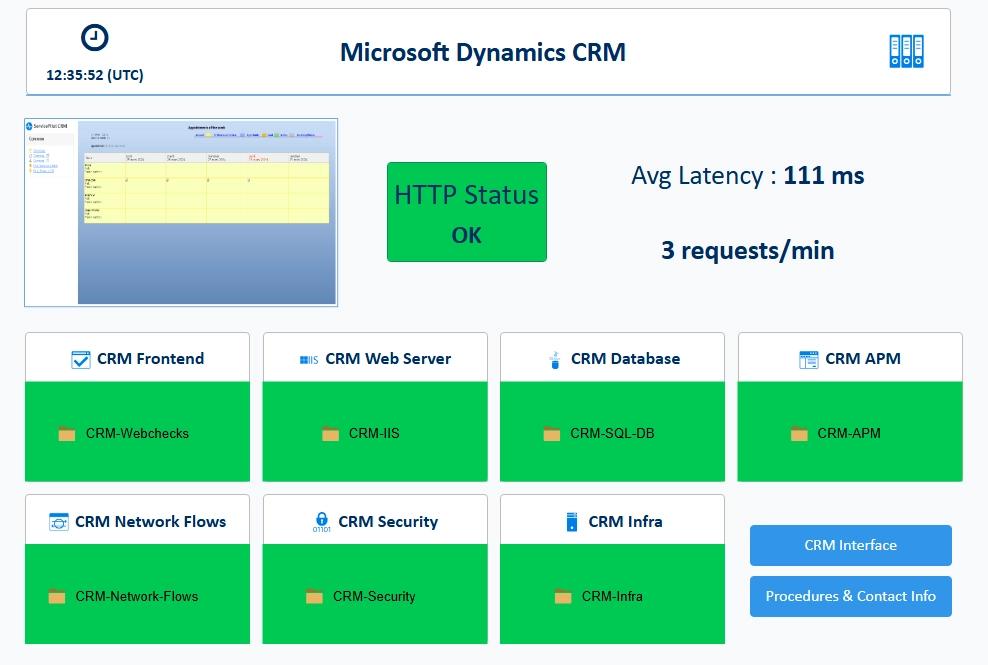
- Add subviews for each layer you want visibility into:
- Frontend
- Database
- Infrastructure
- Security, etc.
-
Add the resources to be monitored in each subview. For example, synthetic tests in one view, web server application testing in another, the database and specific SQL query tests in the database view, the server or servers in the infrastructure view, and so on.
-
Add visual elements. You can include links to other interfaces, tools, titles or notes containing information.
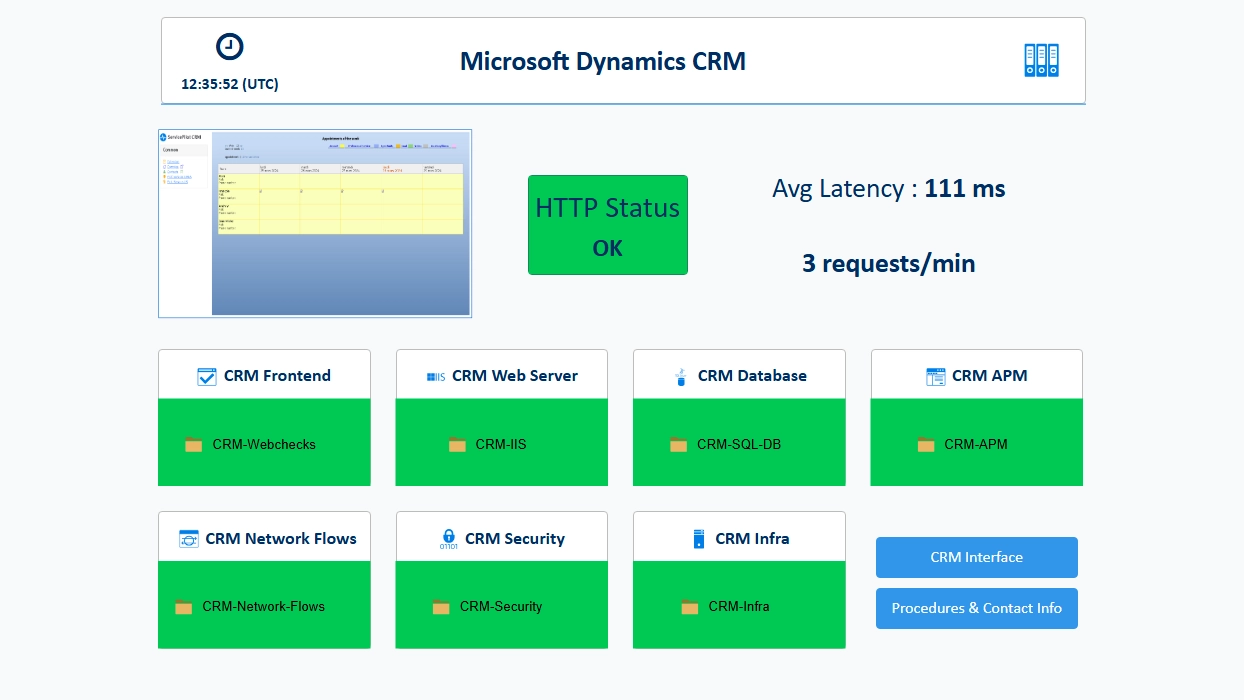
- Add metadata to highlight key KPIs: availability, response time, errors, etc.
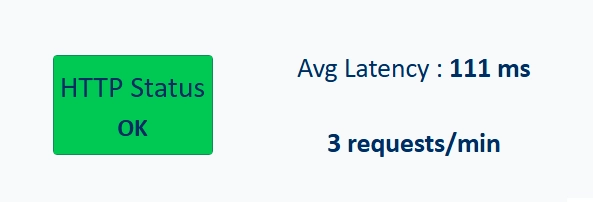
Result: a comprehensive, easy-to-read and actionable cockpit.
The cockpit: a strategic tool beyond IT
With ServicePilot, creating a custom cockpit is quick and easy. The interface lets you put together a clear, efficient view that is perfectly tailored to your needs in just a few minutes.
A customized and well-organized cockpit allows you to:
- Prioritize critical IT system components
- Map technical and application dependencies
- Contextualize alerts to understand their real-world impact
- Tailor monitoring to the needs of each team (network, infrastructure, DevOps, management, etc.)
- Speed up diagnostics to reduce MTTR
A cockpit is not just a dashboard, it is a control interface and command center for IT oeprations.
In a modern IT environment, monitoring should no longer be limited to collecting metrics, it should enable understanding the impacts, managing and making decisions. ServicePilot’s customizable cockpits offer exactly that: a simple, powerful and flexible way to transform IT complexity into a clear and actionable view.
