What is an Application Host?
An Application Host (AppHost) refers to the environment or platform where an application is deployed and runs. It provides the necessary infrastructure and resources for the application to operate effectively.
The application host can take different forms depending on the specific requirements and context. It can be a physical server, a virtual machine, or a cloud-based platform. The choice of the application host depends on factors such as scalability, performance, availability, and cost-effectiveness.
The application host typically includes the underlying operating system, runtime environment, and any necessary dependencies or libraries required by the application. It provides the resources like computing power, memory, storage, and network connectivity for the application to function optimally.
How to monitor an Application Host?
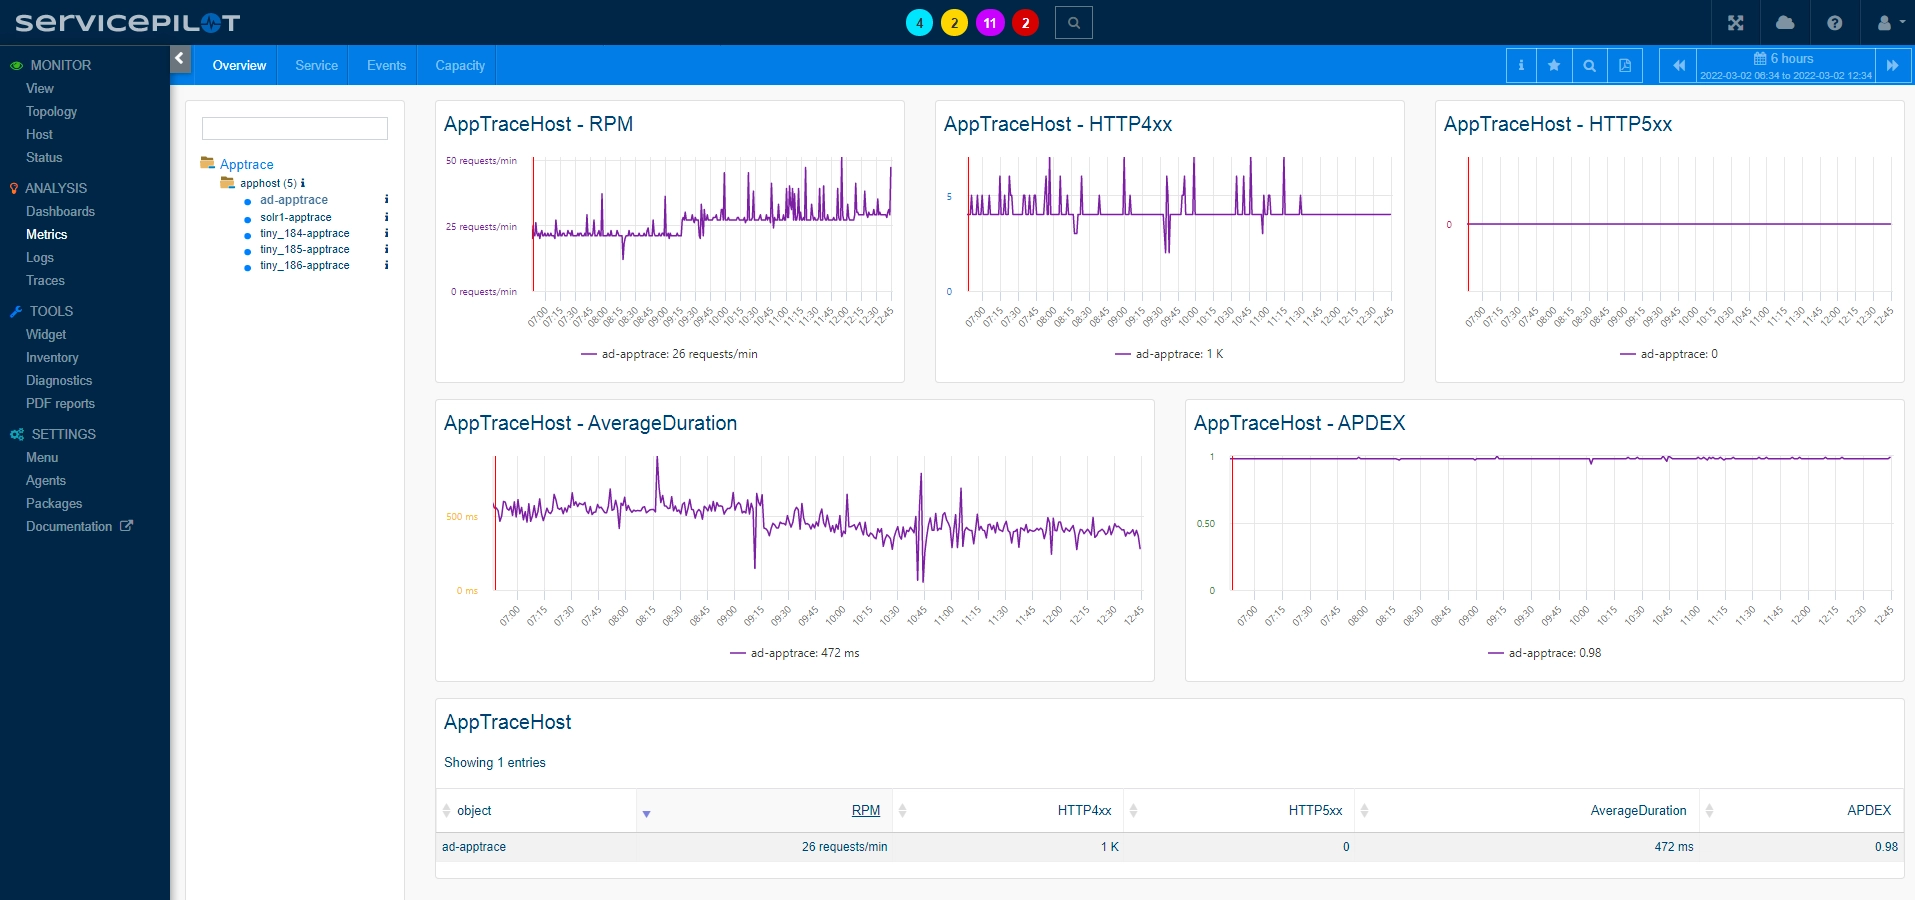
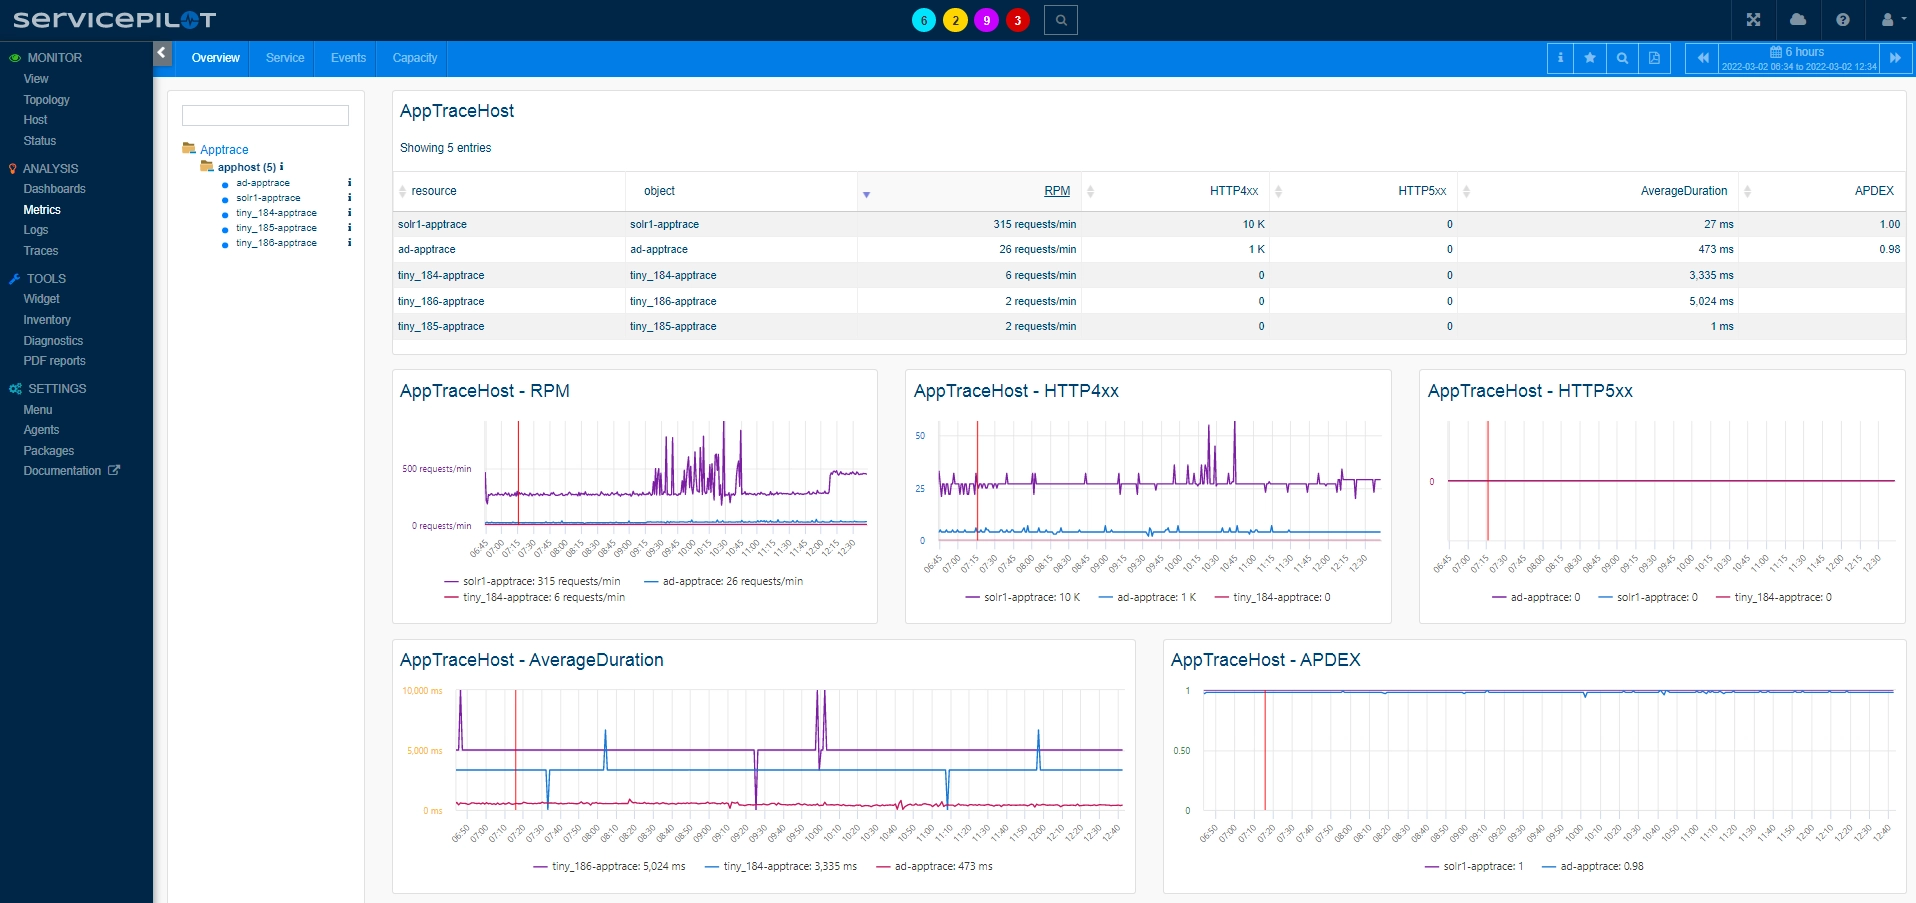
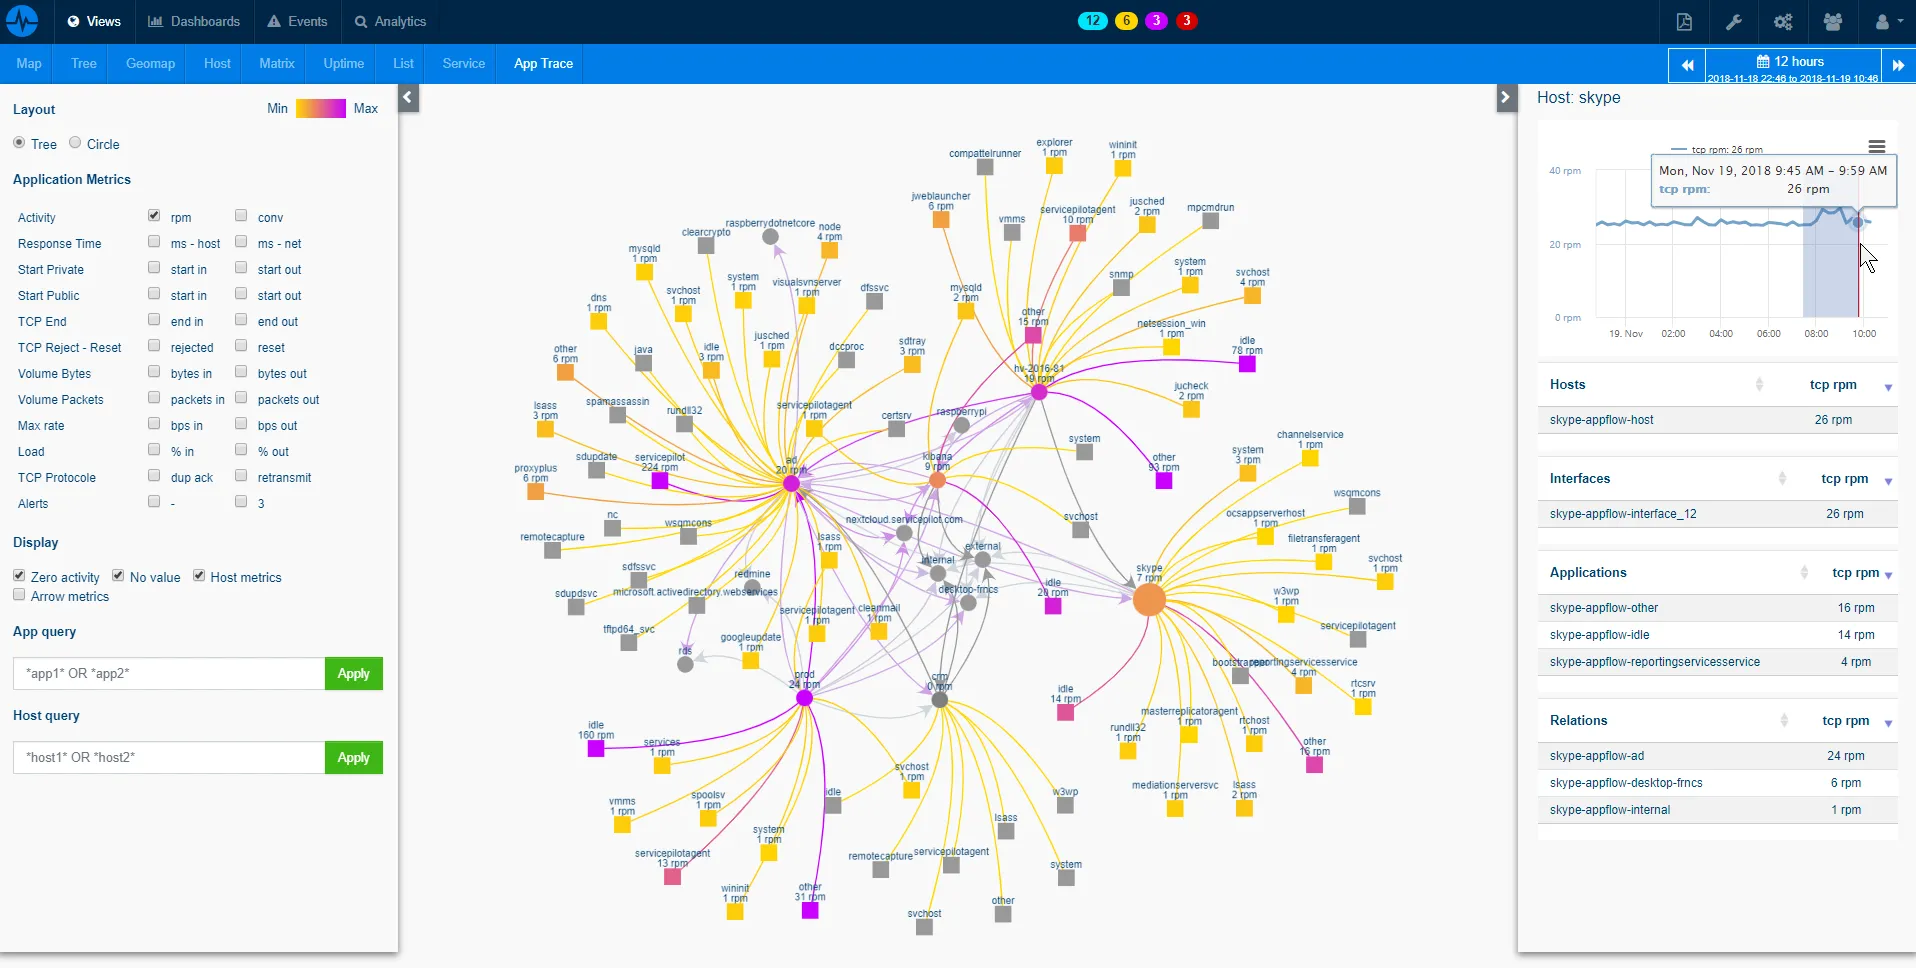
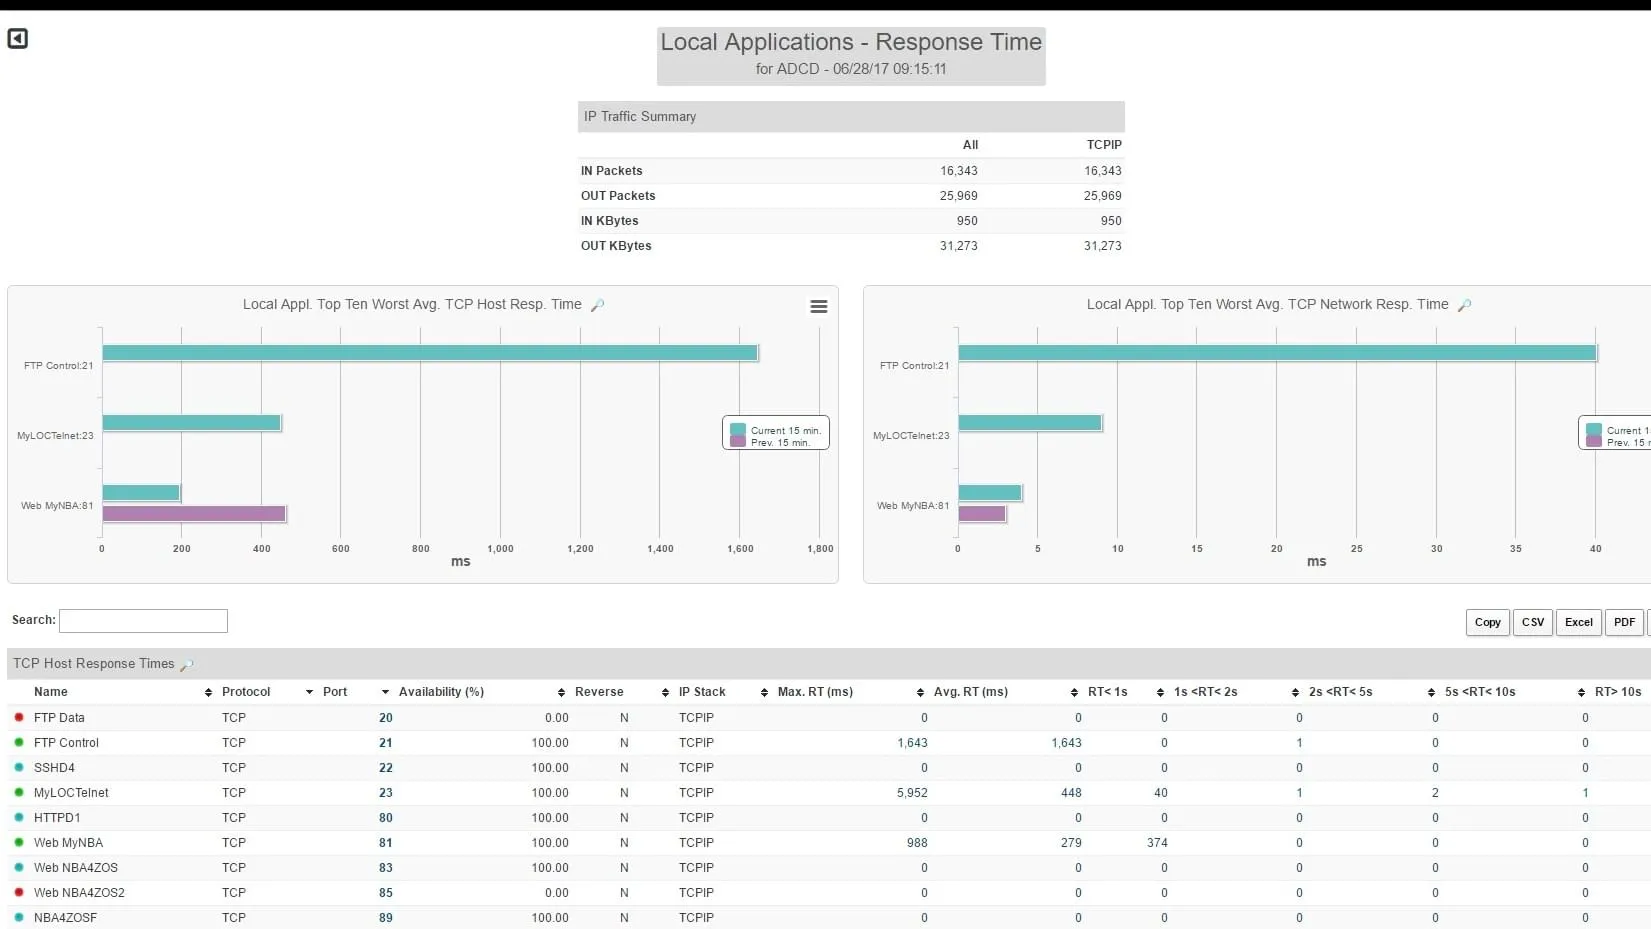
ServicePilot makes it very easy to monitor a application host. Simply install a Windows/Linux ServicePilot agent and add an auto-provisioning rule via the ServicePilot web interface. ServicePilot will then automatically discover and monitor applications running on the hosts. Statistics will then be collected and aggregated to be sent to ServicePilot. These are then automatically classified into apptrace-apphost resources for each application host.
The summarized statistics (min,max,average...) collected per host include:
- Requests per minute
- Sum of requests by HTTP return codes and methods
- Number of requests in each response time range
- Established vs. Timed-out requests
To provide detailed information, the details collected per application and per request with the apptrace-appservice-nodejs packages, apptrace-appservice-dotnet packages, apptrace-appservice-java packages or apptrace-appservice-generic packages are:
- Host and web page path
- Server and client IP
- Real User Response time
- HTTP Return code and method
- Client country and geolocation for public IPs
How to install a apphost resource?
- Use your ServicePilot OnPremise installation or a SaaS account.
- Add a new apphost resource via the web interface (
/prmviewsor/prmresources) or via API (/prmpackagespage), the default ServicePilot agent or another agent will be provisioned automatically.
Details of the apphost package are located in the
/prmpackagespage of the software.
Benefits
ServicePilot enables you to deliver IT services faster and more securely with automated discovery and advanced monitoring features.
By correlating the technology APPHOST with APM and infrastructure monitoring, ServicePilot is able to provide a more comprehensive view of an organization's IT environment.
This allows IT teams to quickly identify and diagnose issues that may be impacting application performance, and take corrective action before end-users are affected.
Start with a free trial of our SaaS solution. Explore our plans or contact us to find what works best for you.