What are server application flows?
Technological environments have evolved with the rise of microservices, containerized apps, different programming languages and their dependencies. Monitoring products relying on logs or "trace profiling" no longer cope with production application of increasing complexity and massive amounts of logs or traces to analyze. Application architecture and code shifts over different network hops and layers make it hard for DevOps and Production engineers to grasp precise and standardized application performance host visibility, especially in the case of ephemeral instances and underlying infrastructure.
Despite language, framework or application topology changes, the network layer remains the fundamental layer on which applications converge, regardless of an application's complexity and heterogeneous stack.
With this in mind, ServicePilot has designed a package to summarize Server Interface Flow statistics collected from a single interface, in order to identify any application activity or suspicious behavior on the specified server interface.
It allows automatic:
- Monitoring of the Server System metrics
- Retrieval of detailed metrics for each interface
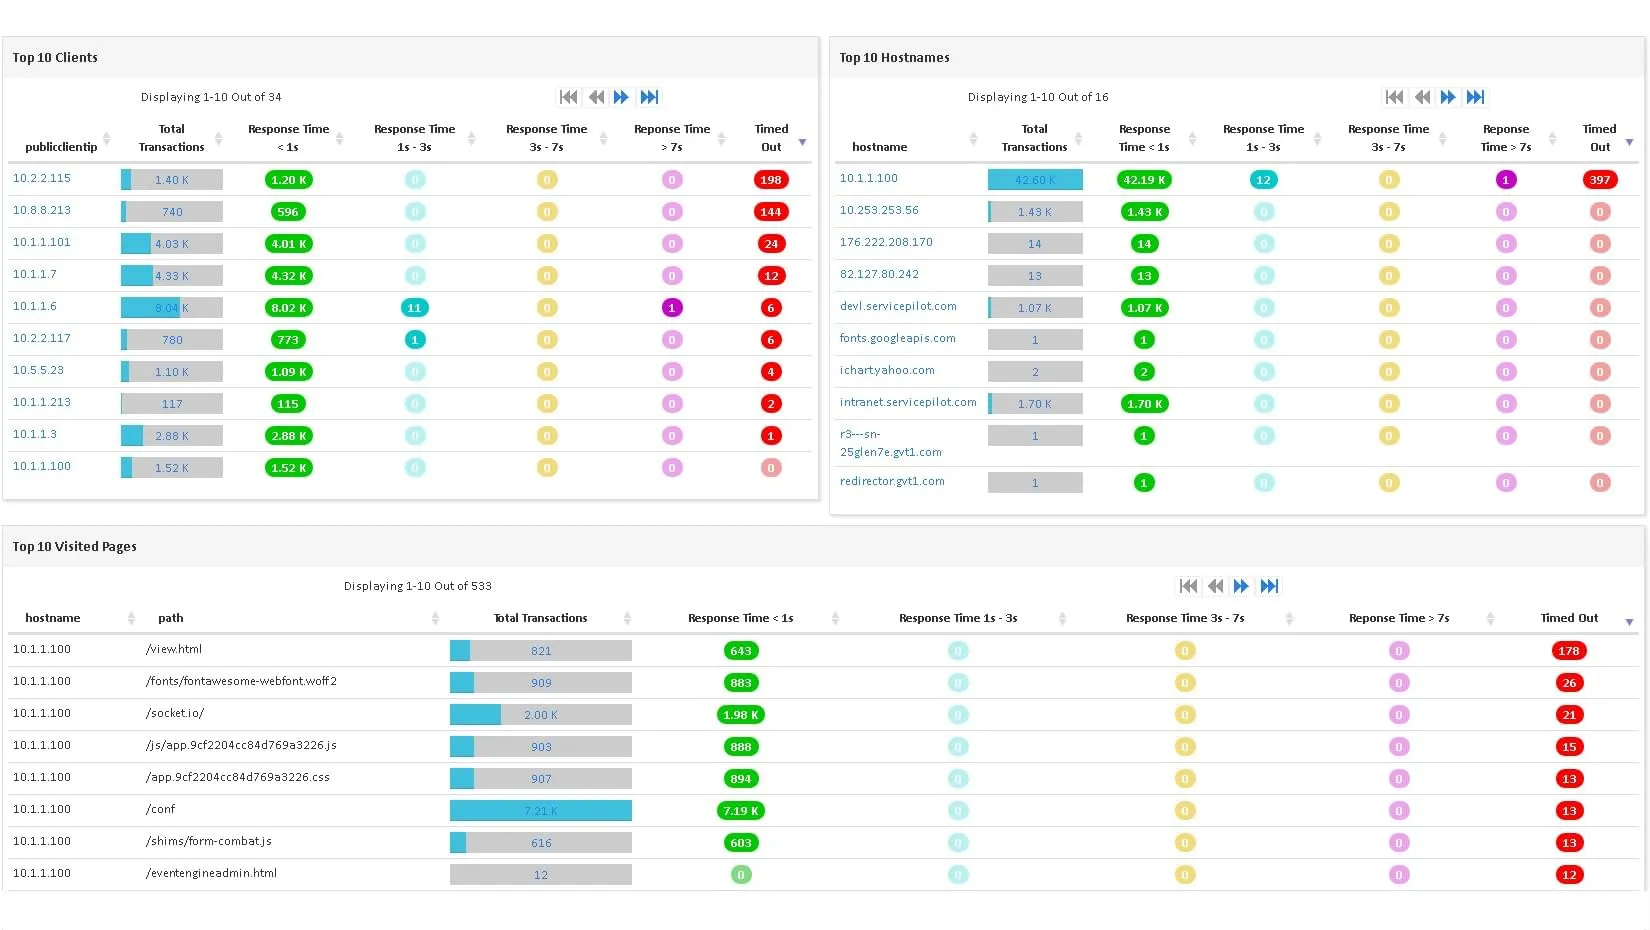
- Analysis of global host traffic
- Discovery and monitoring of all your applications
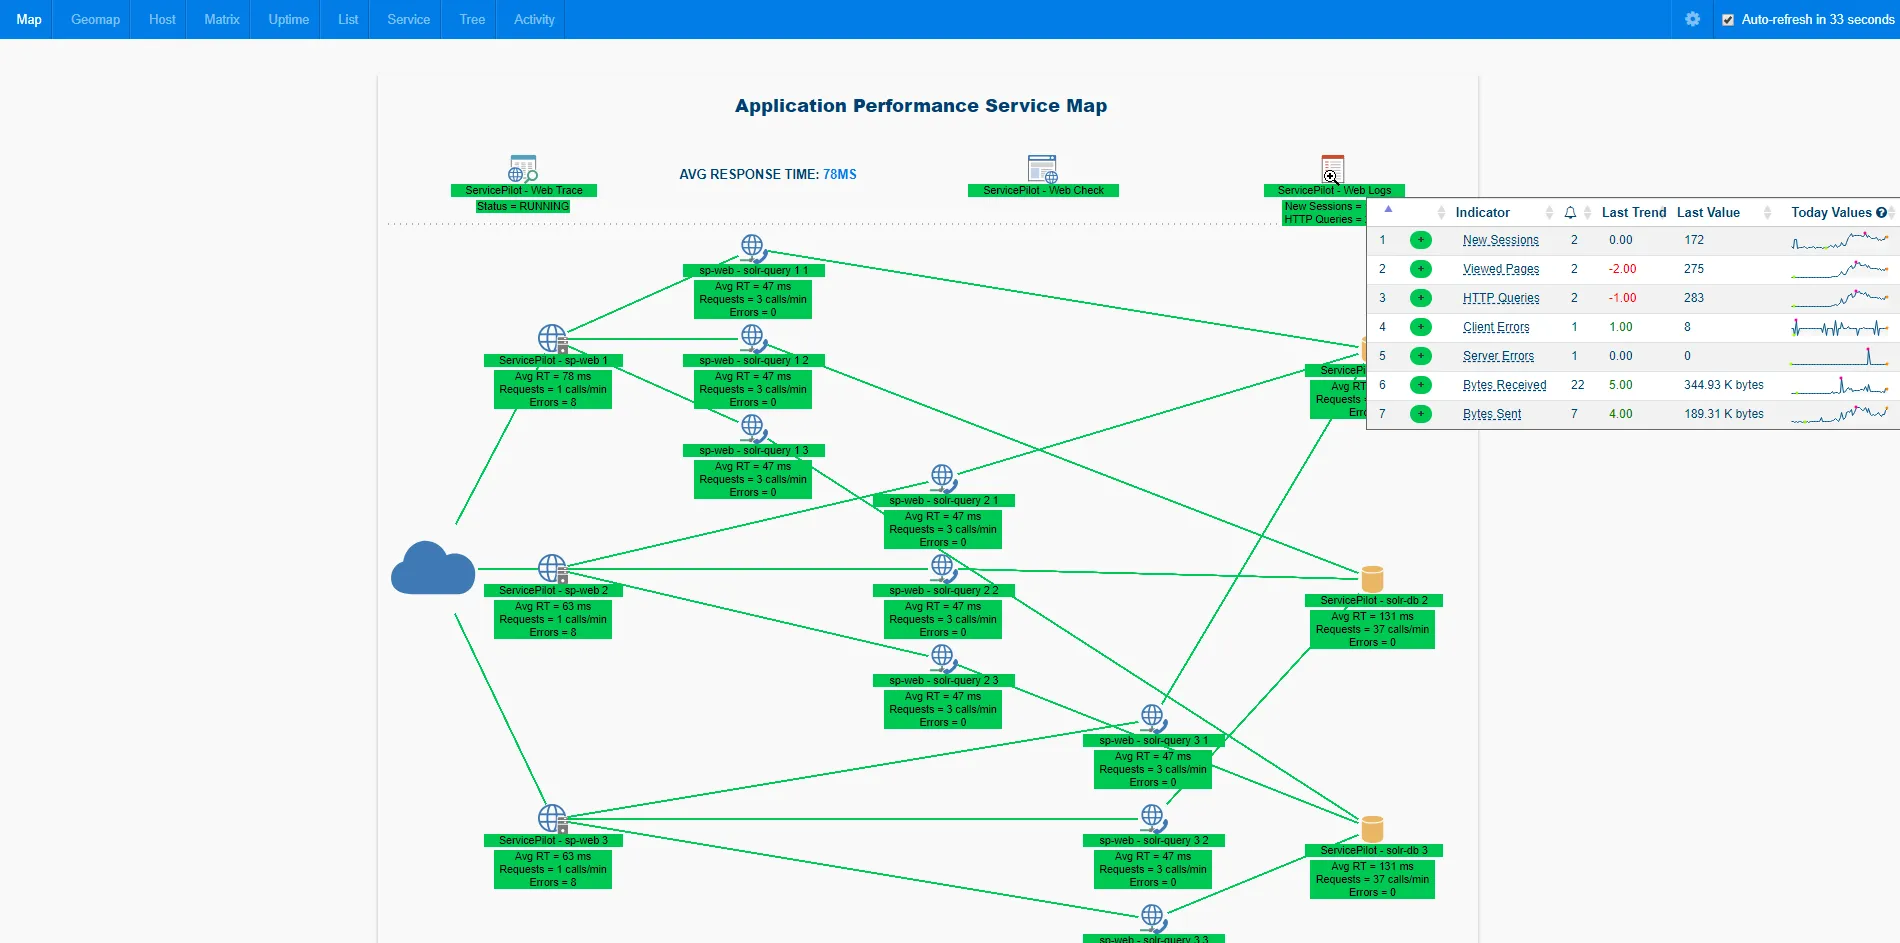
- Creation of infrastructure and application service maps
As a result, the ServicePilot NetTrace NetHost package and its agent can be installed, providing engineers immediate automated APM value without any changes to production application code.
How to monitor server application flows?
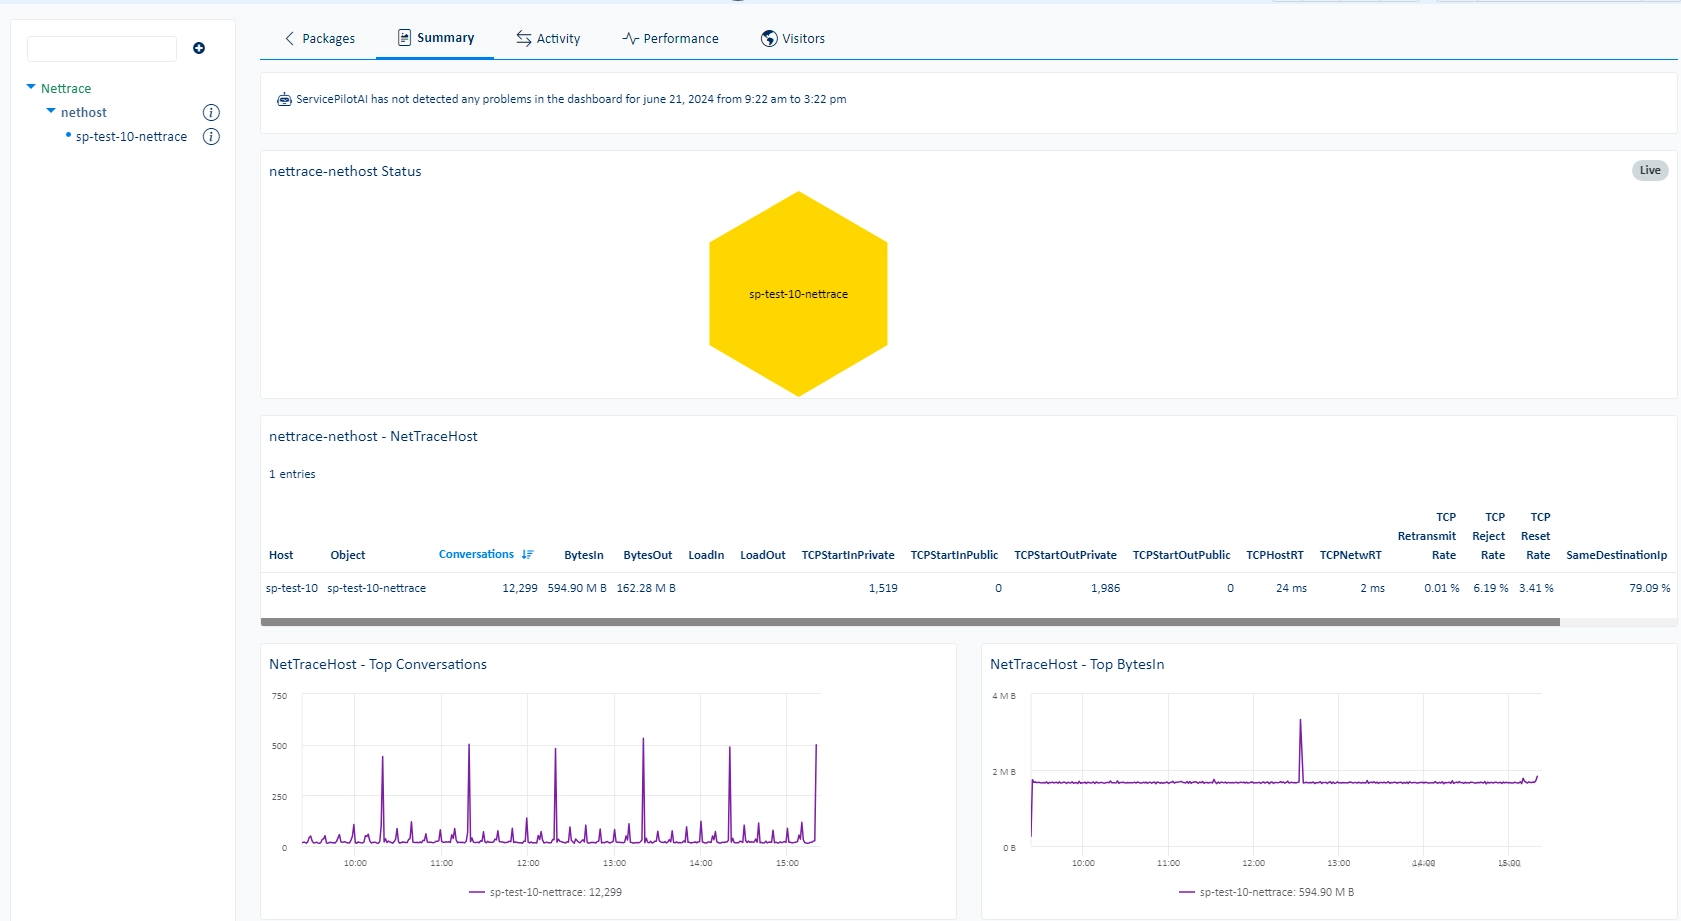
The nettrace-nethost package, based on collection made by the ServicePilot Agent, gets aggregated statistics for network flows.
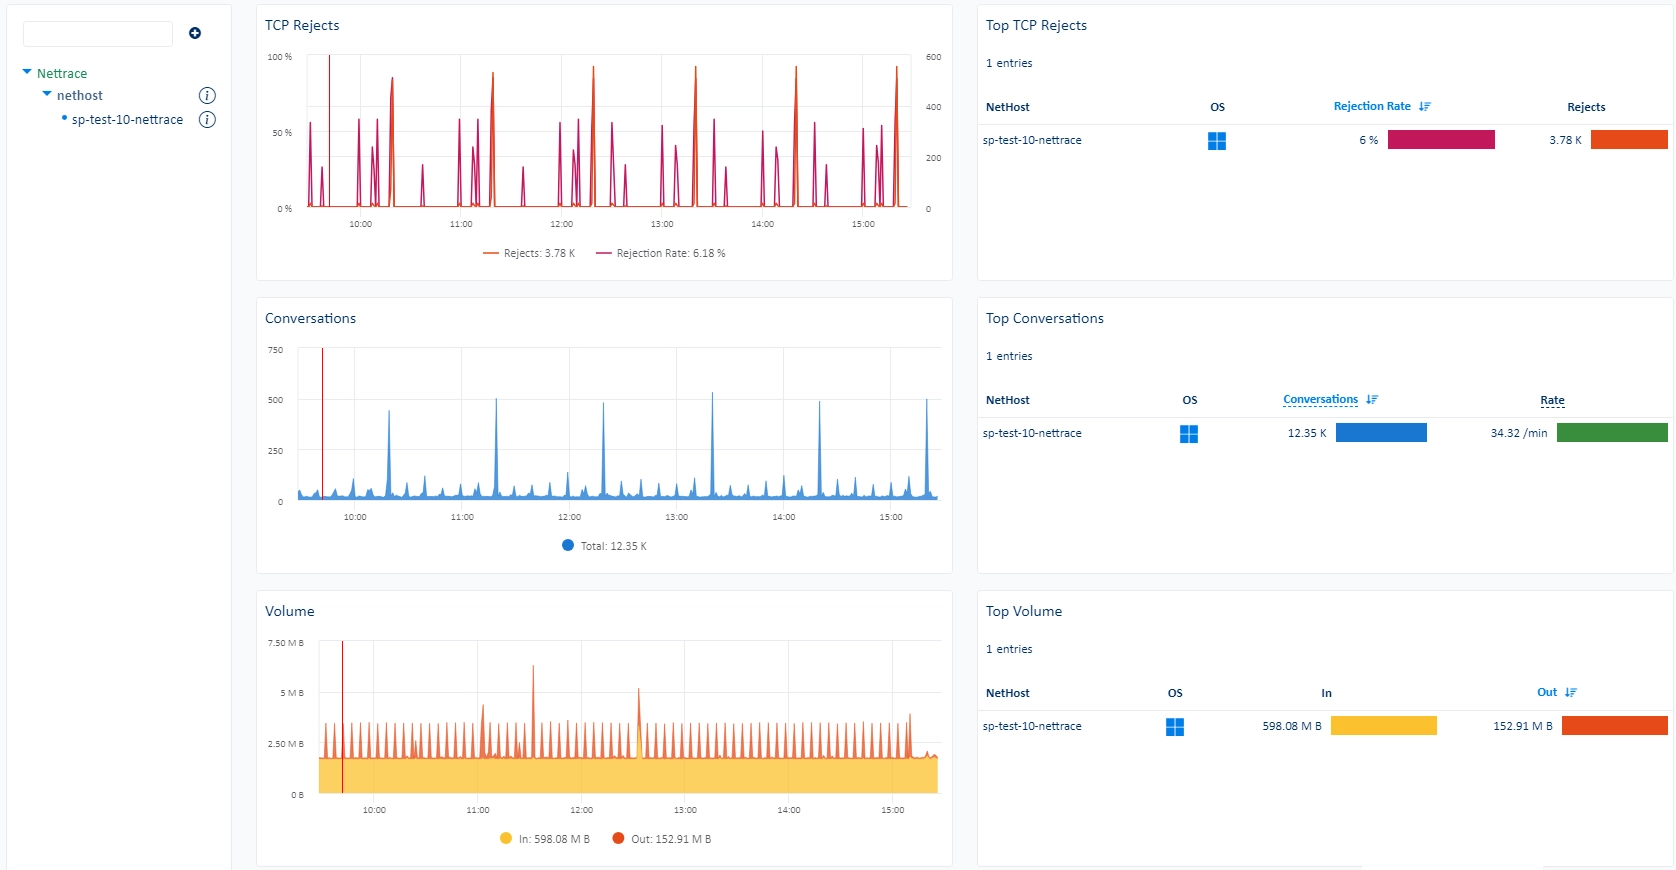
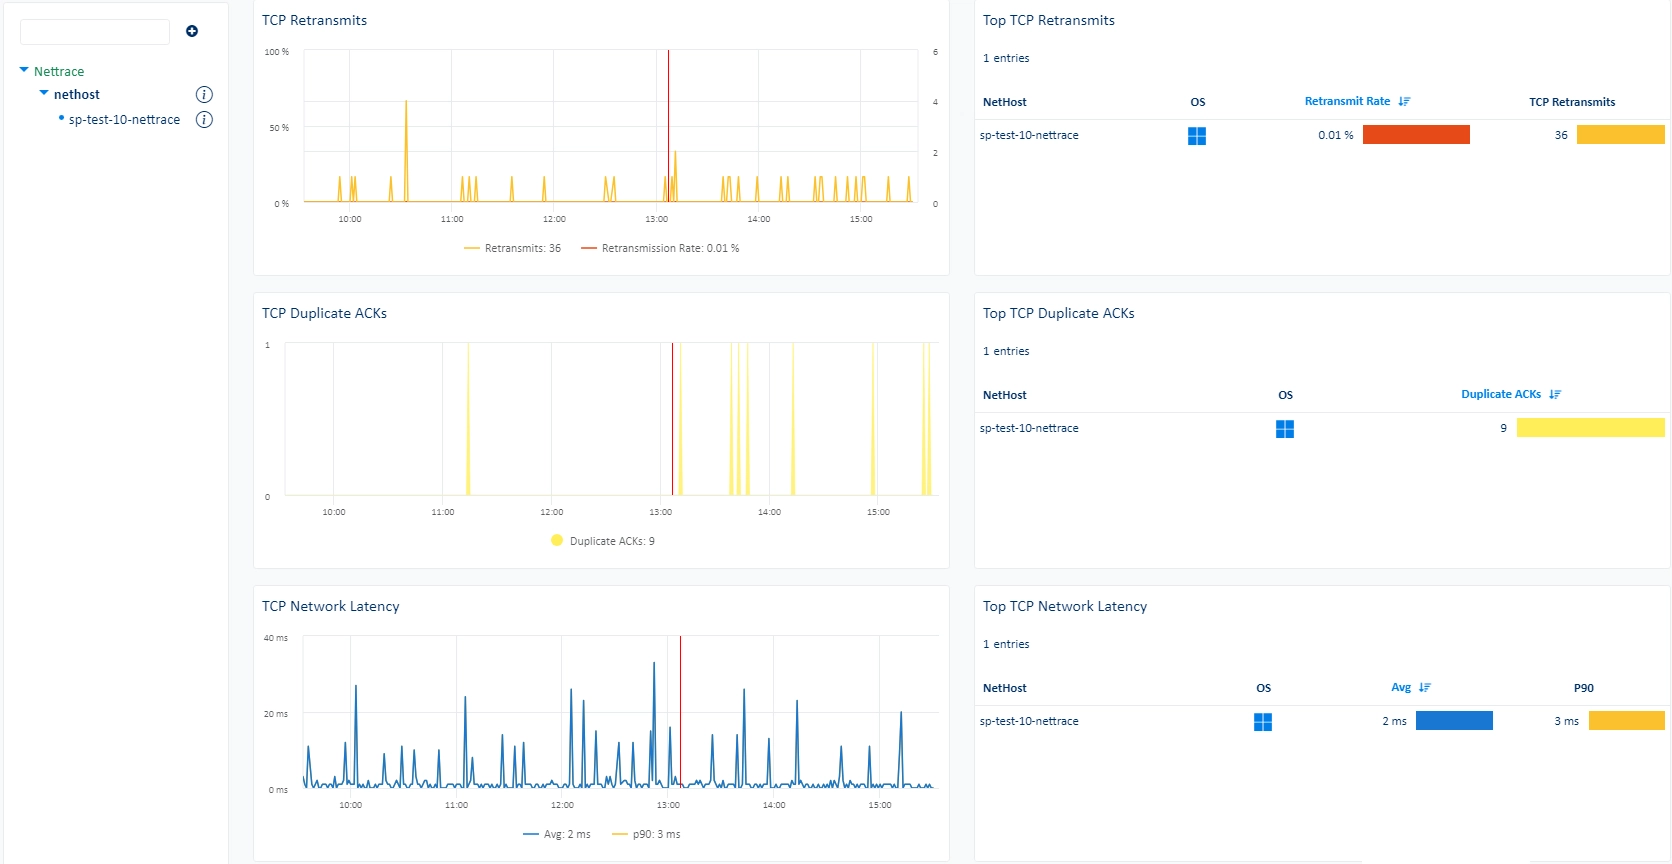
Aggregated statistics are provided for each monitored interface: Conversations, Bytes In/Out, Packets In/Out. These are calculated by summing all of the received flow packets for an interface. Depending on the flow protocol used, these values will either be representative of the total traffic passed through the interface or only representative of the samples that the flow protocol takes from the interface.
The ServicePilot Agent summarizes the flow data received to keep only the top 3 flows (conversations between the same IP addresses and port numbers) by volume of data transferred per minute. These conversations details are stored in a specific "NetTrace" collection in order to provide advanced dashboards presenting the top consumers of bandwidth by host and application per interface monitored.
How to install a nethost resource?
- Use your ServicePilot OnPremise installation or a SaaS account.
- Add a new nethost resource via the web interface (
/prmviewsor/prmresources) or via API (/prmpackagespage), the default ServicePilot agent or another agent will be provisioned automatically.
Details of the nethost package are located in the
/prmpackagespage of the software.
Benefits
ServicePilot enables you to deliver IT services faster and more securely with automated discovery and advanced monitoring features.
By correlating the technology NETHOST with APM and infrastructure monitoring, ServicePilot is able to provide a more comprehensive view of an organization's IT environment.
This allows IT teams to quickly identify and diagnose issues that may be impacting application performance, and take corrective action before end-users are affected.
Start with a free trial of our SaaS solution. Explore our plans or contact us to find what works best for you.