What is generic AppTrace monitoring?
ServicePilot's APM and distributed tracing enables detailed collection and analysis of application performance through out-of-the-box dashboards that monitor requests, errors, latency of web services and databases.
For both monolithic applications and microservice architectures, implementing ServicePilot APM across all servers or containers takes only minutes to automatically retrieve APM data (via automatic instrumentation, dd-trace-api, OpenTracing or OpenTelemetry).
The Apptrace Appservice Generic package automatically collects traces of applications built with a Pyhton, PHP, Ruby, Go, C++ APM agent or another language for which ServicePilot does not offer a specific package.
Generic Application Trace monitoring
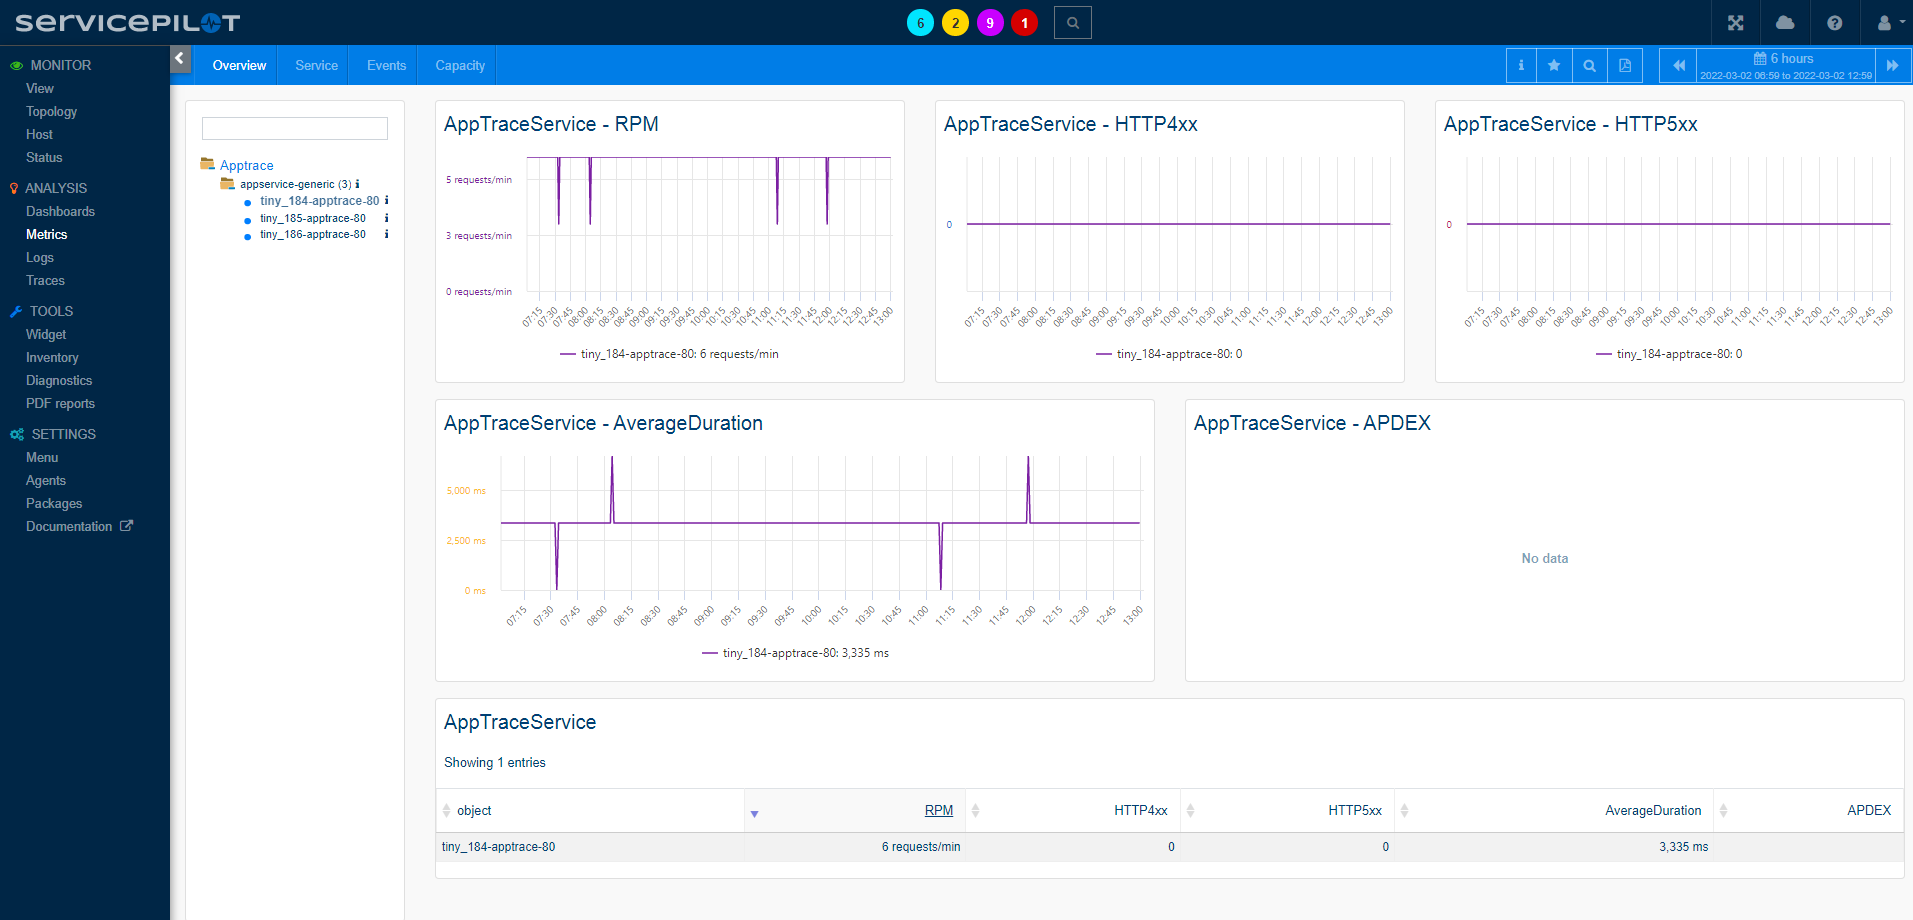
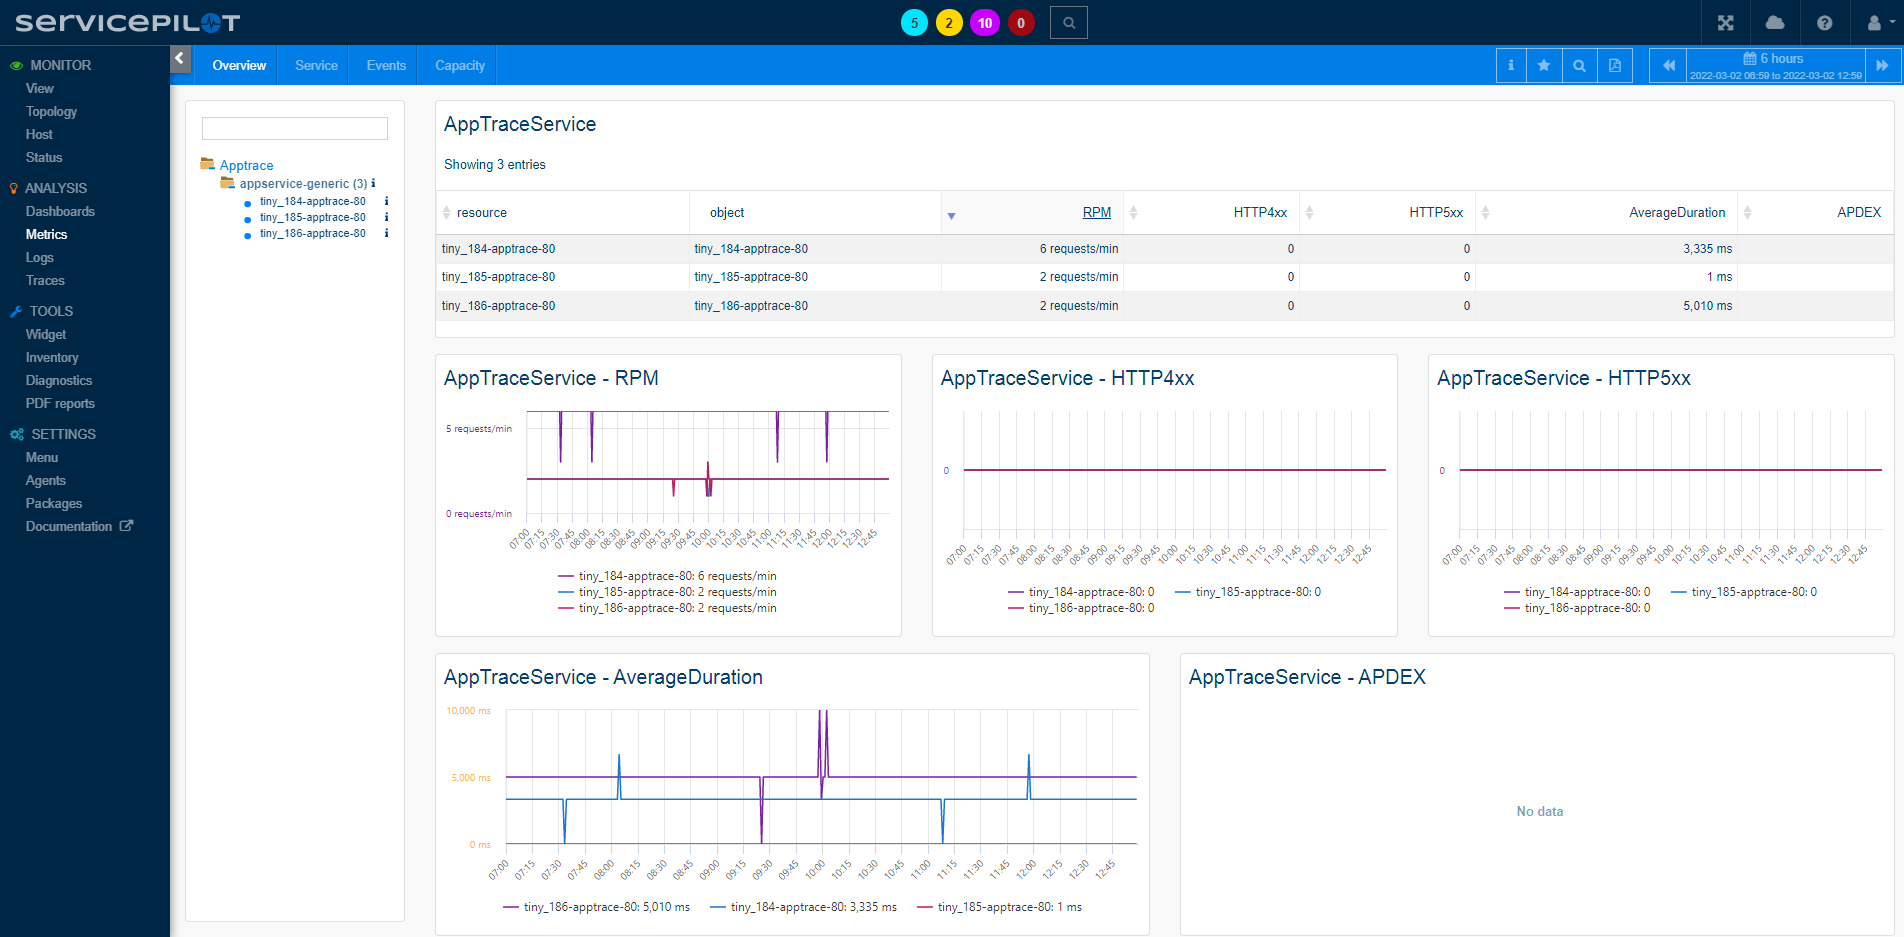
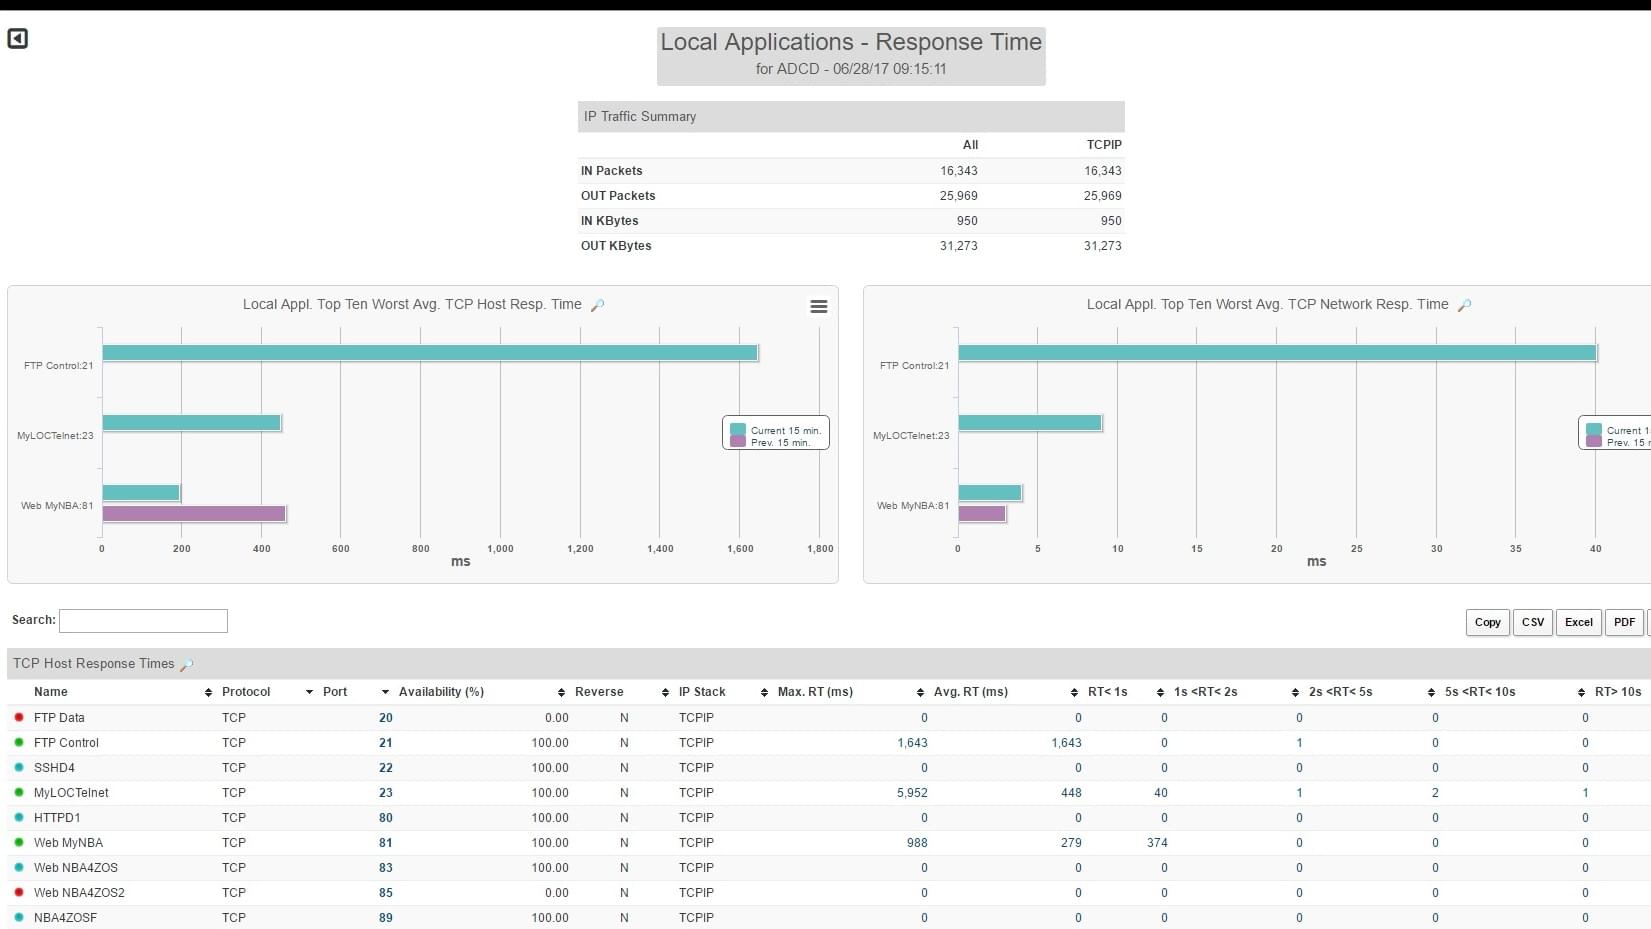
ServicePilot monitors HTTP(S) request traces from instrumented applications.
ServicePilot uses a ServicePilot Agent in combination with instrumentation (by automatic instrumentation, dd-trace-api, OpenTracing or OpenTelemetry) to allow any application to automatically send their web request statistics to ServicePilot.
This gathers summarized statistics (min,max,avg...) per application such as:
- Requests per minute
- Sum of requests by HTTP return codes and methods
- Number of requests in each response time range
- Established vs. Timed-out requests
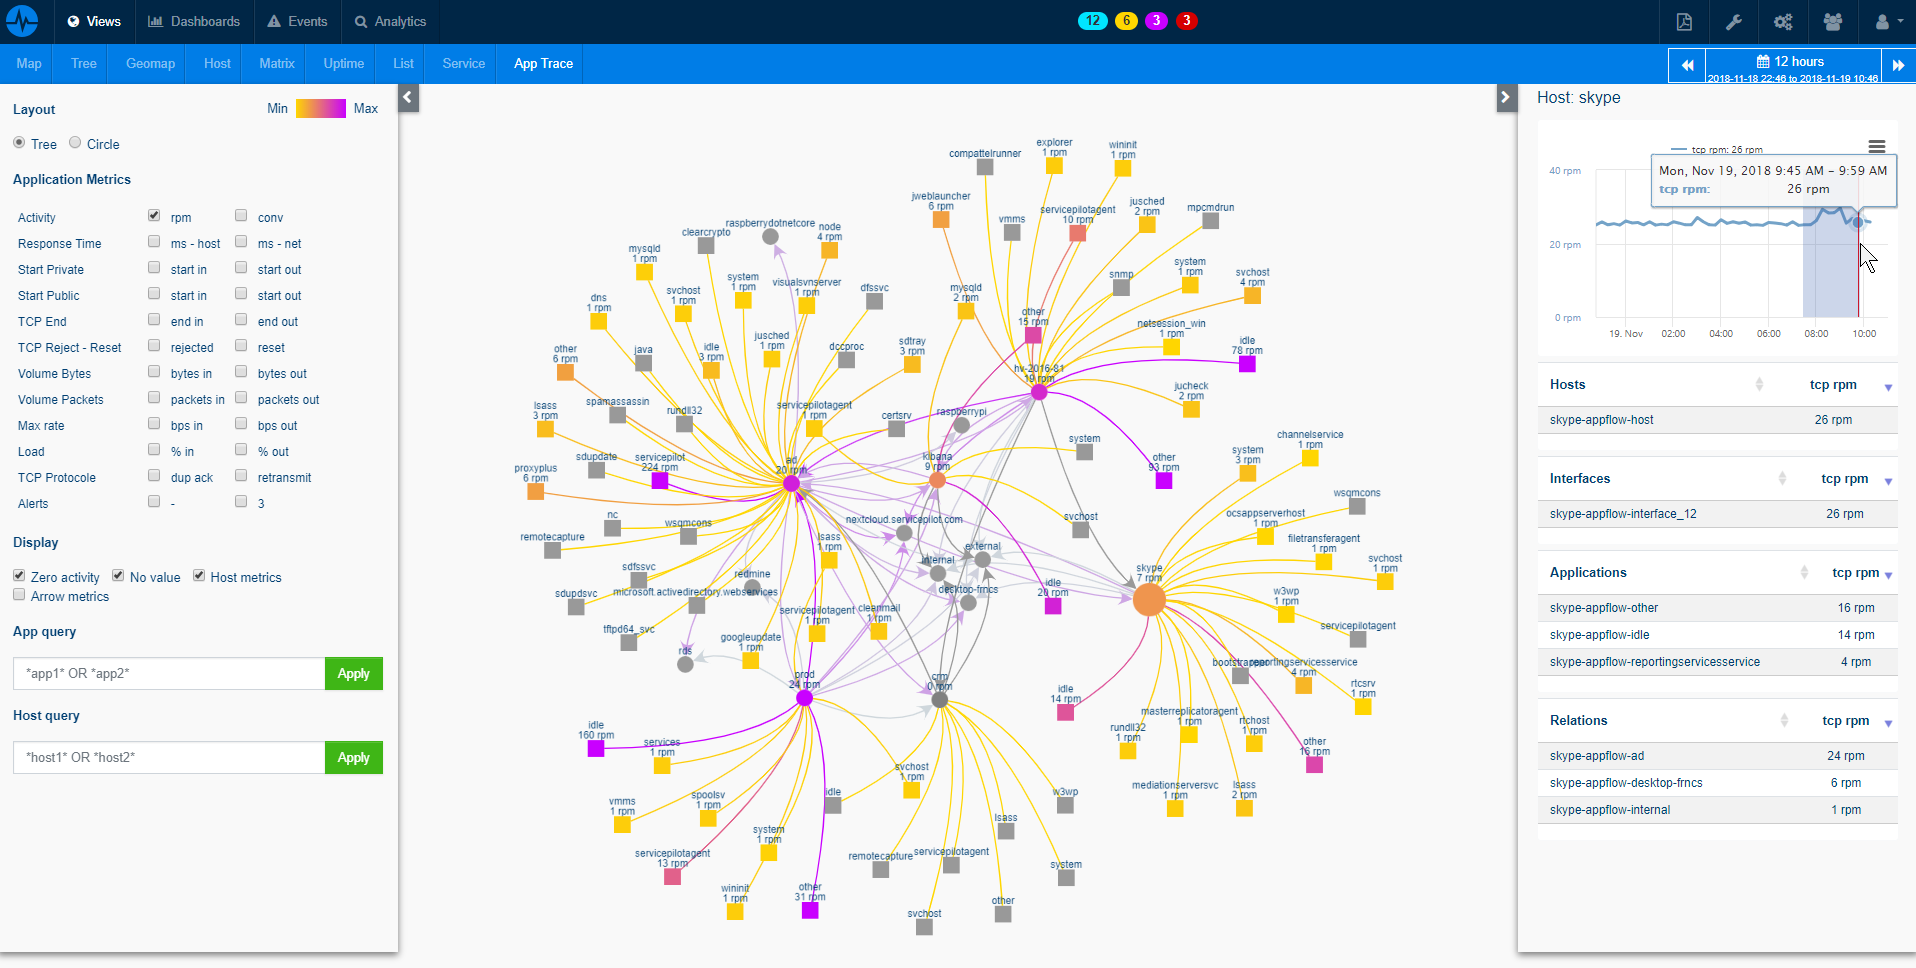
In order to provide deep application insights, details collected per request include:
- Host and web page path
- Server and client IP
- Real User Response time
- HTTP Return code and method
- Client country and geolocation for public IPs
How to install a appservice resource?
- Use your ServicePilot OnPremise installation or a SaaS account.
- Add a new appservice resource via the web interface (
/prmviewsor/prmresources) or via API (/prmpackagespage), the default ServicePilot agent or another agent will be provisioned automatically.
Details of the appservice package are located in the
/prmpackagespage of the software.
Benefits
ServicePilot enables you to deliver IT services faster and more securely with automated discovery and advanced monitoring features.
By correlating the technology APPSERVICE with APM and infrastructure monitoring, ServicePilot is able to provide a more comprehensive view of an organization's IT environment.
This allows IT teams to quickly identify and diagnose issues that may be impacting application performance, and take corrective action before end-users are affected.
Start with a free trial of our SaaS solution. Explore our plans or contact us to find what works best for you.