Kubernetes and Docker Container Monitoring
Unveiling Performance Metrics with Kubernetes Monitoring
ServicePilot assists you to monitor and proactively manage your Kubernetes clusters to ensure successful operations of your containerized infrastructure. It keeps track of cluster resource usage such as: memory, CPU and storage. You can also monitor the data flow between cluster components so you can quickly find and fix any problems.
Take for example a SaaS company that manages a lot of Kubernetes clusters for its many microservices. ServicePilot's Kubernetes monitoring allows you to keep an eye on all of these clusters to make sure that the resources are used efficiently and that all the parts of the clusters work together smoothly.
- An active management of Kubernetes helps make your containerized applications more efficient and effective
- Your applications perform at their best and you are helped to improve overall operations
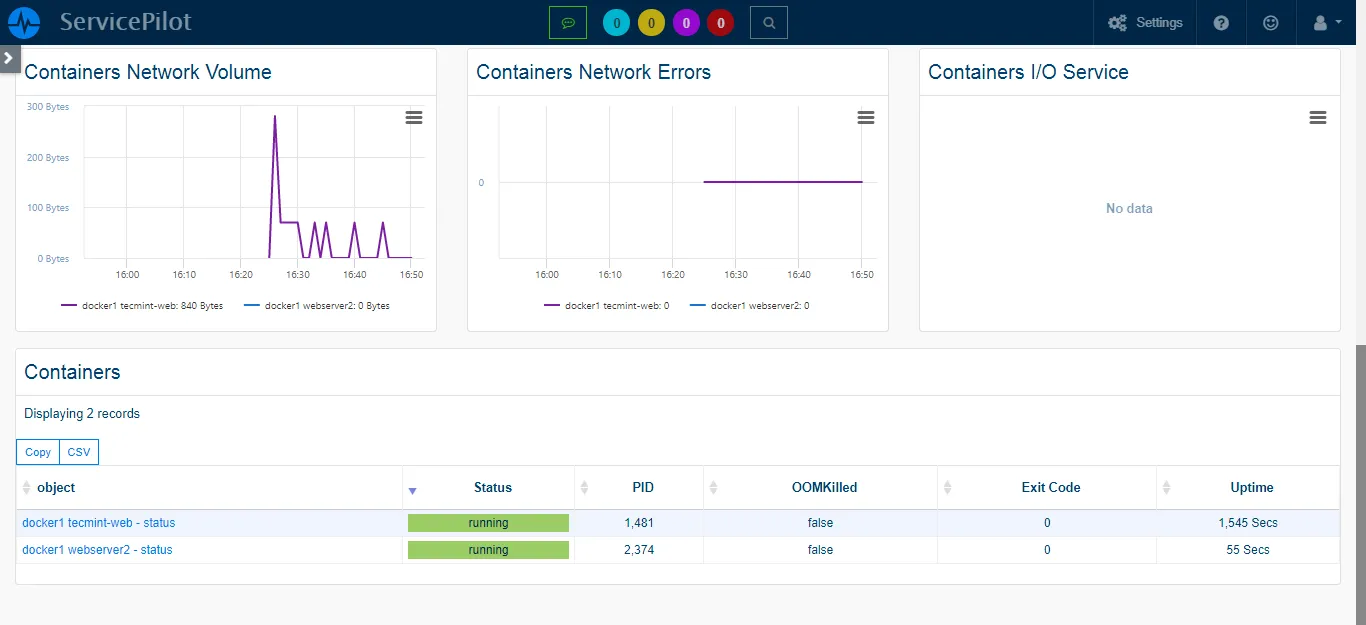
Automatic Discovery and Real-time Monitoring of Docker Containers
Thanks to the ServicePilot Agent installed on your servers, there is an automatic discovery of all your Docker containers. The monitored resources are directly integrated into maps while the monitoring data from each container is available in the dashboards. It gives easy access to real-time availability status and historical performance.
Consider a hosting provider dealing with hundreds of Docker containers on multiple servers. You can identify each of these containers and integrate them into a single monitoring dashboard. You will be able to keep track of each container's status and performance to rapidly identify any issues.
- With this automatic discovery and real-time monitoring of Docker containers, save a lot of time
- Focus on providing optimal services to your clients
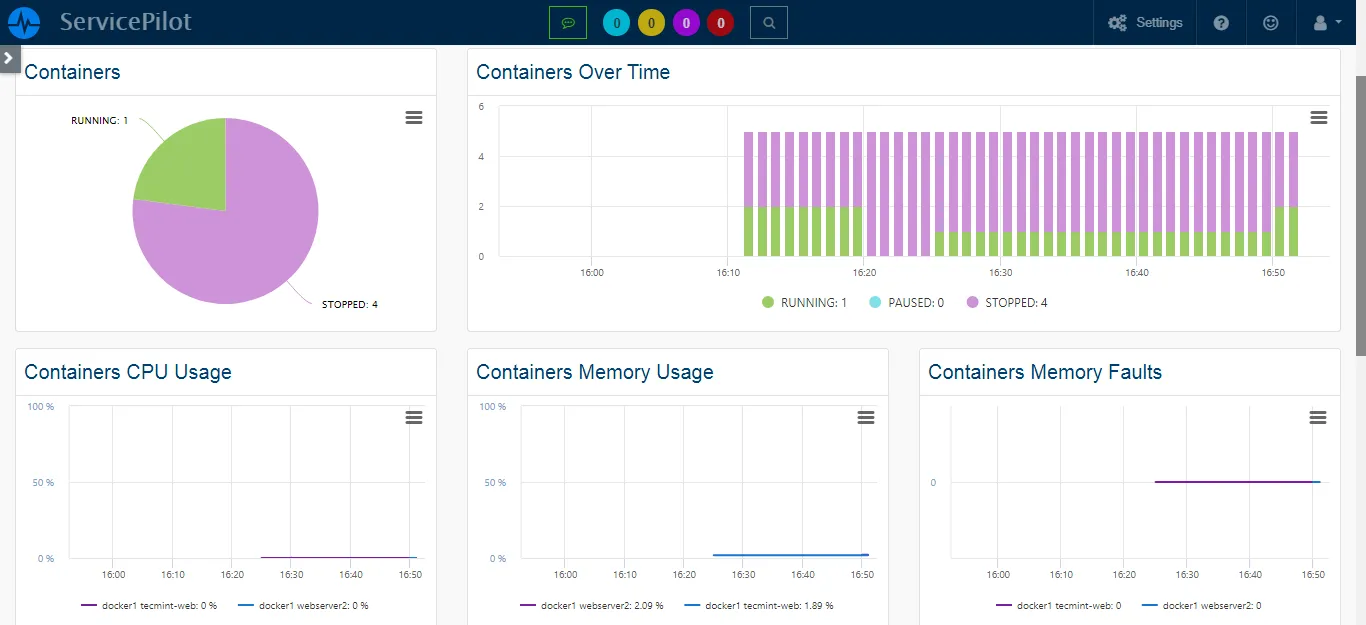
Comprehensive Performance KPIs for Every Docker Container
ServicePilot alerts you when something is wrong with your containers. Its interface provides detailed graphs showing the performance measures of each aspect of your machine (Disks, Network, System...) both in real time and historically.
You are an e-commerce business that uses several Docker containers to manage different aspects of your operations. When one of these containers starts to perform badly, you receive an alert. This alert includes a link to a real-time graph that helps you understand and fix the problem promptly.
- Focusing on container-specific KPI will help you improve the performance of your applications and keep them responsive
- This is important to keep your users satisfied and your business successful
Automatic Monitoring of Java Applications within Docker
ServicePilot makes it easier to monitor Java applications in Docker. Our Agent allows you to see all Key Performance Indicators for each request made by a Java application running in Docker. This includes automatic analysis of error rates, response time latencies, SQL or Web query details for better comprehension and end-to-end transaction insights.
Imagine you're a SaaS company and one of your flagship products is a Java application running in Docker. ServicePilot allows you to closely monitor the app's performance to keep a keen eye on response times, error rates and more.
- Our automated monitoring of Java apps under Docker ensures that you can swiftly identify and rectify potential issues
- Minimize disruption and maintain the high performance your users expect
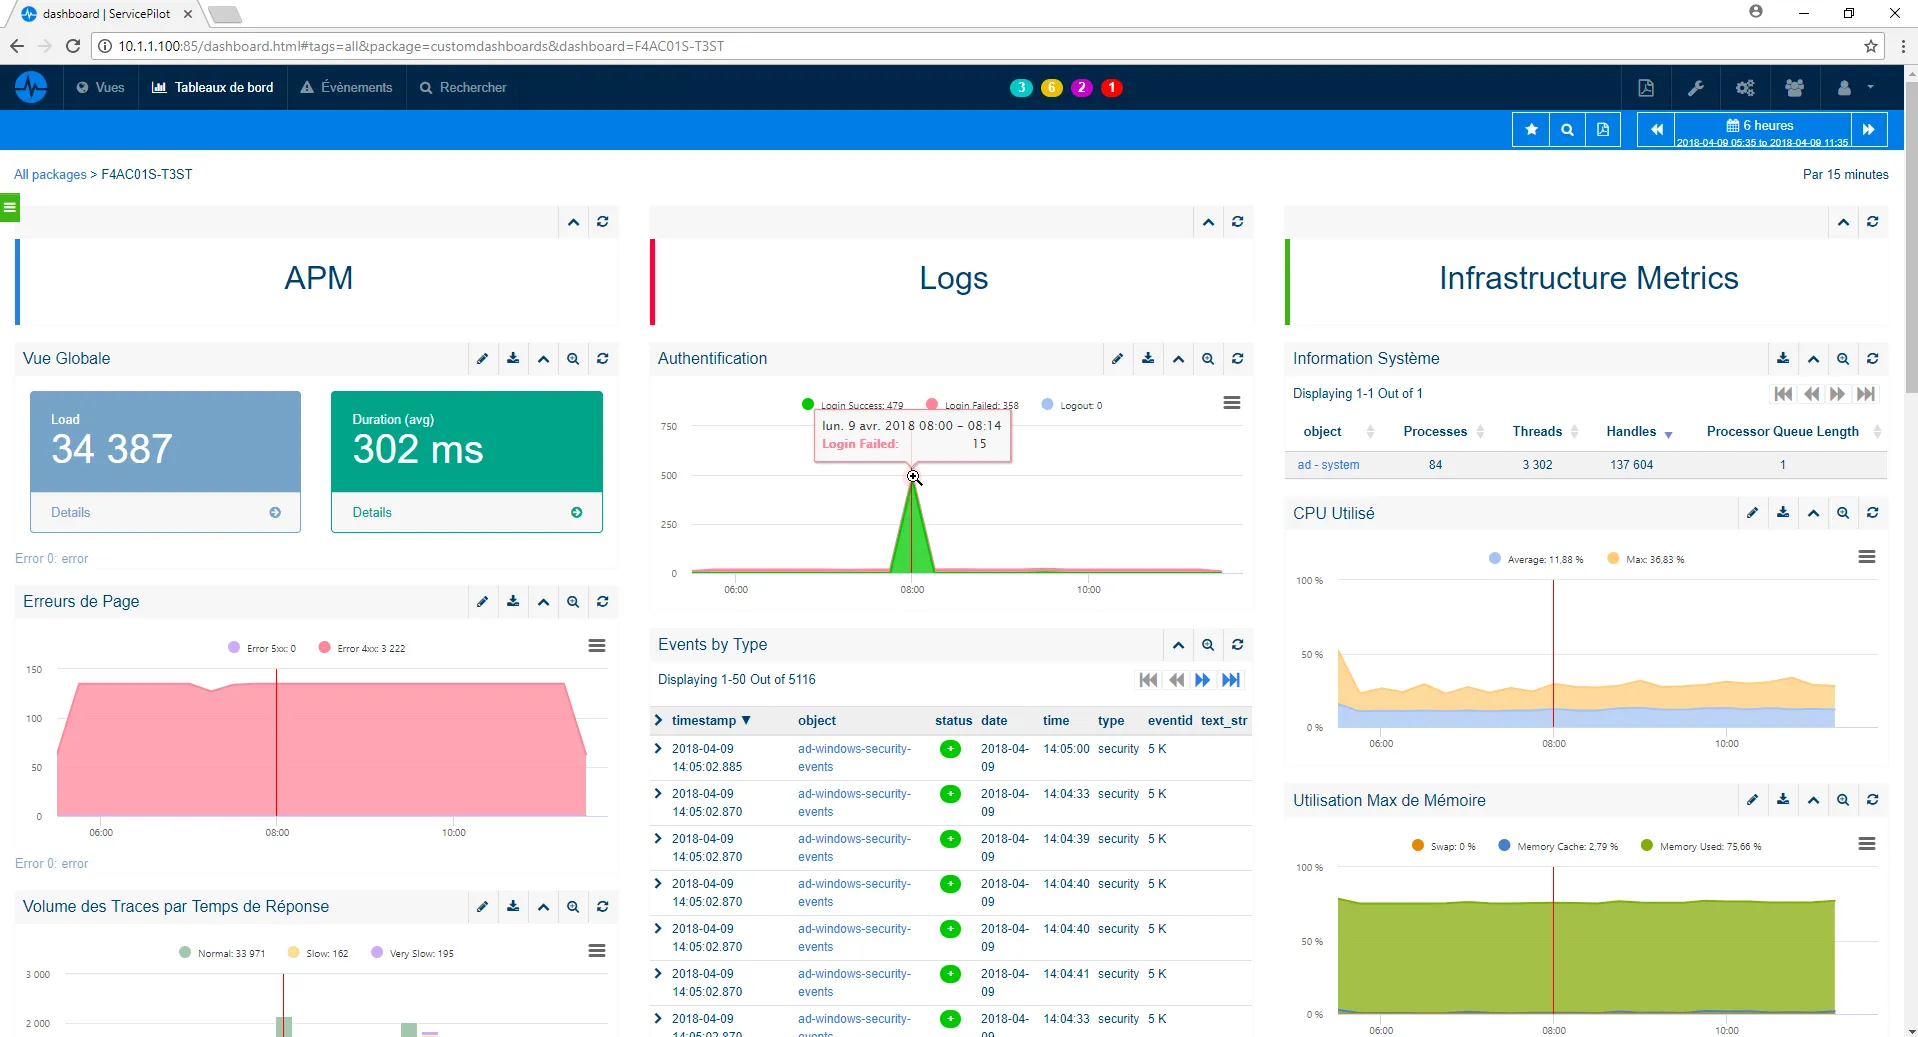
Correlation of Container, Application and Server Metrics
ServicePilot allows you to see the entire process of how an application and server are performing. By combining these two pieces of information, you can correlate and quickly understand what is causing issues with Docker Container services. With those insights, you can focus on finding the RCA (Root Cause Analysis) and fixing the main problem.
Let's say you are running a complex microservices architecture where an application spans multiple Docker containers on various servers. With our solution, you can correlate the metrics from these disparate elements to identify bottlenecks or failure points, which helps to speed up the troubleshooting process.
- Our dashboards and custom PDF reports can help you understand how service degradation affects user experience
- It allows you to make informed decisions, tackle issues proactively and keep your applications running smoothly on Docker Containers
I wanted to change the monitoring logic and tool to better understand the correlations between the applications and the infrastructure.
Monitoring to improve Docker Containers and Kubernetes Performances
Automated Docker Container Discovery
You can automatically find and keep track of all resources with agents, always up to date thanks to the Manager. A list of applications is created and statistics for each container are gathered.
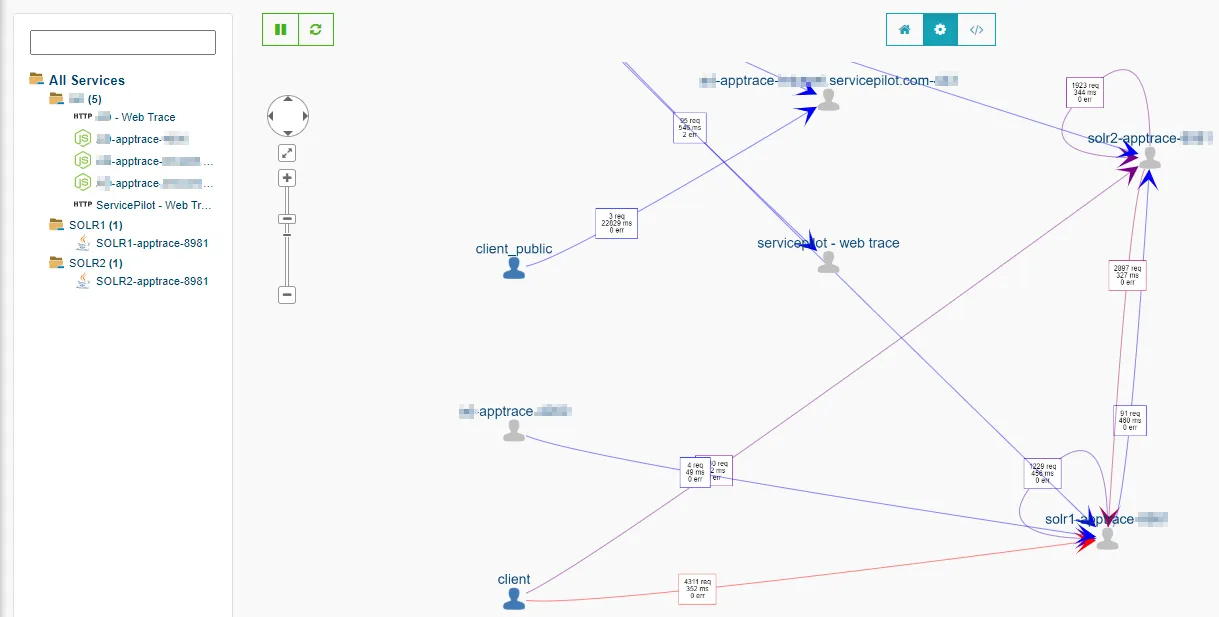
Interactive Visualizations of Network Traffic
It provides a simple view of all containers with top indicators for performance, alerts and errors. It also offers automatic maps of application flows even in a container network.
Proactive and Predictive Container Monitoring
It uses proactive monitoring and Machine Learning algorithms to find performance problems quickly. This helps avoid any negative effects on the service being provided and allows for smarter decision-making.
Capacity Planning for your Docker Containers
We help IT teams to analyze how they are using Docker containers to make sure they have enough capacity to meet their needs. Predictions and analysis of trends help them manage their Docker containers and plan for the future.
Integrations to monitor the Cloud
Other solutions to monitor the Cloud

Free installation in
a few clicks
SaaS Plateform
- No on-premise software setup, servicing and configuration complexity
- Instant setup, complete and pre-configured to ensure robust monitoring
OnPremise Plateform
- Contracts and commitments over time ( > 1 year)
- Performance, Data Storage and Infrastructure Management
- 2 additional solutions: VoIP and Mainframe monitoring
