Alerting
ServicePilot can alert users as soon as an event of importance occurs. It can also generate alerts proactively if a trend is likely to pass a threshold in the future. Alerts might also be held back if some event is expected to clear itself without requiring intervention.
By default, ServicePilot will present all data via its web interface but no alerts will be generated. To add alerts, new Alert Policies need to be configured. Note that Alert Policies are all independent of one another. Care is required when creating new alerts in order to avoid generating overlapping alerts that might notify users of the same issue multiple times.
To add Alert Policies, see the Policies documentation.
Each alert has three components:
- A Condition defines what will trigger the alert
- A Delay indicates if the alert should be held back for a time or a number of similar events
- An Action to take when the alert conditions have been met and any delay has been handled
Alert Condition
For an alert to trigger, certain conditions must be met. These conditions are associated with events that ServicePilot detects.
| Condition Type | Event |
|---|---|
| Resources | A change in status of a resource during a defined time period. |
| Objects | A change in status of an object during a defined time period. The objects triggering the alert can be filtered by name, class, view and if the alarms have been acknowledged for them. |
| Query | A Lucene query and threshold run every minute. |
| Views | A change in status of a view during a defined time period. The views triggering the alert can be filtered by name, class and if the alarms have been acknowledged for them. |
| Indicators | A change in status of an individual indicator during a defined time period. The indicators triggering the alert can be filtered by name, object name, object class, view and if their object's alarms have been acknowledged. |
| NDR | An Network Detection and Response (NDR) event has been detected. |
| SNMP Trap | A SNMP Trap or Notification has been received by ServicePilot during a defined time period. Traps can be categorized using SNMP Trap categorization rules before being filtered here by rule name, rule category, rule message, rule severity, enterprise OID, generic and specific type, sender IP address and agent IP address. Note that if a Trap is discarded and therefore not stored in the ServicePilot database then the Alert Policy will not match. |
| Syslog | A syslog message has been received by ServicePilot during a defined time period. Syslogs are filtered here by source IP address, severity, facility, host, description, tag, PID, message ID and data. |
Note: Operators may mark resources, views and objects alert statuses as being acknowledged. Acknowledged elements can then be included or excluded from Alert conditions and the status view.
Note: Resource anomalies - Objects change state based on thresholds and availability. It is possible to ignore object alerts based on historical data that determines if the state of the object's resource is considered an anomaly.
Ack condition
When creating Alert Policies with conditions Objects, Views or Indicators, the Ack field can be set to include or exclude acknowledged events. There are three options for the Ack field:
| Ack | Utilization |
|---|---|
| Ignore | Ignore the Ack status of the element |
| Ack | Include only elements that have performance or availability issues that have already been acknowledged |
| Not Ack | Include only elements that have not yet been acknowledged |
Alert Delay
Although all conditions of an alert might be met, the alert action will not be taken until the delay type has been considered.
| Delay Type | Use |
|---|---|
| No Delay | The action will be taken as soon as the conditions are met. |
| Action and ignore Condition for x Minutes | The action will be taken as soon as the conditions are met. However, the alert will then not trigger again if it occurs within the Duration specified. This is useful for conditions that are likely to occur repeatedly in bursts but when only one alert is needed. |
| Action after x Minutes if Condition still true | The action will be delayed by the Duration specified. Only if the conditions are still true after this delay the action will take place. This is useful for conditions that are expected to occur and recover by themselves. Only if the problem persists will the action be triggered. |
| Action after x Condition Hits during y Minutes | The action will only be triggered if it occurs a Number of times within the Duration specified. This is useful for things like bad password attempts received by syslog that would indicate a security breach attempt. |
Alert Action
A number of different actions may be taken:
| Condition Type | Event |
|---|---|
| Send an email | |
| Webhook | Send a web GET or POST request. This allows for integration with ticketing systems or messaging platforms like Microsoft Teams. See examples for details. |
| UDP | Send a UDP packet. If the UDP packet is formatted correctly and sent to the correct port, this might be defined as a syslog message |
| Trap | Send an SNMP Trap |
Note: Email actions group all alerts of the same kind every minute and send one summary email containing all of the changes. To send individual emails per alert, check the Not grouped option and specify the email subject and body text to use.
Alert variables
When an alert is triggered, information that can then be used is stored in the alert action. An email subject might therefore contain the object name that triggered the alert or a UDP syslog message might include the time at which the event occurred.
Some variables are common to all alert conditions while other variables differ depending on the action conditions used. If you need the value of an indicator above a threshold, then this will only be available for indicator condition alerts.
Common information is collected for all alerts.
| Variable | Content |
|---|---|
{DATE} |
Alert date based on the ServicePilot server's local time |
{TIME} |
Alert time based on the ServicePilot server's local time |
{DATEUTC} |
Alert date in UTC |
{TIMEUTC} |
Alert Time in UTC |
{BASEURL} |
Base URL of ServicePilot |
{LOCALIP} |
IP address of ServicePilot |
{LOCALWEBPORT} |
Web port of ServicePilot |
These variables are only available depending on the Alert Policy condition.
| Condition | Variable | Content |
|---|---|---|
| Resource, View, Object, Indicator | {RESOURCE} |
The resource name |
{PACKAGE} |
The package type of the resource | |
{TECHNOLOGY} |
The type of package or first part of the package name | |
{TAGS} |
All of the tag values associated with the resource | |
{TAG_1} ... {TAG_5} |
The first to the fifth tag value associated with the resource | |
{STATUS} |
The current status of the resource, view or object as character (?,-,1,2,3,+) | |
{STATUSBADGE} |
The current status of the resource, view or object as HTML formatted text (?,-,1,2,3,+) | |
{STRSTATUS} |
The current status of the resource, view or object as text (unknown,unavailable,minor,major,critical,ok) | |
{OLDSTATUS} |
The previous status of the resource, view or object as a character (?,-,1,2,3,+) | |
{OLDSTATUSBADGE} |
The previous status of the resource, view or object as HTML formatted text (?,-,1,2,3,+) | |
{STROLDSTATUS} |
The previous status of the resource, view or object as text (unknown,unavailable,minor,major,critical,ok) | |
{DURATION} |
The time during which the view or object has been in the current state | |
{PROBLEMNOTE} |
An operator entered a problem note when Acknowledging a status event | |
{TEXT} |
A text reason for the latest change of state of a view or object | |
{DESCRIPTION} |
The resource description field content | |
{NOTE} |
The content of the Note field | |
| View, Object, Indicator | {CLASS} |
The type of view or object |
{VIEW} |
The view name | |
{PARENTVIEW} |
The view above the view that triggered the alert | |
{OBJECT_1} ... {OBJECT_5} |
The content of the view or object constants 1 through 5 | |
{VIEW_0} ... {VIEW_9} |
The name of the views from level 0 to 9 under which this view is found | |
| Resource, Object, Indicator | {ANOMALY} |
If this alert is based on a detected anomaly then ! is returned in this field. When HTML is enabled this field will include HTML formatting |
| Object, Indicator | {OBJ} |
The object name |
{IP} |
The IP address of the object | |
{HOST} |
The FQDN or IP address of the object, depending on how the resource was configured | |
{AGENTNAME} |
Name of the ServicePilot Agent providing data to the object | |
| Indicator | {INDICATORSTATUS} |
The current status of the indicator as character (?,-,1,2,3,+) |
{INDICATOROLDSTATUS} |
The previous status of the indicator as a character (?,-,1,2,3,+) | |
{INDICATORNAME} |
The name of the indicator | |
{INDICATORVALUE} |
The current value of the indicator | |
| Syslog | {TIMESTAMP} |
The timestamp found in the syslog |
{IP} |
The IP address from which the syslog was received | |
{HOST} |
The host found in the syslog | |
{PID} |
The PID found in the syslog | |
{TAG} |
The Tag found in the syslog | |
{TEXT} |
The text of the syslog | |
{DESCRIPTION} |
The text of the syslog after all of the named components have been parsed | |
{FACILITY} |
The syslog Facility | |
{SEVERITY} |
The syslog Severity | |
{MSGID} |
The Message ID found in the syslog | |
{DATA} |
The structured data found in the syslog | |
| SNMP Trap | {TRAPNAME} |
The trap rule name |
{TRAPCATEGORY} |
The trap rule associated category | |
{TRAPSEVERITY} |
The trap rule associated severity | |
{TRAPMESSAGE} |
The trap rule associated message | |
{TRAPIPSENDER} |
The IP address of the sender of the trap | |
{TRAPIPAGENT} |
The IP address of the SNMP Agent that originally sent the trap | |
{TRAPALLOIDVALUES} |
All content of the trap OID values received | |
{TRAPOID1} ... {TRAPOID20} |
The trap OID variable name 1 through 20 | |
{TRAPVALUE1} ... {TRAPVALUE20} |
The trap OID variable value 1 through 20 | |
| NDR | {TIMESTAMP} |
The time when the NDR event was detected |
{PROTO} |
The protocol (TCP, UDP, ICMP) of the NDR event | |
{SRCAGENT} |
The ServicePilot Agent detecting the source of the NDR event traffic | |
{SRCIP} |
The source IP address of the NDR event traffic | |
{SRCHOST} |
The source host name of the NDR event traffic | |
{SRCCOUNTRY} |
The source country of the NDR event traffic | |
{SRCPROCESS} |
The source process ID of the NDR event traffic | |
{DSTAGENT} |
The ServicePilot Agent detecting the destination of the NDR event traffic | |
{DSTIP} |
The destination IP address of the NDR event traffic | |
{DSTPORT} |
The destination port of the NDR event traffic | |
{DSTHOST} |
The destination host name of the NDR event traffic | |
{DSTCOUNTRY} |
The destination country of the NDR event traffic | |
{DSTPROCESS} |
The destination process ID of the NDR event traffic | |
{MODEL} |
The model triggering the NDR event | |
{ATTACK} |
The attack type detected by the model | |
{SCORE} |
The NDR event certainty score | |
| Query | {COLLECTION} |
The ServicePilot data collection queried |
{QUERY} |
The Lucene query performed | |
{OPERATOR} |
The threshold operator used to compare the query with the threshold | |
{THRESHOLD} |
The threshold value used to test the query | |
{VALUE} |
The value returned by the query | |
| Delay not "No Delay" | {CORRID} |
The unique correlation ID of the alert context which has been used to check the conditions after the specified delay |
{WINDOW} |
The time window during which the alert conditions were verified before triggering the alert | |
{NBEVENTS} |
The number of events that matched the alert conditions triggering the alert |
Acknowledge status changes
When elements in ServicePilot change status and become unavailable or have a performance issue, the object, views and resources will reflect this problem. It is possible to acknowledged the issue so that it may be discounted in the Status views and when matching alerting conditions. Acknowledging an issue will not change its status or hide the problem but a note will be visible against the acknowledged element.
If the issue is cleared and the elements become available and nominal then the acknowledgement will disappear. This may be a problem for elements that continually change between nominal and a bad status as an acknowledgement will not be maintained. In this case, a Note may be added instead as this will not be removed automatically.
Access "Ack/Note" of an object from the map
| 1. As a user with operator privileges, navigate the View hierarchy until the object you wish to acknowledge/note is open |
| 2. Click on the Ack or Note button |
Access "Ack/Note" of a view from the map
| 1. As a user with operator privileges, navigate in the View hierarchy until the view you wish to acknowledge/note is open |
| 2. Click on the Magnifier icon |
| 3. Click on the Ack or Note button |
Access Acknowledge/Note from status lists
| 1. As a user with operator privileges, navigate to Status |
| 2. Select Resource, Object or View from the Status sub-menu depending on the component you wish to acknowledge/note |
| 3. Select one or more elements to acknowledge or note and click on the green Ack or blue note |
Status lists' filters
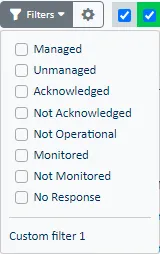
In the Status lists you can find elements based on a numer of filter criteria. The list of filters available is dependent on the Status list (Resource, Object, View) selected:
| Filter | Definition |
|---|---|
| Managed | Show elements that are not marked as unmanaged. Operators can manually mark elements as unmanaged to stop reporting status or also stop collecting data. |
| Unmanaged | Show elements that are currently marked as unmanged. Operators can manually mark elements as unmanaged to stop reporting status or also stop collecting data. |
| Acknowledged | Show elements that have performance or availability issues and have been marked with an Ack. |
| Not Acknowledged | Show elements that have not been marked with an Ack. |
| Not Operational | Show elements that are flashing, indicating that a ServicePilot Agent is not reporting some data for the resource. |
Alerting examples
To receive emails when a ping no longer responds an Alert Policy is required:
| 1. Add a new Policy and set the type to Alert | |
2. Set the Alert Policy name appropriately. For example: alert_ping_no_response_email |
|
3. Check Apply this Policy to the entire configuration so that this will apply to all Ping objects in the configuration |
|
| 4. In the Condition tab, set the Condition type to Object | |
| 5. Set the From status to all colors except red | |
| 6. Set the To status to only red | |
7. Set the Filter Classes to Ping |
|
| 8. In the Action tab, set the Action type to email | |
| 9. Set the From address and set the To email addresses (semi-colon separated) as required | |
| 10. If you choose to send ungrouped emails, check the Not grouped box | |
11. If you choose to send ungrouped emails, set the Subject. For example: (ServicePilot) Ping not responding to {OBJ} |
|
12. If you choose to send ungrouped emails, set the Message. For example: Ping not responding to {OBJ} at {DATE} {TIME} |
|
| 13. Save the new Policy | |
This alert might be sent for part of the configuration by not applying this Policy to the entire configuration. Instead apply this Policy to a view or a number of resources individually.
Microsoft Teams can receive and post messages to a channel using a URL created to send webhooks. Start by creating the URL in Microsoft Teams and then set the URL and POST body correctly in a ServicePilot Alert.
| 1. Add a new Policy and set the type to Alert | |
2. Set the Alert Policy name appropriately. For example: alert_teams_channel |
|
| 3. Set the required Condition | |
| 4. In the Action tab, set the Action type to Webhook | |
| 5. Set the Method to Post | |
| 6. Set the Webhook data using an AdaptiveCard JSON definition | |
| 7. Test the new Webhook | |
| 8. Save the new Alert Policy | |
Example Microsoft Teams webhook body:
{
  "type": "message",
  "attachments": [{
      "contentType": "application/vnd.microsoft.card.adaptive",
      "contentUrl": null,
      "content": {
        "$schema": "http://adaptivecards.io/schemas/adaptive-card.json",
        "type": "AdaptiveCard",
        "version": "1.2",
        "body": [{
            "type": "TextBlock",
            "text": "ServicePilot object unavailable: {OBJ}"
          }
        ]
      }
    }
  ]
}
To obtain notifications when a hard disk volume passes the major or critical space usage threshold, add a new Alert Policy:
| 1. Add a new Policy and set the type to Alert | |
2. Set the alert Policy name appropriately. For example: alert_disk_space_usage_high |
|
3. Check Apply this Policy to the entire configuration to that this will apply to all Server Disk objects in the configuration |
|
| 4. In the Condition tab, set the Condition type to Indicators | |
| 5. Set the From status to gray, green and blue | |
| 6. Set the To status to yellow and orange | |
7. Set the Filter Classes to Server Disk |
|
8. Set the Filter Indicator to Space Usage |
|
| 9. Save the new Policy | |
With the Condition set to the Indicators type, the Indicator name and current values can be used in the action. For example: {STRSTATUS} disk alert: {OBJ} usage at {INDICATORVALUE}
Send an RFC5424 formatted syslog message when an object becomes critical.
| 1. Add a new Policy and set the type to Alert | |
2. Set the Alert Policy name appropriately. For example: alert_object_critical |
|
| 3. In the Condition tab, set the From status to all checked except critical and To status to all unchecked except critical | |
| 4. In the Action tab, set the Action type to UDP | |
5. Set the UDP Port to 514 |
|
6. Set the UDP Message to <10>1 {DATEUTC}T{TIMEUTC}Z servicepilot.company.com servicepilot - - [criticalObjAlert@23098 object="{OBJ}" class="{CLASS}" problem="{PROBLEMNOTE}"] Critical Object Alert for {OBJ}, Problem: {PROBLEMNOTE} |
|
| 7. Save the new Alert Policy | |
To obtain an alert outside office hours start by creating a Time period defining the out of office hours timespans. Then include this Time period in the new alert Policy:
1. Add a new Time period with name Out of hours 1 |
|
2. Set the Ranges to 00:00 - 09:00 and 18:00 - 23:59 from Monday to Friday |
|
| 3. Sav e the new Time period | |
4. Add a second new Time period with name Out of hours 2 |
|
5. Set the Ranges to 00:00 - 23:59 for Saturday and Sunday |
|
| 6. Save the new Time periods | |
| 7. Add a new Policy and set the type to Alert | |
8. Set the alert Policy name appropriately. For example: alert_ooh_site_resource_unavailable |
|
| 9. In the Condition tab, set the Condition type to Resources | |
| 10. Set the Alerting time period to `Out of hours 1 | Out of hours 2` |
| 11. Set the From status to all colors except red | |
| 12. Set the To status to only red | |
| 13. Set the action as required | |
| 14. Save the new Policy | |
15. Apply this new Policy to the view called Sites to affect all resources in this view and sub-views. |
|
