What is ServicePilot?
ServicePilot is a high-performance analytics platform that supports observability and Full-stack monitoring: Metrics, traces and logs. You can collect data from many services and sources across your entire IT stack (ITIM, NPM, APM, DEM, SIEM) as well as view details of historical data stored by ServicePilot.
ServicePilot monitoring software has a number of advantages, in particular:
- Secured and modern architecture: Designed to adapt to very large environements, hybrid infrastructures as well as Cloud services.
- Technology coverage and flexibility: Full-stack observability of the infrastructure, the Cloud and each application transaction.
- Favorable TCO: In the APM and observability market, the cost is divided by 3 or more with very little commitment and fast installation.
After having installed a ServicePilot Agent and configured your technology packages to send data to ServicePilot, you can analyze metrics, logs and events in custom monitoring dashboards, alert on collected indicators or perform automated analytics with PDF reporting.
ITIM - IT Infrastructure Monitoring
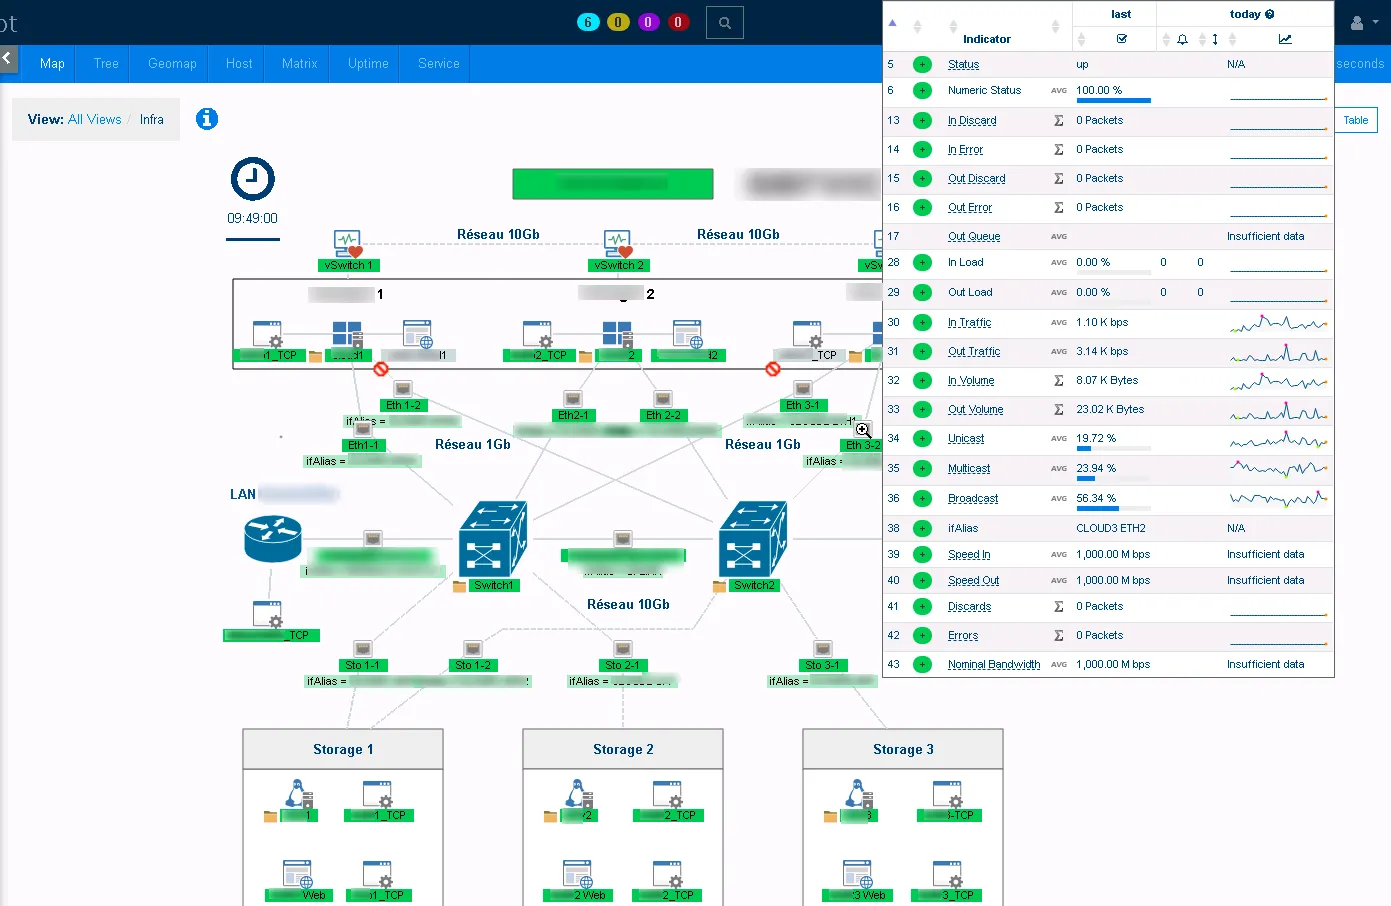
IT infrastructure monitoring with ServicePilot allows you to automatically monitor all your servers and IT resources. The collection of key performance indicators on all the IT layers of the datacenter (storage, servers, UPS, IoT, etc.) allows you to carry out a complete monitoring of critical resources and to correlate the elements of the IT infrastructure according to your needs (geographical, business, technological, etc.).
NPM - Network Performance Monitoring
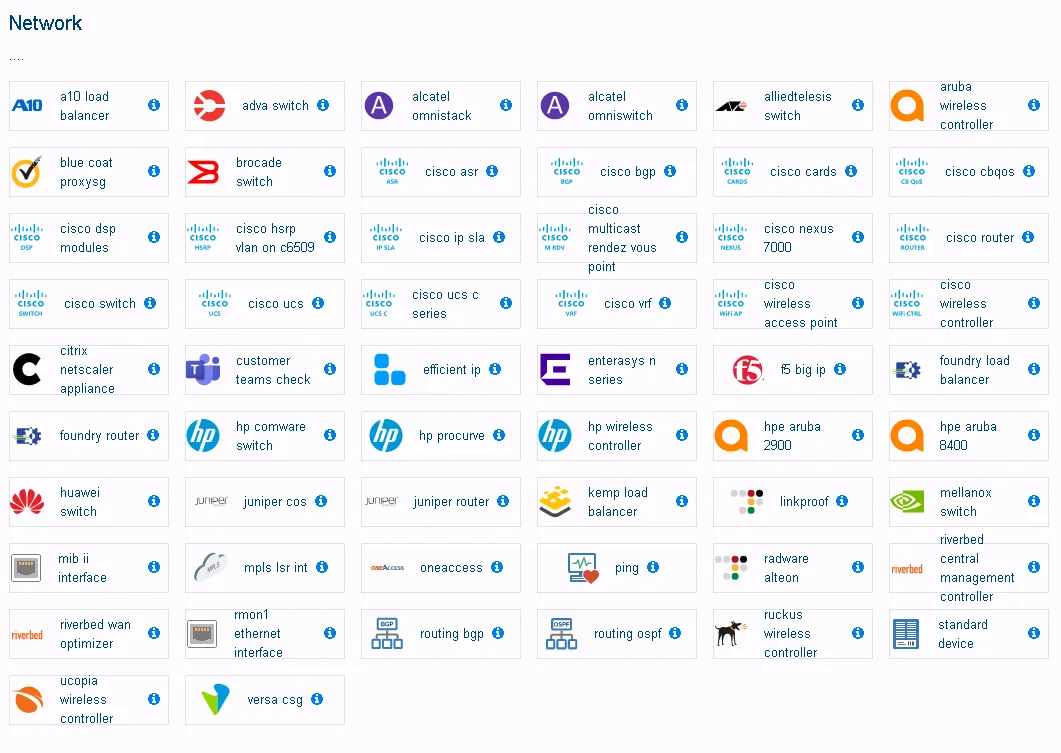
Network Performance Monitoring with ServicePilot provides full visibility into the availability and performance of your LAN, WAN or SDWAN. The technology packages allow automatic discovery and monitoring for many devices on the market (Cisco, HP, Versa Networks, Citrix…). You can also analyze the Netflow traffic on your routers live or with historical dashboards.
APM - Application Performance Monitoring
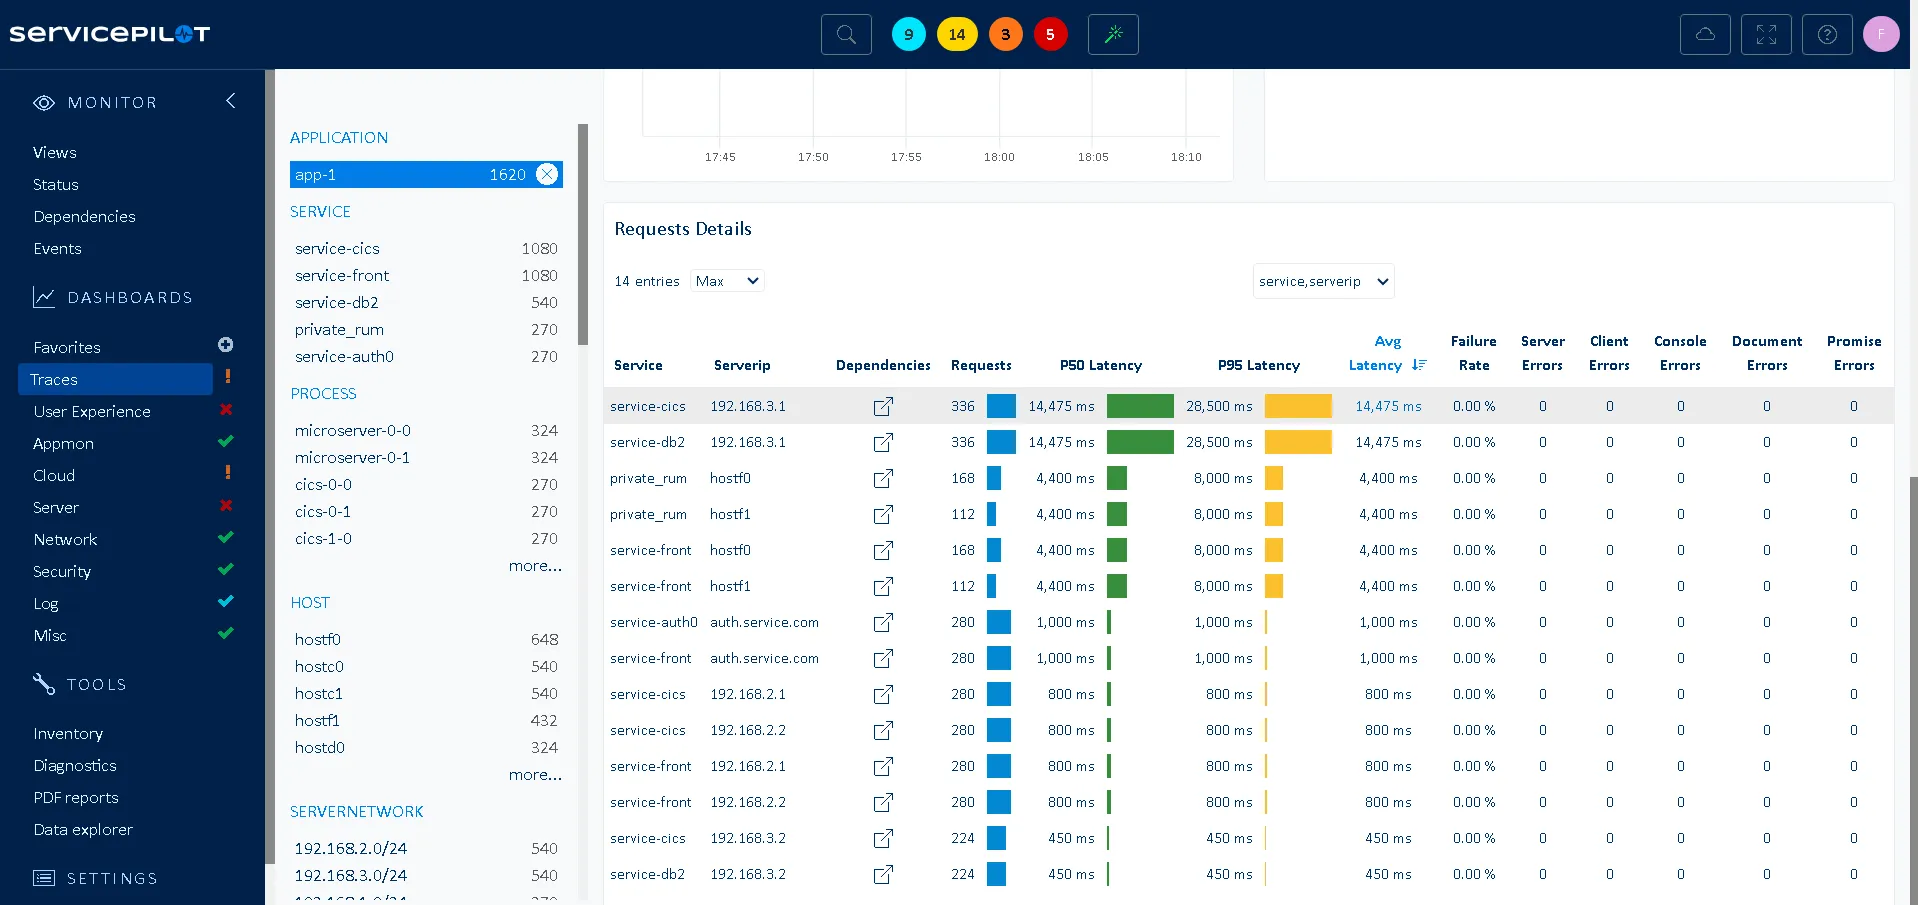
Application Performance Monitoring with ServicePilot provides intelligent observability of your applications by bringing together the 3 types of APM data: Metrics, logs and traces. With the ServicePilot agent and very little configuration, you can automatically monitor key metrics for all your applications, such as request volume, web transaction response times and view key application server traffic metrics including latency, TCP retransmissions and more.
DEM - Digital Experience Monitoring
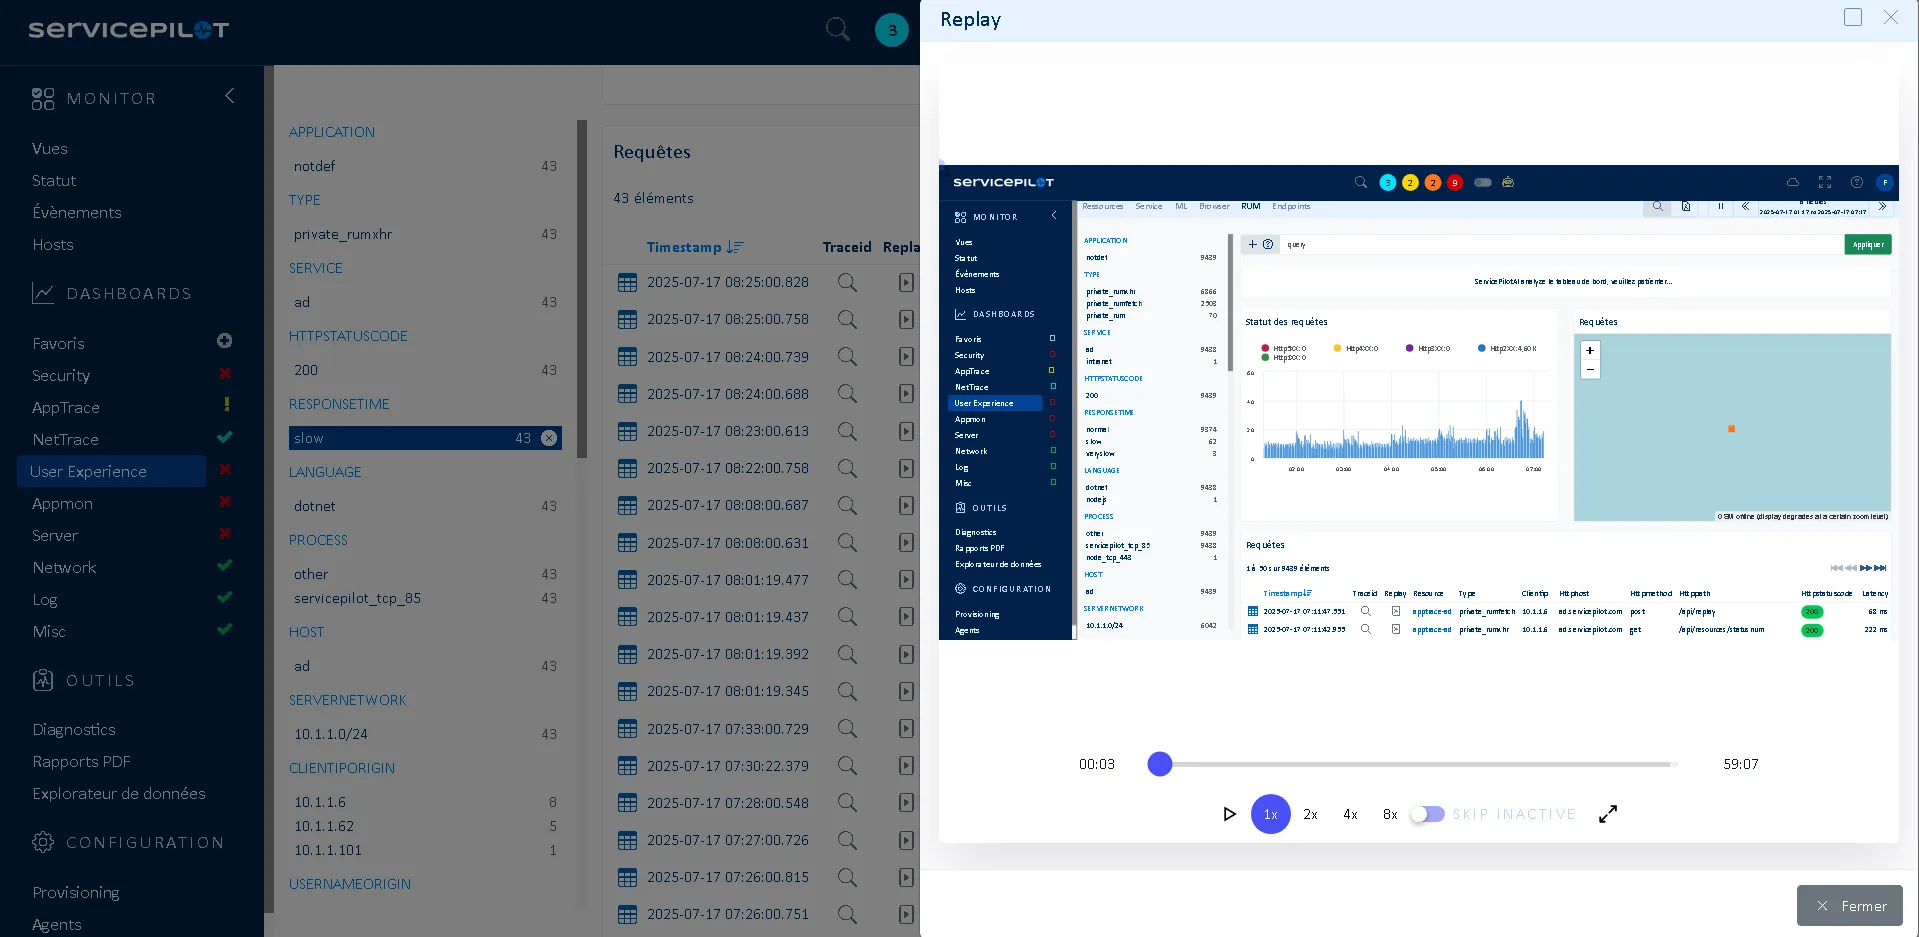
Digital Experience Monitoring with ServicePilot allows you to combine web-based synthetic testing with Real User Monitoring (RUM) to analyze user activity in web applications. You can view load times, client/server errors and technology dependencies of your application (database or web server) to quickly resolve issues by correlating application and infrastructure performance in a single dashboard.
SIEM - Security Information and Event Management
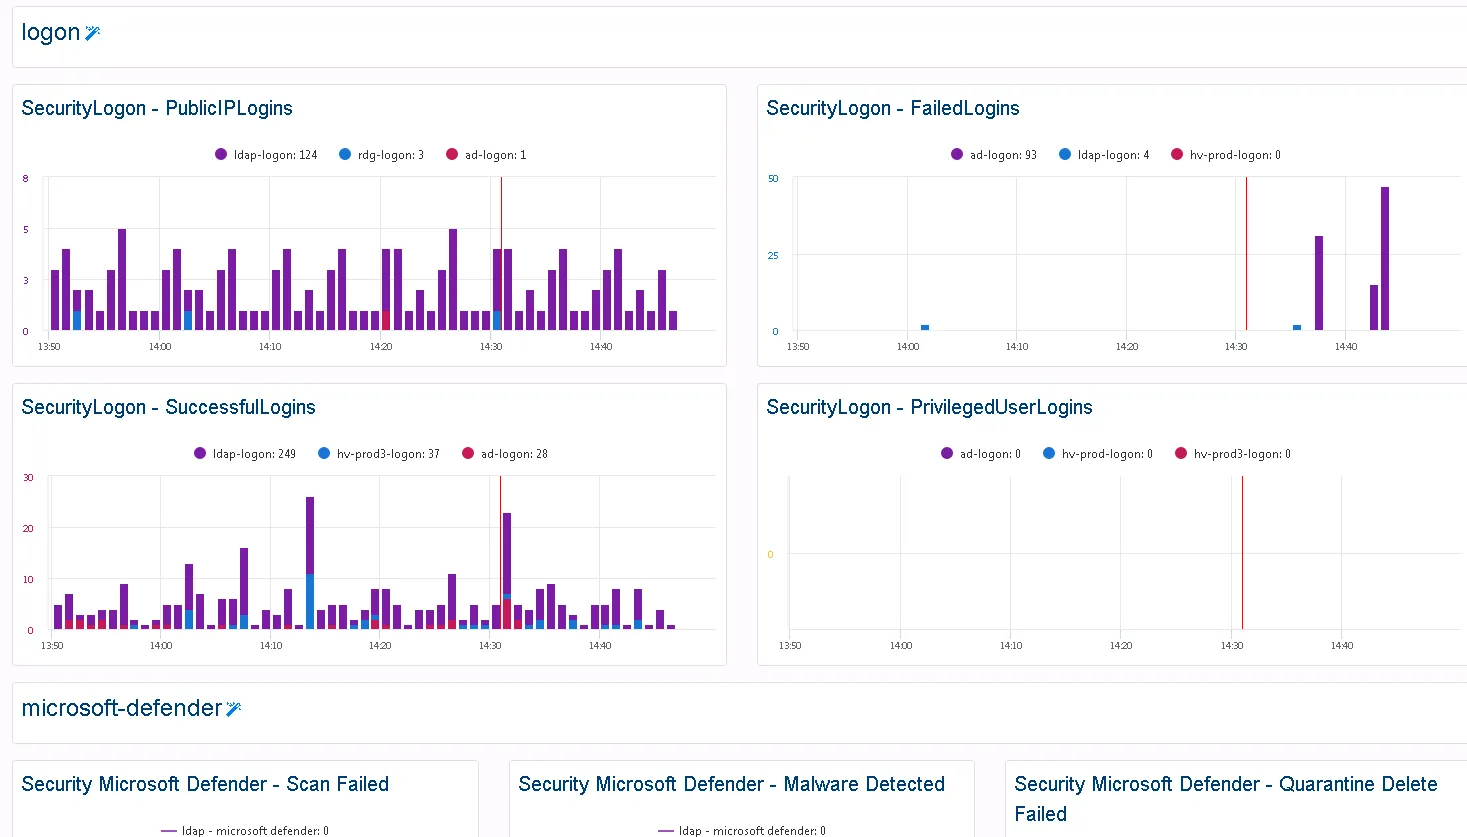
Log management and security event monitoring with ServicePilot allow you to send and process all logs produced by your applications and infrastructure. You can observe your logs in real time in the event tray, create alerting rules or use the dashboards to analyze your logs over time.
