Operational management
Manage data
ServicePilot Agents collect data or are sent data to be added to the ServicePilot database. The ServicePilot configuration determines what needs to be retained and for how long. Depending on the source of monitored data, further calculated statistics may be stored.
Example:
A server is queried to obtain disk size and disk bytes used. Using this information a disk usage percentage is calculated and stored in the database.
Monitoring periods
By default ServicePilot will query and store data all the time. It is possible to modify this by using monitoring policies which include time periods over which to collect data.
Example:
Apply a monitoring policy to a view containing all resources on a site. This monitoring policy includes a time period definition indicating that monitoring should only take place during open hours for the business. Outside of this time, the site’s resources will not be monitored and their state will be unknown.
- First define a time period.

- Then use this time period in a Policy.
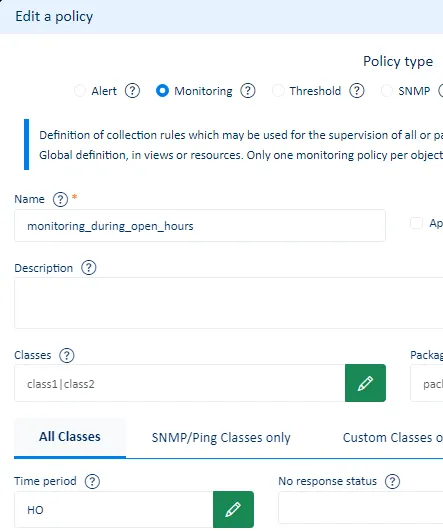
It is often useful to define monitoring periods when elements are known to have down time for maintenance or scheduled reboots.
Manage objects
Although maintenance times or scheduled reboots might happen at known times, ad-hoc management of resources might be needed to stop alerting issues that are being worked on.
Example:
A network interface is causing problems and has been taken out of service until the issue is resolved. The ServicePilot alert for this interface should be hidden.
It is possible to unmanage an individual object or a whole part of the monitored hierarchy by selecting a view. Access to the unmanage function is available in the view hierarchy or the status list.
Access Unmanage object from the view hierarchy
- As a user with operator privileges, navigate the view sub-menu until the object you wish to unmanage is open.
- Click on the Manage button.
Access Unmanage view from the view hierarchy
- As a user with operator privileges, navigate the view sub-menu until the view you wish to unmanage is open.
- Click on the View information icon.

- Click on the Manage button.
Access Unmanage from status lists
- As a user with operator privileges, click on Status.
- Select Resource, Object or View from the Status sub-menu depending on the component you wish to unmanage.
- Select one or more elements to unmanage and click on the orange Manage/Unmanage icon.

Manage or unmanage items
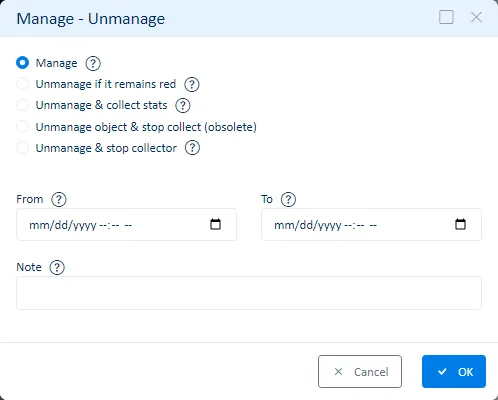
Once you open the management dialog, you can choose to manage (restart monitoring) or unmanage (stop monitoring) the element you selected. If you selected a view then this will affect the view and all sub-elements.
When unmanaging an element, you can also ask ServicePilot to stop storing data for the items in the database. If you only unmanage the element, then monitored indicators will still be retreived and stored but the status of the items will be set to unknown. If you unmanage and stop storing data, the objects are no longer counted towards license usage; they become free objects.
If you want to start the operation in the future or also say when ServicePilot should start monitoring again, then you can fill in the date-time fields. These are optional as the default action is to stop or start the operation immediately.
A note can be added so that users of ServicePilot can understand why this action was performed.
Manage / Unmanage API
Resource, view and object management status can be changed via an API request. See Manage / Unmanage API for details.
Delete objects
Although rarely needed, it is possible to remove objects from ServicePilot configuration. Only objects that where auto-created by ServicePilot can be removed in this way. To stop monitoring devices, it is usually a ServicePilot admin user that will delete the resource from the configuration or change the resource parameters to stop monitoring a particular element.
Deleting an object will not remove historical data associated with this object from the database. The object will still be shown in dashboards that query information while the object was still present.
Note that if an object is deleted, it might re-appear if the component is still present when the next discovery script runs. In this case the object should be removed by changing the resource parameters, and if that is not possible then by unmanaging the object.
Example:
ServicePilot is monitoring a server with multiple disk volumes. One of the disk volumes is removed permanently. The object can be deleted as it will not re-appear later.
Delete an object from the view hierarchy
This operation is only possible for objects that where auto-created by ServicePilot.
- As a user with admin privileges, navigate the view sub-menu until the object you wish to delete is open.
- Click on the Delete Object link.
Re-load a custom package
For On Premise installations of ServicePilot, when custom packages are added or modified, ServicePilot needs to be forced to re-load its configuation for these changes to be taken into account. This can be done in two ways:
- Using a user with admin privileges, log in to ServicePilot.
- Open SETUP > Parameters.
- Navigate to the Advanced tab.
- Click on the Reload button in the Packages section.
It is also possible to call this method using a ServicePilot API. See the Re-load the configuration API instructions.
Polling frequency
Many of the statistics collected by ServicePilot are obtained by polling devices every minute to obtain their current value or status. The collected statistics are defined in the provisioned packages and are affected by the resource configuration and any policies applied to the resources.
Polled data falls into three categories based on the collection type. The way in which the polling frequency is set depends on the collection type.
| Collection type | Ping | SNMP queries | Other queries |
|---|---|---|---|
| Change polling period | Monitoring policy | Monitoring policy | Monitoring policy |
| Change polling frequency | Monitoring policy | Monitoring policy | Resource parameter |
| Change discovery frequency | N/A | Monitoring policy | Resource parameter |
| Change No response confirmations | Monitoring policy | Monitoring policy | N/A |
| Change No response duration | N/A | N/A | Monitoring policy |
| No response status | Monitoring policy | Monitoring policy | Monitoring policy |
If a polled device does not respond then ServicePilot will transition the object to a no response pending state. Based on the number of times that this needs to be confirmed, the object will subsequently transition to a no response status.
The frequency of polling, the discovery frequency, the number of confirmations, the no response duration before a timeout is declared and the state into which the object is transitioned can all be modified by applying monitoring policies.
Ping polling
Once a minute the ServicePilot Agent will send out an ICMP Echo Request and wait for the response. If the ServicePilot Agent does not get a response then it will try a second time, within the same minute. If it does not get a response the object to be classified as unavailable.
SNMP Polling
Data may be obtained by querying devices using SNMP polling. In general, individual OIDs will be obtained once a minute while tables will be downloaded every 6 hours. The discovery table is downloaded at the discovery frequency and used to see if new equipment has been added. New objects are then created and subsequently monitored once a minute.
Example:
A switch is monitored to obtain data from a number of active Ethernet interfaces. Every 6 hours, the list of active interfaces is downloaded and previously inactive interfaces are added to the list of interfaces to be polled once a minute.
If configuration changes are made to resources then the associated discovery scripts are relaunched just after the changes have been applied.
An object obtaining data using SNMP Polling will by default pass into a no response pending state if it has not received any data within the minute without confirmation. This means that the object will go straight to no response status unless it receives data. If no data is received then an object will normally change state to unknown. The reason for using unknown rather than unavailable is that it is customary to have a Ping query going to the same device and only one of the objects needs to become unavailable or multiple alerts for the same issue would be shown.
Other polling
Many other methods of obtaining data by querying devices are used by the ServicePilot Agents. For example, Windows WMI queries, TCP checks, SQL queries and web page queries amongst others.

The minimum polling frequency is still 1 minute but it is common to poll elements less often. Note that although the polling frequency may be set, this does not allow you to specify when each poll will take place. For this reason setting a large polling frequency value does not make much sense as you will not know when during the day this might happen.
The no response state for the object will be set after a number of minutes during which no data has been sent between the ServicePilot Agent and ServicePilot.
When the object is determined to be in a no response state, the status of the object will change to unknown or unavailable depending on the type of object as defined in the package.
For example, a web check object will be classified as unavailable if no data is received for an hour.

A server disk object will be classified as unknown if no data is received for 10 minutes.

Event data
Some data that ServicePilot receives might be based on unsolicited events. For example a syslog message or an SNMP Trap is sent to a ServicePilot Agent.
This type of data is associated with the resource that was used to configure the ServicePilot Agent to accept the data. However, the data is not stored as indicator data in objects. Instead the events are stored in databases based on the type of data (Syslogs, SNMP Traps, VoIP call records). Dashboard are then made available to view this event data in standard ways. Custom queries might be added to filter the data further or show the information in completely new ways.
Data retention
ServicePilot keeps data for a limited period of time to limit disk space requirements and manage the speed of data queries. Numerical indicator data can be summarized and kept for longer but as averages, minimums and maximums of the real collected data. It is therefore possible to create a graph of an indicator by looking at only the daily averages over a year. If you then zoom in to a smaller time span, you could see hourly averages but only for the last 3 months or quarter hour averages for the last month or every minute of data but only for the last week.
Other kinds of data cannot be compressed in this way and so the data is kept for less time. It is also a far more costly operation to query this data, so selecting a shorter time span will return results quicker.
Some data is kept in the database but no history is maintained. For example the current state of all of the objects and inventory data.
ServicePilot administrators can change the data retention period per data collection by setting the corresponding parameter in the storage.conf configuration file and restarting ServicePilot and it’s database.
When querying data using the Data explorer or APIs only the root collection name is used. Summary data is automatically substituted based on the timespan selected.
The table below indicates the default data retention period per collection in days.
| Collection name(s) |
Description | Event or per minute |
Quarter hour summary |
Hour summary |
Six hour summary |
Daily summary |
|---|---|---|---|---|---|---|
| objectstatus | Object Status: The current status of Objects, Views and Resources | - | - | - | - | - |
| events(q/h/s/d) | Events: ServicePilot internal status changes and alert events | 365 | 365 | 365 | 365 | 365 |
| voip | VoIP: Call information and call quality records | 365 | - | - | - | - |
| syslog(q/h/s/d) | Syslog: Syslog messages received after filtering | 30 | 30 | 30 | 30 | 30 |
| traps(q/h/s/d) | Traps: SNMP Traps received after filtering | 30 | 30 | 30 | 30 | 30 |
| apptrace(q/h/s/d) | Apptrace: Summarized application traces | 30 | 30 | 30 | 30 | 30 |
| apptracespan | Apptracespan: Application trace span details collected from each collector | 3 | - | - | - | - |
| apptraceid | Apptraceid: Application trace details linking all spans of the same trace | 3 | - | - | - | - |
| nettrace(q/h/s/d) | Nettrace: Layer 3 TCP and UDP connections captured from ServicePilot Agents or IPFIX sources | 30 | 30 | 30 | 30 | 30 |
| objectsl(q/h/s/d) | Object SL: Object, View and Resource Availability and Performance metrics | 365 | 365 | 365 | 365 | 365 |
| inventory | Inventory: Current ServicePilot Agent and Endpoint Agent server inventory | - | - | - | - | - |
| objectdata(q/h/s/d) | Object Data: Object indicator data and summaries | 30 | 30 | 365 | 365 | 365 |
| objectlog(q/h/s/d) | Object Log: Log data associated with Objects | 30 | 30 | 30 | 30 | 30 |
| replay | RUM Replay: User web page interaction replays | 3 | - | - | - | - |
| keyvalue | Additional data: Additional data associated with other collections | - | - | - | - | - |
