Application Observability
The Pillars of Observability
Observability is essential to guarantee the reliability, performance and resilience of applications and infrastructures. It enables teams to proactively diagnose and resolve application problems, by collecting and analyzing data from various sources, such as metrics, traces and logs.
In the context of modern application development, observability refers to the collection and analysis of this data to provide detailed information on the behavior of applications. It is essential to today's dynamic architectures and multi-Cloud computing environments, enabling software engineering, IT, DevOps and SRE teams to collaborate in making quick decisions based on telemetry data.
The ServicePilot platform provides a comprehensive set of observability and APM (Application Performance Monitoring) features to monitor, troubleshoot and optimize the entire lifecycle of digital services. By combining multiple data sources (metrics, traces, logs, network flows, user data, infra...), the web interfaces provide a unified, correlated view of your systems / applications.
In order to unify the 3 dimensions of metrics, traces and logs, ServicePilot uses the five main types of monitoring to offer complete application observability:
1. Synthetic Monitoring
This type of monitoring simulates user paths using scripts or robots. It enables continuous testing of service availability, latency and functional behavior, independently of real traffic.
Objective: Test to detect problems before they affect users.
2. Real User Monitoring (RUM)
RUM collects data directly from real users' browsers or mobile applications. This enables us to understand their experience (loading times, JS errors, slowness, geolocation) in the real context of use.
Objective: Observe the impact of application performance on end-users.
3. Tracing (Distributed Tracing)
Distributed tracing tracks calls between microservices or application components, precisely measuring latency and dependencies. This helps identify bottlenecks or failing services.
Objective: Understand the transactional performance of a complex system.
4. Application Flows
Observation of network flows on servers or hosts provides visibility of inter-application traffic, exchanged volumes, network response times and suspicious behavior.
Objective: Visualize connectivity, optimize network performance and reinforce security.
5. Application Logs
Centralized analysis of logs (system, application, security...) helps diagnose incidents, enrich alerts or investigate abnormal behavior.
Objective: Provide a contextual and detailed history of events.
Why combine these approaches?
Each pillar covers a specific facet of the digital environment. By combining them, ServicePilot enables:
- Intelligent data correlation
- Proactive anomaly detection
- Fast, relevant RCA (Root Cause Analysis)
- User experience-oriented observability
Synthetic Monitoring
What is Synthetic Monitoring?
Synthetic Monitoring is a monitoring technique that simulates one or more user actions on a website, independently of real traffic. Testing critical pages or user paths at regular time intervals enables you to monitor the availability, performance and application performance of Web services.
Synthetic Monitoring Implementation
ServicePilot offers several packages for implementing synthetic monitoring tailored to your needs:
ServicePilot webcheck - HTTP(S) Check
The user-webcheck package enables you to monitor server responses using an HTTP(S) query issued by a ServicePilot Agent:
- Collects HTTP code, response time, SSL certificate information.
- Supports GET/POST requests, with customized headers, expected HTTP code...
- Extracts numerical data from the page (e.g. number of elements, counter value).
Although seemingly basic, this package can become a powerful monitoring tool when deployed strategically. By increasing the number of test points (via ServicePilot Agents positioned in different geographical areas, behind proxies, or on networks with variable latency), it is possible to obtain a fairly realistic and distributed view of the user experience.
ServicePilot web-scenario - Multi-step Scenarios
The user-web-scenario package allows you to monitor server response times via a series of HTTP(S) requests issued by the ServicePilot Agent. Each step of the scenario can also be customized as required.
All requests are executed by the ServicePilot Agent at regular intervals, providing continuous monitoring of performance.
Integration of External Functional Tests
To complement the native packages, ServicePilot offers various standard packages for integrating functional test results from third-party tools. These results can be fed back into ServicePilot in the form of time-stamped reports, enriching dashboards with automated test data.
| 3rd Party Software | Description | ServicePilot Packages |
|---|---|---|
| Lighthouse | Automated auditing tool developed by Google to evaluate the performance, accessibility, SEO and best practices of web pages. | Lighthouse Integration |
| Puppeteer | Node.js library for automating a Chrome or Chromium browser via a high-level API, even in SPAs and on dynamic content. It can be used to emulate complex scenarios involving navigation, clicks, input, delays and screenshots. | Puppeteer Integration |
| NightWatchJS | E2E framework based on Node.js and Selenium. Ideal for validating critical flows with assertions (presence of text, HTTP status, completed fields, etc.). | NightWatchJS Integration |
| Playwright | Cross-browser solution for testing on Chrome, Firefox, Safari. Supports parallel testing, visual assertions and rich interactions (drag & drop, uploads...). | Playwright Integration |
| SikuliX | Uses visual recognition to automate GUI-based interactions. Very useful when DOM elements are inaccessible or dynamic (ideal for legacy or non-HTML applications). | SikuliX Integration |
Synthetic Monitoring Data Visualization
ServicePilot offers standard dashboards, with consolidated or individual views of data under the DASHBOARDS section in User Experience > Resources > Web-Scenario or WebCheck.
Synthetic Monitoring data from third-party tools are centralized in dedicated dashboards under the DASHBOARDS section in Appmon > Resources > [package name].
Real User Monitoring (Web RUM)
What is Real User Monitoring?
Real User Monitoring (RUM) enables you to observe the performance and behavior of your web applications' real users, directly from their browsers. Unlike Synthetic Monitoring, which relies on simulated tests, RUM measures the user experience as it actually is, taking into account network conditions, terminal type, geography and the client environment.
With RUM, ServicePilot collects valuable data such as:
- Page load times
- JavaScript errors encountered
- Network and application performance
- User geolocation
- Types of browsers, OS, and screen resolutions
This enables us to understand, measure and improve the true user experience on an ongoing basis, from both a technical and ergonomic point of view.
What is RUM Session Replay?
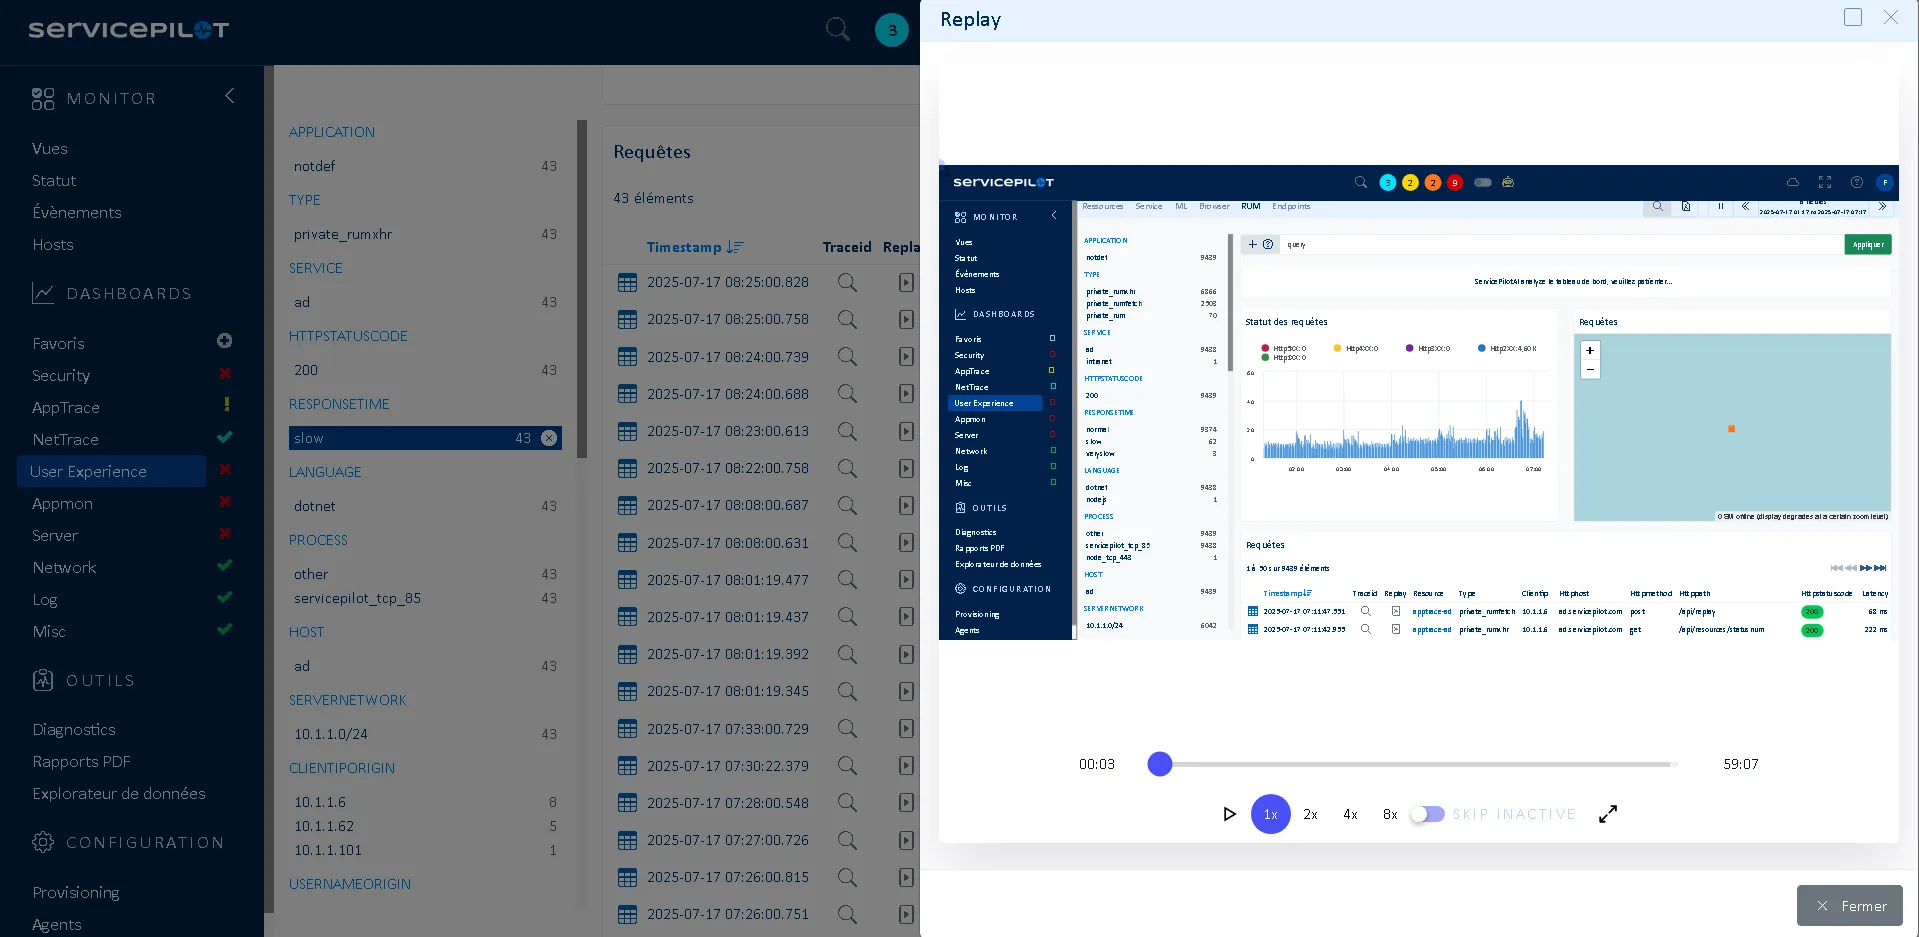
Session Replay lets you record and replay user interactions with your web application such as clicks, mouse movements, navigation and errors. It complements Real User Monitoring by providing a visual player for behavioral analysis of the user experience.
This makes it possible to revisit a user's journey and path to effectively diagnose usability problems, performance issues or functional bugs.
ServicePilot RUM Script Implementation
To collect Real User Monitoring (RUM) metrics on your web pages, you need to integrate the ServicePilot RUM script.
Depending on your environment, several integration methods are possible:
- Java application servers (Tomcat, Jetty). Use a dedicated ServicePilot plugin to automatically inject the RUM script into the HTML responses generated by your applications. No manual code modification is required. This enables seamless, centralized integration into classic Java Web environments, based on JSP, servlets or frameworks such as Spring MVC.
- Web servers / Proxies (Apache, NGINX, IIS...). Configure your servers or proxies to modify the HTML pages served, by dynamically injecting the RUM script. This method may be preferable when you cannot modify the application code but control the web delivery layer. For example, IIS allows you to use the URL Rewrite extension with an HTML injection module.
- Static web pages or SPA applications. Manually add the RUM script to the source code of your web pages, ideally in the <head> section. This is suitable for static HTML sites, Single Page Applications (React, Angular, Vue.js...) or CMS integrations (WordPress, Drupal...). Manual insertion into the code also enables fine instrumentation, page by page or conditional depending on the environment.
Where to get the RUM script?
Detailed instructions for RUM instrumentation are available from the ServicePilot interface under the CONFIGURATION section in Parameters > APM rules > RUM instrumentation. Here you will find the ready-to-use script, plus configuration options tailored to your specific use cases.
Activating Session Replay
Once the corresponding option has been activated in the RUM JavaScript configuration, the updated script deployed on the targeted pages will collect sessions from users of the supervised application.
RUM & Session Replay Data Visualization
The data collected is available from several ServicePilot interfaces, offering both global dashboards and dedicated interfaces for contextualized diagnosis.
Standard ServicePilot RUM dashboards with consolidated or individual views are available under the DASHBOARDS section in User Experience > Rum.
When looking at RUM Requests Details, the Replay column contains an icon when a Session Replay is available.
Application Traces
What is Application Tracing?
In dynamic architectures based on microservices and distributed components, understanding the complete path of a user request through the application can be a major challenge. Application traces allow you to track each request from the frontend to the backend, recording its path through all the services, APIs, databases, and hosts involved. It provides a detailed, chronological map of the exchanges between components.
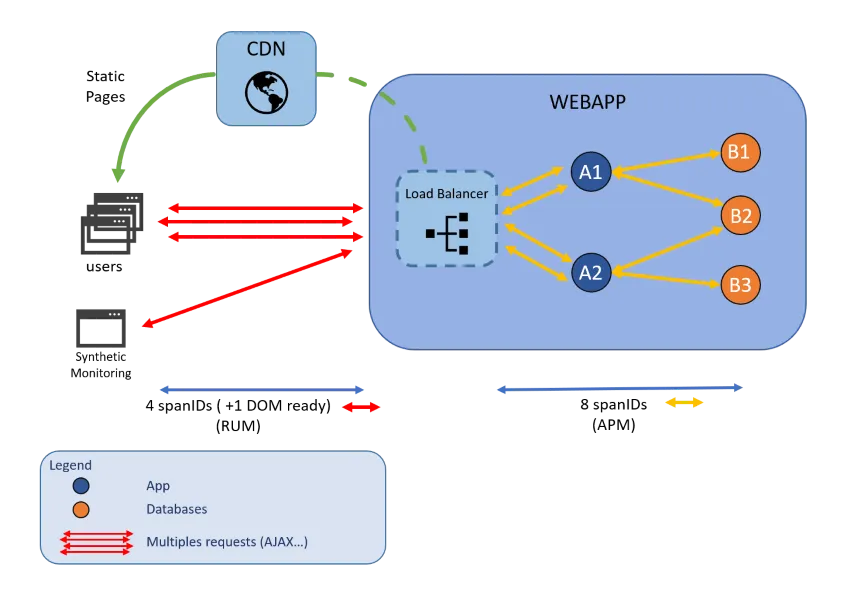
In an environment composed of dozens or even hundreds of microservices, each user action (such as loading a page or validating a form) can trigger cascading calls between services. Static pages can be served by CDN, requests can depend on sub-requests in databases... Without distributed tracing:
- It is almost impossible to identify the cause of a slowdown or failure
- Intermittent errors often remain invisible
- The team wastes valuable time searching for the right faulty service
Why are application traces essential?
Thanks to AppTrace technologies, it is easy to monitor:
- Client/server relationships (who calls whom)
- How long each step of a request takes
- Where slowdowns or errors occur in the execution path
You can view the complete chain of execution for a complex transaction and quickly isolate:
- Slow or overloaded services
- Faulty external dependencies
- Timeouts or blocked calls
Collecting APM Traces in ServicePilot
Application instrumentation is an essential step in enabling distributed tracing (APM) and collecting accurate traces from your applications. With ServicePilot, this can be fast, flexible and adaptable even in complex environments.
If an application is already instrumented with an Open Source tracing standard such as OpenTelemetry, Datadog or Zipkin, ServicePilot can integrate natively to collect APM traces from the existing instrumentation.
If the application is not yet instrumented:
- Administrators can configure their application to export metrics, traces and logs using OTPL (OpenTelemetry Protocol) over http/protobuf to a ServicePilot Agent where supported. See application documentation for support.
- Administrators can inject OpenTelemety or Datadog Auto-instrumentation libraries to send metrics, traces and logs to a ServicePilot Agent. See the OpenTelemety or Datadog Auto-instrumentation documentation for configuration.
- Developers can use OpenTelemetry SDKs to instrument their applications to send metrics, traces and logs to a ServicePilot Agent.
Appropriate ServicePilot configuration is required to open the APM data listening ports and APM rules to categorize the APM data received:
| 1. Create an Auto-provisioning rule from the ServicePilot interface under the CONFIGURATION section in Settings > Auto-provisioning |
| 2. Enable the necessary AppTrace option by entering the collection ports |
| 3. Instrument your application to send APM to a ServicePilot Agent. See below for details. |
| 4. Finally, create an APM Rule from Settings to refine the application definitions and instrumentation details |
APM Instrumentation Mode by Language
There are two levels of instrumentation depending on technical constraints and your level of control:
-
Auto-instrumentation
- The operator manually configures the command line and environment variables.
- The Agent then automatically injects the APM libraries without modifying the source code.
- Suitable for controlled or containerized Windows and Linux environments.
-
Manual
- Instrumentation is directly integrated into the source code via SDKs or wrappers.
- Useful for specific environments or languages such as C++, for total control over what is traced.
ServicePilot supports several languages depending on the desired instrumentation mode:
| Language | Auto-instrumentation | Manual |
|---|---|---|
| .NET | ✓ | ✓ |
| Java | ✓ | ✓ |
| Node.js | ✓ | ✓ |
| Python | ✓ | ✓ |
| PHP | ✓ | ✓ |
| Ruby | ✓ | ✓ |
| Go | ✓ | |
| C++ | ✓ | |
| Custom | ✓ |
For languages not listed or cases not shown in the table, please contact the ServicePilot support team.
ServicePilot allows you to choose an Open Source instrumentation library based on your preferred method of data collection:
- OpenTelemetry
- Datadog
- Zipkin
Instrumentation by Tracing Framework
Instrumentation with OpenTelemetry
OpenTelemetry also known as OTel, is a vendor-neutral Open Source Observability framework for instrumenting, generating, collecting, and exporting telemetry data such as traces, metrics and logs. APM data can be sent via OTel collectors to collate and modify the data before being directed on to ServicePilot Agents using OTPL over http/protobuf or Zipkin/HTTP protocols.
Automatic OpenTelemetry Instrumentation is available for a number of languages with libraries and code documented from the OpenTelemetry web site.
- Select APM Ports for OpenTelemetry collection: 4318
- For the libraries that do not support centrally provisioned instrumentation, follow the OpenTelemetry documentation to send APM traces to the ServicePilot Agent on port 4318
Instrumentation with Datadog
ServicePilot Agents can receive APM Traces and metrics from Datadog Tracing Libraries.
- Select APM Ports for Datadog collection: 8125, 8126
- For the libraries that do not support centrally provisioned instrumentation, follow the Datadog documentation to send APM traces to the ServicePilot Agent on ports 8125, 8126
Instrumentation with Zipkin
Zipkin is a distributed tracing system. It helps gather timing data needed to troubleshoot latency problems in service architectures. ServicePilot Agents act as Zipkin Collectors for traces sent from application code instrumented using Zipkin instrumentation librairies or by manually sending data using the Zipkin/HTTP protocol.
Zipkin Tracers and Instrumentation documents libraries supporting the instrumentation of application code to send traces to a ServicePilot Agent.
- Select APM Ports for Zipkin collection: 9411
- Follow the Zipkin documentation to send APM traces to the ServicePilot Agent on port 9411
APM Trace Data Visualization
The collected data is available from several ServicePilot interfaces, offering both global dashboards and dedicated interfaces for contextualized diagnosis.
Standard APM Dashboards
The standard dashboards for APM traces are available with consolidated or individual views under the DASHBOARDS section in AppTrace > AppService or AppHost or AppSummary depending on the desired level of granularity.
| The collected data can be viewed globally by selecting the desired category. |  |
| The data can also be viewed for a specific item in a category. | 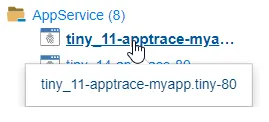 |
Further Interfaces for APM Traces
Further interfaces allow for granular exploration of requests under the DASHBOARDS section in or AppTrace > Requests, AppTrace > Applications, AppTrace > L7 Map or AppTrace > Profiler.
When the Traceid column contains a magnifying glass icon, you can drill down to the APM trace to view the transaction details for a query.
The Requests AppTrace page provides a detailed analysis of application transactions. The data presented offers a precise analysis of application performance and behavior, including the number of requests per minute per transaction, user satisfaction, and other application metrics.
The L7 Map AppTrace page provides a relational display of your various systems by section. It allows you to identify the various problems that could be encountered by the monitored applications. You can then use the architecture display to quickly find which server or service is causing the incident and resolve the problem as quickly as possible.
Application Network Flows
What are Host Network Flows?
NetTrace is ServicePilot's technology that allows you to capture and analyze in depth the incoming and outgoing network exchanges of a machine (Windows / Linux / IBM z/OS). By monitoring the network flows of several servers, you can observe the exchanges between groups of hosts and between the application components of systems.
By monitoring network flows on servers and/or containers, you can analyze:
- Who is talking to whom?
- On which ports and protocols?
- How often?
- With what data volumes...
The ServicePilot Agent captures IP flows and produces structured network conversation summaries in addition to detailed real-time interfaces. The web interfaces provide clear and interactive visualizations of network communications within infrastructures.
What is it used for?
NetTrace is an application-oriented network visibility system tool that allows you to:
- Map dependencies between applications, services, servers, or microservices
- Identify problems: latency, saturation, TCP retransmissions, errors, etc.
- Detect abnormal or suspicious behavior: unexpected exchanges, non-standard ports, outbound traffic, etc.
- Validate the compliance of network flows (with regard to security rules, segmentation, firewalls, or trusted zones)
- Standardize the monitoring of system flows regardless of the hosting choice (Cloud, Hybrid, On-Premise)
Collecting Host Network Flow Data
To collect network traces, simply install a ServicePilot Agent on the Hosts to be monitored. Then, create an auto-provisioning rule checking the NetTrace box in the ServicePilot interface under the SETUP section in Parameters > Auto-provisioning.
Host NetTrace Data Visualization
The collected data is available from several ServicePilot interfaces, offering both global dashboards and dedicated interfaces for contextualized diagnosis.
Standard NetTrace Dashboards
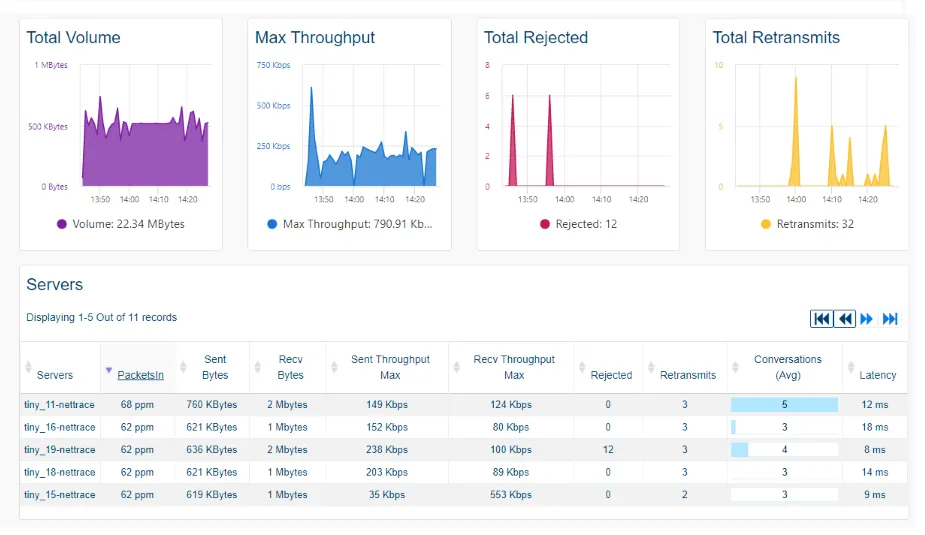
The standard dashboards for servers/applications flows are available with consolidated or individual views under the DASHBOARDS section in NetTrace > NetHost or NetProcess depending on the desired level of granularity.
Further NetTrace Interfaces
Further interfaces allow for granular exploration of conversations under the DASHBOARDS section in NetTrace > Conversations, NetTrace > L4 Map, NetTrace > Public or NetTrace > PCAP.
The Conversations NetTrace page allows you to view the various connections established between servers and/or applications monitored by ServicePilot Agents. The filter column allows you to target your searches by filtering by IP, port, protocol, etc. to view specific network traffic data (conversations, blocked connections, rejected connections, bytes per second, etc.).
The L4 Map NetTrace page creates a relational display of your various systems by section. It is possible to identify the various problems that could be encountered by the monitored systems on your network. You can then use the architecture display to quickly find which server or service is causing the incident and resolve the problem as quickly as possible.
The Public NetTrace page displays incoming/outgoing communications from/to public IP addresses.
The PCAP NetTrace page provides a precise and rapid visualization of all traffic passing through a network in real time. After selecting a network or host, it is possible to view the data and various associated links in several ways, in table form or in graphs, to obtain a real-time overview of the status of the selected network. This PCAP page also offers a very interesting feature that allows you to capture network traffic on a machine at any time and create a PCAP trace using various filters (IP, ports, protocol, etc.) that can be entered and automatically downloaded from the browser.
Application Logs
Application, system and security logs are an important source for in-depth incident diagnosis, or for enriching alerts with context. In a modern approach to observability, logs complement application traces, metrics and synthetic tests.
Why centralize logs in ServicePilot?
Centralizing logs in ServicePilot enables you to:
- Quickly search your system or application logs
- Correlate logs with network traces, alerts and events
- Have a detailed history of each technical event for audits, diagnosis or analysis of abnormal behavior
Log Collection from W3C Sources
ServicePilot supports the ingestion of W3C format logs, used in particular by web servers such as IIS or Apache. These logs can include information on HTTP requests, status, processing times and source IP addresses. If the site is already instrumented with RUM, W3C logs can be enriched with customized request headers to enhance user tracking.
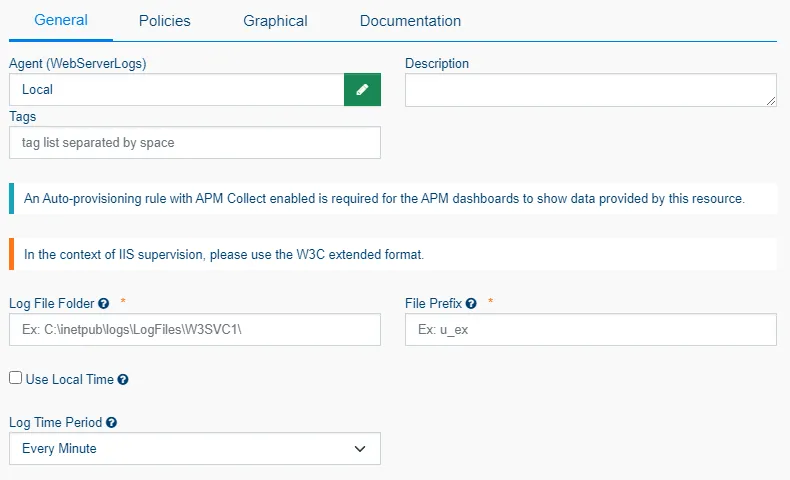
The apptrace-appservice-w3c package is designed to automatically collect W3C logs present on the server, according to a path defined during configuration.
In particular, it enables you to:
- View incoming HTTP requests
- Analyze response times
- Identify application errors (codes 4xx/5xx)
W3C Logs Data Visualization
The standard dashboards for W3C Logs are available with consolidated or individual views under the DASHBOARDS section in AppTrace > appservice-w3c depending on the desired level of granularity.
Further interfaces allow for granular exploration of requests under the DASHBOARDS section in AppTrace > Applications, AppTrace > Requests or AppTrace > L7 Map.
