ServicePilot Provisioning
To monitor equipment with ServicePilot, the tool needs to be configured to tell it what to do. This involves provisioning ServicePilot to monitor resources using predefined packages. Resources can be added to the configuration in a number of ways:
| Provisioning method | Description |
|---|---|
| Dynamic provisioning | If a dynamic provisioning rule has been added to the ServicePilot configuration then when a new agent is connected to the ServicePilot Manager, new resources will be added to the configuration automatically. See Add an Auto-provisioning rule. |
| Static provisioning | As soon as a new agent is discovered by ServicePilot, it may be used to provisioning new resources manually. See Add a manual resource below. |
| Programming/File provisioning | Resources, views and graphical elements can be managed using the ServicePilot API. See API for details. |
To understand this terminology, some of the concepts are detailed below. Regardless of the provisioning method used, you will start by creating a number of views in the ServicePilot configuration, into which you will place the resources you wish to monitor.
Provisioning by monitoring type
Depending on the type of monitoring required different provisioning procedures need to be followed.
| Monitoring | Details | Link |
|---|---|---|
| Network tracing (NPM) | ServicePilot Windows, Linux and z/OS Agents capture network flow details to create flow diagrams. Application tracing and Real User Monitoring can add to this same datastore. | Network tracing (NPM) provisioning |
| Application tracing (APM) | Web application and client database libraries are configurable to send web and database request details to ServicePilot Agents. Network tracing and Real User Monitoring can add to this same datastore. It is possible to instrument automatically the application code depending on the language and libraries used. | Application tracing (APM) provisioning |
| Real User Monitoring (RUM) | Web applications can include ServicePilot RUM browser JavaScript to report web requests to a ServicePilot Agent. Network and Application tracing can add to this same datastore. | Real User Monitoring (RUM) provisioning |
| Network Detection and Response (NDR) | If Network and/or Application tracing is collected then Network detection and response (NDR) can be activated to analyze traffic to detect possible attacks. NDR rules are then used to indicate outcomes for detected issues. | Network Detection and Response (NDR) provisioning |
| IP Address Management audits (IPAM) | IPAM scans are automatically enabled for the Default ServicePilot Agent. Other ServicePilot Agents can perform IPAM scans by manually adding a network-ipam resource. | IP Address Management (IPAM) provisioning |
| Inventory | Software and OS information will be captured on hosts with a ServicePilot Agent installed. An Auto-provisioning SP Agent rule with Inventory enabled is required. | Add an Auto-provisioning rule |
| Endpoint monitoring | Host, connectivity and media stream quality is collected on Windows workstations where a ServicePilot Endpoint is installed. An Auto-provisioning Endpoint Agent rule is required. | Add an Auto-provisioning rule |
| System monitoring | OS monitoring for Windows and Linux servers, including memory, CPU, network, process and service information. If a ServicePilot Agent is installed and an Auto-provisioning SP Agent rule with System packages is enabled then monitoring starts automatically. System resources can also be manually provisioned per host. | Add an Auto-provisioning rule or Add a manual resource |
| Windows Sysmon events | Windows Sysmon can be deployed automatically and Sysmon events sent to ServicePilot from a ServicePilot Windows Agent. | Windows Sysmon events provisioning |
| Windows Logon events | Capture Windows Logon events from Windows servers with a ServicePilot Agent installed. An Auto-provisioning SP Agent rule with Logon enabled is required. | Add an Auto-provisioning rule |
| Docker | Configuration of the ServicePilot Linux Agents to detect the presence of Docker and start monitoring using an Auto-provisioning SP Agent rule with Docker enabled. Docker resources can also be manually provisioned per host. | Add an Auto-provisioning rule or Add a manual resource |
| All other monitoring | Manually provisioned or API added resources for the equipment to monitor. | Add a manual resource |
Monitoring hierarchy
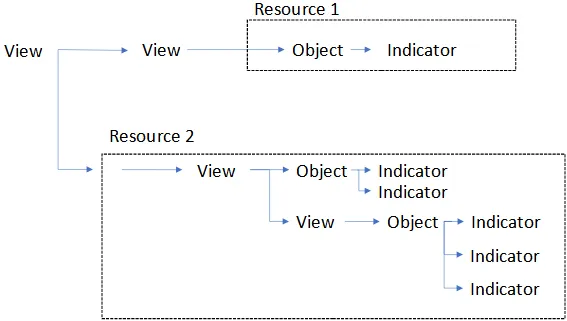
ServicePilot stores time series of data as indicators in objects. These objects are placed in a tree hierarchy of views originating from a root view called MAIN. Views can contain multiple items including other sub-views, objects as well as graphical elements and shortcuts to other parts of the view hierarchy. The monitored equipment is added to the configuration as resources based on the package templates.
Hierarchy of all views
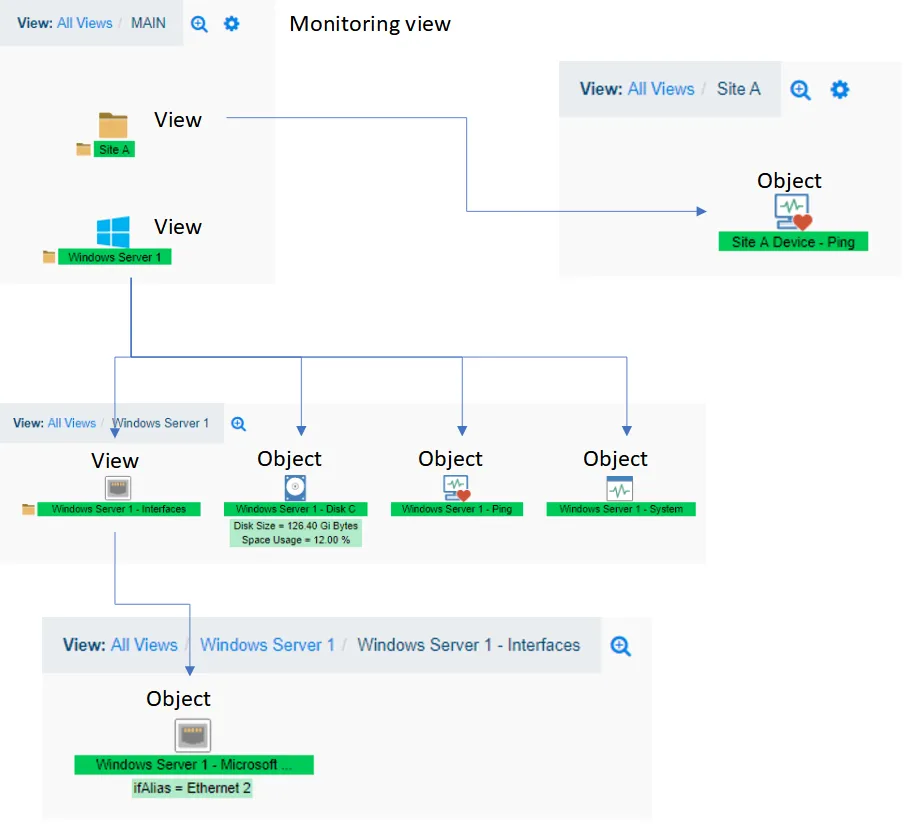
An example hierarchy of views and objects is presented below. A Site A view has been created in which resides an object named Site A Device - Ping. The MAIN view also includes a Windows Server 1 view containing objects and a sub-view containing more objects.
Object and indicators
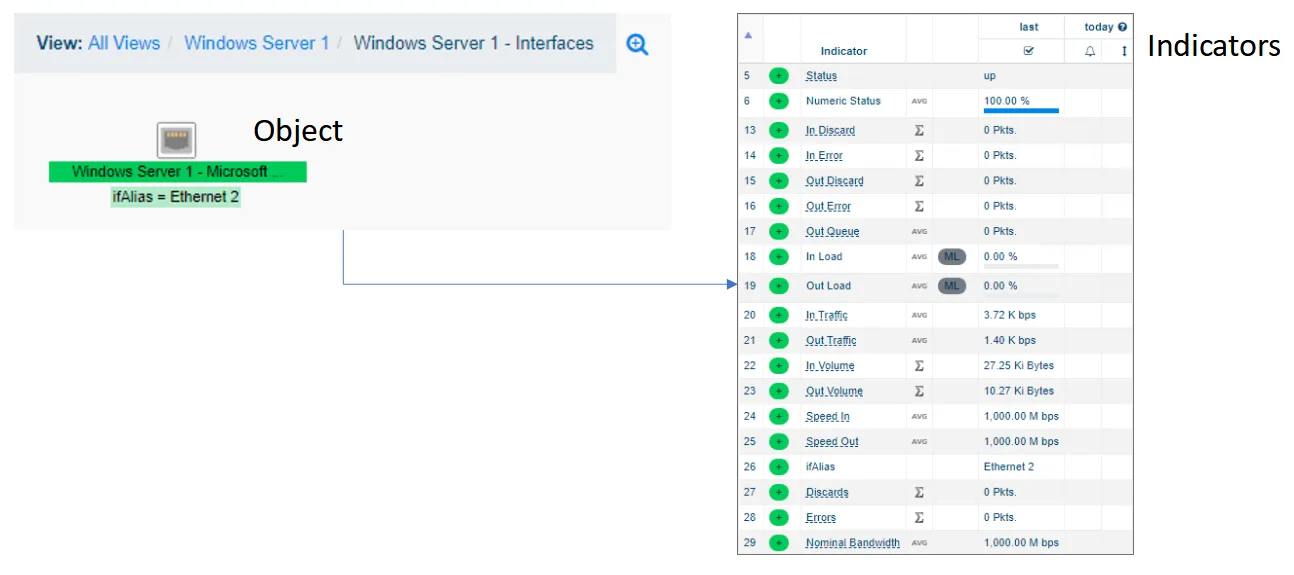
Each object contains one or more indicators. The indicator's values come from the monitored systems. Each object is based on a class that defines the type of object and therefore what indicators it will contain.
View configuration
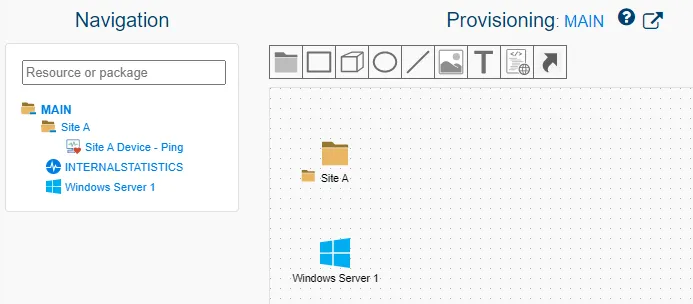
Before adding resources to monitor, start by creating some views in which to place the resources. These views will help categorize the devices monitored and group elements, maybe by technology or by geographic location. When resources are added to the configuration, they will include sub-views and objects of their own to complete the hierarchy of monitored elements.
Editing views
Add a view
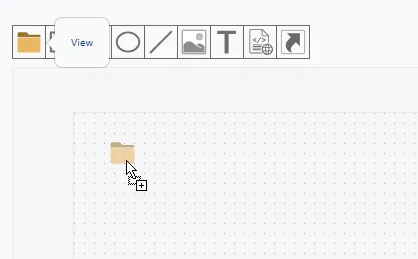
It is best to place your monitored resources in to views and sub-views so that they can be categorized and managed.
| 1. Using a user with administrative privileges, log in to ServicePilot |
| 2. Open SETUP > Provisioning |
| 3. Navigate the existing view hierarchy in the left hand pane and click on the view in which you wish to create your new view |
| 4. Drag and drop the view icon into the view pane |
| 5. Give the new view a unique name |
| 6. Click OK |
| 7. Finally, click Save all the changes |
Modify view
There are a number of ways to access view parameters. They can be reached via Provisioning > View editor > view icon > Properties, Provisioning > View editor > Properties for the current view and via Provisioning > Resources.
View settings can change:
- view visibility
- view geo location if, for example, the view represents a site
- view icon
- view position in its parent view
- view size
- view background color
- view display type
- the arrangement of icons inside the view
1. Access to the view parameters
| 1. Using a user with administrative privileges, log in to ServicePilot |
| 2. Open SETUP > Provisioning |
| 3. Navigate the existing view hierarchy in the left hand pane and click on the view which contains the view to change |
| 4. Click on the gear icon |
| 5. Click OK once changes have been made |
| 6. Finally, click Save all the changes |
2. Access to the view parameters from the gear
| 1. Using a user with administrative privileges, log in to ServicePilot |
| 2. Open SETUP > Provisioning |
| 3. Navigate the existing view hierarchy in the left hand pane and click on the view to change |
| 4. Click on the view properties icon |
| 5. Click OK once changes have been made |
| 6. Finally, click Save all the changes |
Manage resources
Once a view exists, a new resource can be placed inside it. Depending on the device to be monitored, it is possible to tell ServicePilot to automatically add resources whenever a new ServicePilot Agent contacts ServicePilot. In this case add an Auto-provisioning rule. Alternatively, add a manually provisioned resource for more complex scenarios.
Note: If the resource does not appear to collect any data when it is added, make sure that credentials and IP addresses are correctly entered and firewalls are not blocking the monitoring traffic.
SNMP polling and ICMP Ping testing can be performed from the Diagnostics ServicePilot web page.
The ServicePilot Agent can produce extended debug logs that might be useful to diagnose conectivity issues. See steps to enable ServicePilot Agent debug mode.
Auto-provisioning
Auto-provisioning is configured by creating auto-provisioning rules that will add resources to the configuration when new elements to monitor are discovered.
Add an Auto-provisioning rule
| 1. Using a user with administrative privileges, log in to ServicePilot |
| 2. Open SETUP > Parameters |
| 3. Click on Provisioning > Auto-provisioning |
| 4. Click on Add a rule |
| 5. Complete the Automatic provisioning rule dialog. Specify at least a Rule name and set the Discovery type based on the Agent installed |
| 6. Click OK |
| 7. Finally, click Save |
| Field | Description |
|---|---|
| Rule name | Unique descriptive name for the auto-provisioning rule |
| Enabled | Activate or suspend the creation of resources based on this rule |
| Discovery type | The type of Agent used to perform the discovery (see details below) |
| Host filter optional | Agent host name filter over which the rule will be applied or excluded. Example: (host*|server*) or !(host*|server*) |
| Destination view optional | View in which the discovered resources will be created. Using the {host} variable will automatically create a view by host in which the host's resources will be added. Example: MAIN/AutoProv/{host}. However, if the {host} variable is not used, all of the resources created by this rule will be placed in the same defined view |
| Automatic deletion (72h) | Delete the resource if no data is received for more than 72 hours |
Discovery type: ServicePilot Agent
Resource discovery by ServicePilot Agent will start monitoring elements as soon as a ServicePilot Agent is deployed on a host. Resource discovery is dependent on the platform; Windows or Linux. It is possible to specify the categories of resources that should be monitored.
| Category | Description |
|---|---|
| System packages | Based on the OS on which the ServicePilot Agent is installed, either a server-micrsoft-windows-sp-agent or a server linux-sp-agent package resource is added with default parameters. These parameters may then be manually edited per resource. |
| Inventory | Perform an inventory (OS, disks, processes, software installed) for the host on which the ServicePilot Agent is installed. The result of this inventory is available under TOOLS > Inventory > Agents. |
| Docker | Include a server-docker package resource for the Linux host on which the ServicePilot Agent is installed. |
| NetTrace | Allows for the collection of network traces (NetTrace technology requires a Host Full-Stack license for each host on which this is enabled). The result of the traces are shown under DASHBOARDS > NetTrace and statistics are also added to objects for each host in the Destination views defined by the auto-provisioning rule. |
| AppTrace | Allows for the collection of application traces (AppTrace technology requires a Host Full-Stack license for each host on which this is enabled). The result of the traces are shown under DASHBOARDS > AppTrace and statistics are also added to objects for each application in the Destination views defined by the auto-provisioning rule. |
| APM Ports | When AppTrace is enabled, listening port(s) need to be opened on a ServicePilot Agent to capture application traces and process statistics. To override the default listening ports, set the ports that the ServicePilot Agent will listen on. With the exception of UDP port 8125, any other port placed in the APM Ports field will listen for HTTP traffic and determine the type of data received for processing. The default listening ports are: UDP/8125 - StatsD listener, TCP/8126 - Datadog APM receiver, TCP/4318 - OpenTelemetry HTTP port, TCP/9411 - Zipkin HTTP collector. |
| NDR/HIDS | Network detection and response. NetTrace and/or AppTrace needs to be enabled to feed the NDR engine. See results under DASHBOARDS > Security. |
| Sysmon | Enable Windows Sysmon event collection. Log rules may be created to filter, mask and extract indicator data from Sysmon events. |
| Logon | Enable Windows Logon event collection. Log rules may be created to filter, mask and extract indicator data from Windows Logon events. |
Discovery type: Endpoint Agent
When ServicePilot Endpoint Agents are deployed, they will use this configuration to determine what actions they are to perform. Endpoint Agents collect Windows workstation OS inventory and system usage as well as traceroute connectivity details.
| Discovery type | Description |
|---|---|
| Traceroute | Perform a web based traceroute from the Endpoint Agent host to up to 5 web servers. |
Discovery type: RUM
A RUM discovery rule automatically monitors web pages that have been instrumented with ServicePilot RUM code. When RUM JavaScript is included in web pages, client browsers will send statistics to ServicePilot indicating the responsiveness of the source web site from a client's point of view. Resources will be added to ServicePilot for each RUM rule and script deployed. To enable RUM:
Install Agent code in the web pages served by a web server. See the RUM Agent documentation:
| 1. Using a user with administrative privileges, log in to ServicePilot |
| 2. Click on SETUP > Parameters > APM Rules |
| 3. Follow the instructions under RUM Instrumentation for manual or automatic RUM instrumentation |
| 4. Add an associated RUM auto-provisioning rule |
Add a manual resource
| 1. Using a user with administrative privileges, log in to ServicePilot |
| 2. Open SETUP > Provisioning |
| 3. Navigate the existing view hierarchy in the left hand pane and click on the view in which to add the new resource |
| 4. Select the type of monitoring package needed by category and use the filter to limit the options displayed |
| 5. Drag and drop a package into the central view editor |
| 6. Set the resource properties based on the package type selected. A unique resource name is always required as well as all fields highlighted with a (*). The resource will make use of the default Agent to obtain the data unless the Agent fields are completed with the agents from which the queries are to be made. The Ping SNMP Agent will be used for all Ping and SNMP queries while the Agent will be used for all other queries. |
| 7. To view package documentation, click on the Documentation tab |
| 8. Click OK |
| 9. Finally, click Save all the changes |
Note: many packages use SNMP queries to obtain information. You may need to specify an SNMP policy with the correct credentials to monitor the device. See the Policies documentation for details.
Edit a resource
| 1. Using a user with administrative privileges, log in to ServicePilot |
| 2. Open SETUP > Provisioning |
| 3. You have two different choices to edit a resource: |
| Option A | Option B | |
|---|---|---|
| Navigate to the existing view hierarchy in the left hand pane and click on the view containing the resource | At the left side of the screen, write in the searchbar the resource's name that you want to edit | |
| In the central view editor, select the resource that you want to modify | Click on the resource that you want to modify | |
| Press on the gear to change resource properties | ||
| 4. Set the resource properties based on the package type selected. A unique resource name is always required as well as all fields highlighted with a * . The resource will make use of the default Agent to obtain the data unless the Agent fields are completed with the Agents from which the queries are to be made. The Ping SNMP Agent will be used for all Ping and SNMP queries while the Agent will be used for all other queries. |
| 5. To view package documentation, click on the question mark next to the package name |
| 6. Click OK |
| 7. Finally, click Save all the changes |
IP Address Management (IPAM) provisioning
IP Address Management (IPAM) enables network scans from ServicePilot Agents to find other equipment within the same subnet as the Agent. This is enabled automatically on the ServicePilot Default Agent.
Change Default Agent
It is possible to change the ServicePilot Default agent. Note that this will change the ServicePilot Agent used for all resources where an Agent has not specifically been set. Make sure all resources are configured to use a specific Agent or the Default Agent before changing the Default Agent.
Enable IPAM for other Agents
To enable IPAM on other ServicePilot Agents, manually add a network-ipam resource selecting the correct ServicePilot Agent. Note that the ServicePilot Agents need to be in different subnets so that duplicate data is not returned.
Disable IPAM on Default ServicePilot Agent
For ServicePilot Cloud tenants, contact ServicePilot support.
For OnPremise installations of ServicePilot, add the following to the tenant.conf configuration file and reload the configuration:
ipamDefaultAgent: False
View IPAM information
The equipment discovered by doing IPAM scans is presented under TOOLS > Inventory > Network.
Shortcuts
Shortcuts are links to other objects and views in the monitoring hierarchy. They allow for the cloning of the link's destination status to the view in which the shortcut is placed.
Note: Users that are members of groups that have access to views containing shortcuts will be allowed to navigate to these shortcuts' destinations, even if these destinations are outside of the group's view access list. Users will be able to see all view, object and indicator data from the shortcuts' destinations.
Create a View shortcut
View shortcuts provide access to a destination view and all of its content. The resource name for the shortcut must be unique amongst all of the resource, object and view names.
A view shortcut could, for example, allow for resources to be visible in both a logical hierarchical grouping and also in views by geographic location. A server could be defined in a view for the server's site and a shortcut to the server added to a view containing all resources that relate to an application that the server hosts.
| 1. Using a user with administrative privileges, log in to ServicePilot |
| 2. Open SETUP > Provisioning |
| 3. Navigate to the view in which you wish to place the shortcut |
| 4. Drag and drop the name of a destination view from the left-hand Navigation hierarchy into the Provisioning pane |
Create a shortcut to a view that is inside resources
View shortcuts provide access to a destination view and all of its content. The resource name for the shortcut must be unique amongst all of the resource, object and view names.
As views that are part of resources are not listed in the left-hand Navigation hierarchy when editing your configuration, shortcuts to these views must be added by adding an object shortcut and manually entering the name of the view in the Object name field as the desgination of the shortcut.
| 1. Using a user with administrative privileges, log in to ServicePilot |
| 2. Open SETUP > Provisioning |
| 3. Navigate to the view in which you wish to place the shortcut |
| 4. Drag and drop an Object shortcut from the icon above the Provisioning pane into the Provisioning pane |
| 5. Enter the name of the destination view in the Object name field |
Create an Object shortcut
Object shortcuts provide access to a destination object. The resource name for the shortcut must be unique amongst all of the resource, object and view names.
Object shortcuts might be useful to create a view grouping together a number of monitored elements from different resources that comprise an application. Object shortcuts might also be used to link to objects deep in the monitoring hierarchy and make these particular elements more evident.
| 1. Using a user with administrative privileges, log in to ServicePilot |
| 2. Open SETUP > Provisioning |
| 3. Navigate to the view in which you wish to place the shortcut |
| 4. Drag and drop an Object shortcut from the icon above the Provisioning pane into the Provisioning pane and use the object list picker to set the destination Object name |
Perform a Ping or SNMP diagnostic test
The ServicePilot Agents can Ping and run simple SNMP polling requests to help verify that firewalls and devices are configured correctly to allow monitoring traffic. From the Diagnostics web page, make certain to select the correct ServicePilot Agent from which the tests will be performed. This should match the ServicePilot Agent selected when adding a resource.
| 1. Using a user with operator privileges, log in to ServicePilot |
| 2. Open TOOLS > Diagnostics |
| 3. Enter name of the ServicePilot Agent from which the test will be run and the destination IP address for Ping tests. For SNMP polling tests, complete the Agent, Profile SNMP and IP fields. Press the Apply button to use these values. |
| 3. To test, click on the Ping IP address link to run a Ping every 2 seconds. Click on the Information link to make sure that the device responds to SNMP queries. |
Obtain an SNMP query data dump
The ServicePilot Agent can create a SNMP query data dump by successively querying SNMP OIDs starting from a specified root in the SNMP MIB hierarchy. This log file can then be used to:
- Verify the structure and values of objects returned by SNMP queries
- Act as a basis for creating or updating ServicePilot packages by seeing what information is available
Run a ServicePilot Agent SNMP query data dump
Start by selecting which ServicePilot Agent will be used to perform the SNMP query that has access to the equipment.
| 1. Using a user with administrative privileges, log in to ServicePilot |
| 2. Open SETUP > Agents |
| 3. Click on the screen icon to bring up the Agent CLI |
4. Enter snmpwalk <IP_address> -oid:<OID_root> -policy:<SNMP_policy> to run an SNMP query data dump, where <IP_address> is the IP address of the equipment to query, <OID_root> is the root of the SNMP MIB hierarchy to start from (usually 1.3.6) and <SNMP_policy> is the ServicePilot SNMP policy to use when making the query. |
Where to find query logs
ServicePilot SNMP query logs are found on the server on which the ServicePilot Agent is installed. On this server look for the snmpwalk_<IP_address>.txt file.
| Windows | Linux |
|---|---|
| C:\Program Files\ServicePilot\ServicePilot ISM Enterprise\logs | /var/log/servicepilot |
Extended Agent debug logs
Enabling ServicePilot Agent extended debug logs, makes the Agent write more logs to a servicepilotagent.trace file. These logs may be useful to help diagnose a misbehaving ServicePilot Agent but also show more information about connections between the ServicePilot Agent and monitored devices. It can make clear if a password to access a database or a VMWare vCenter is not correct for example.
Activate ServicePilot Agent debug mode
Start by selecting which ServicePilot Agent will have debug mode enabled. Refer to your resources that are having issues to see which Agent they are using.
Enabling the ServicePilot Agent debug mode will write extensive logs to a trace file. Once these have been activated for enough time to capture the issue, remember to deacivate this extended debugging so as not to fill up disk space and degrade the performance of your server.
| 1. Using a user with administrative privileges, log in to ServicePilot |
| 2. Open SETUP > Agents |
| 3. Click on the screen icon to bring up the Agent CLI |
4. Enter debug y to enable extended debug logs. Once the issue has been captured, enter debug n to stop writing to the extended debug logs. |
Where to find debug logs
ServicePilot Agent extended debug logs are found on the server on which the ServicePilot Agent is installed. On this server look for the servicepilotagent.trace file.
| Windows | Linux |
|---|---|
| C:\Program Files\ServicePilot\ServicePilot ISM Enterprise\logs | /var/log/servicepilot |
