Getting Started
To start your monitoring project, you will need access to a ServicePilot server. There are two ways of deploying ServicePilot:
- Software as a Service: Cloud-based ServicePilot Web interface managed by ServicePilot Technologies that customers will connect to via the Internet. Only an agent needs to be installed to start monitoring.
- On Premise: Customers install the ServicePilot software on premise. Customers manage their own deployment and data.
ServicePilot SaaS platform
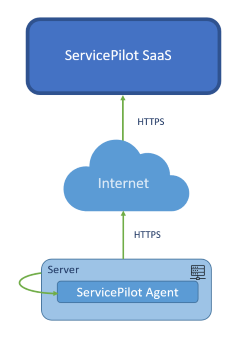
To use the ServicePilot SaaS platform, 3 steps are essential to get started:
- Create a ServicePilot account - to log in to the ServicePilot web pages
- Install a ServicePilot Agent - to collect data (downloadable from the ServicePilot web interface)
- Start monitoring equipment - by adding provisioning rules and resources to monitor your environment
ServicePilot OnPremise deployment
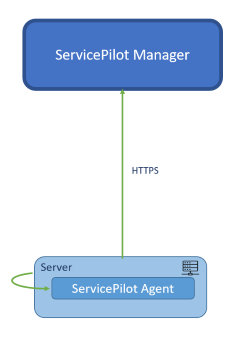
ServicePilot On Premise only requires a few steps to get started:
- Obtain the ServicePilot installer - by contacting ServicePilot Technologies to get the software
- Install ServicePilot - by following the installation guide
- Obtain a ServicePilot license - by contacting ServicePilot Technologies to get a trial license
- Start monitoring equipment - by adding provisioning rules and resources to monitor your environment
Set up a ServicePilot account
Before being able to access ServicePilot web pages, a customer account will be required. Go to the ServicePilot SaaS Login page and use the Sign up link to create an account.
Once you have your login Username and Password you can use these to open your ServicePilot web pages.
To manage your account and create other users and groups, see the Users documentation.
Install a ServicePilot Agent
There are a number of different ServicePilot Agents. Choose the ServicePilot agent you require, download and install the agent from the ServicePilot web pages.
| 1. Using a user with administrative privileges, log in to ServicePilot |
| 2. Click on Agents > Install an agent |
| 3. Select the Agent to install and follow the instructions under Get started |
ServicePilot Agents are explained in more detail in the Agents documentation.
Start monitoring equipment
A ServicePilot Agent may be able to collect data but ServicePilot still needs to be told what each Agent should do. There are two main ways in which equipment may be added to the configuration:
- Rules to provision resources automatically when equipment is discovered
- Adding resource configuration manually
The provisioning required will depend on the type of resource monitored. See package documentation for details when adding a resource manually.
ServicePilot provisioning is explained in more detail in the Provisioning documentation.
Add an Auto-provisioning rule
It is also possible to automatically monitor resources when new agents are deployed. Set up auto-provisioning rules to tell ServicePilot what package to use when adding a new agent and where to place the resource in the monitoring hierarchy.
| 1. Using a user with administrative privileges, log in to ServicePilot |
| 2. Open SETUP > Parameter |
| 3. Click on Auto-provisioning |
| 4. Click on Add a rule |
| 5. Complete the Automatic provisioning rule dialog. Specify at least a Rule name and set the Discovery type based on the Agent installed. |
| 6. Click OK |
| 7. Finally, click Save |
See Auto-provisioning for more details.
Add a manual resource
To monitor a device, pick one of the pre-configured packages and add it to the configuration by answering a few questions. These normally include the device IP address, which ServicePilot Agent to use to query this device and what sort of supervision is required.
| 1. Using a user with administrative privileges, log in to ServicePilot |
| 2. Open SETUP > Provisioning |
| 3. Select the type of monitoring package needed by category and use the filter to limit the options displayed |
| 4. Drag a package into the central view editor and let go |
| 5. Set the resource properties based on the package type selected. A unique resource name is always required as well as all fields highlighted with a *. |
| 6. To view package documentation, click on the Documentation tab |
| 7. Click OK |
| 8. Finally, click Save all changes |
Note: many packages use SNMP queries to obtain information. You may need to specify an SNMP policy with the correct credentials to monitor the device. See the Policies documentation for details.
See Add a manual resource for more details.
View data collected
Once equipment or resources are monitored, data is collected and can be viewed in different ways.
Monitoring
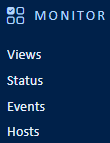
Real-time data and the current resource status can be viewed in different ways.
| Menu item | Data display |
|---|---|
| Views | The Views menu item shows data as a hierarchy of views that contain further views and objects and graphical elements. The objects contain indicators which store the data obtained. |
| Status | The Status menu item provides lists of resources, objects, classes and views by status |
| Events | The Events menu item shows the changes in status of the resources, objects, indicators and views |
| Hosts | The Hosts menu item allows you to view the status of hosts (data collected by source IP address / host name) |
Views
| Menu item | Data display | |
|---|---|---|
| Views | The Views sub-menu shows a graphical representation of views and allows for navigation through the view hierarchy | 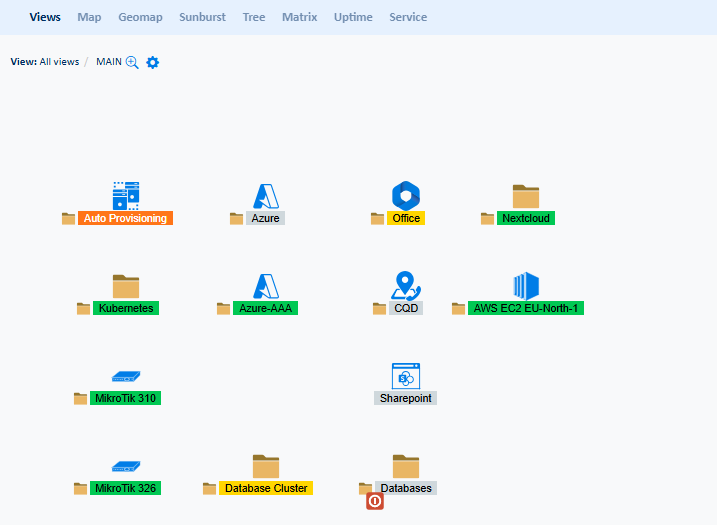 |
| Map | The Map sub-menu shows a tree indicating the position of different resource types based on the category of the resource selected | 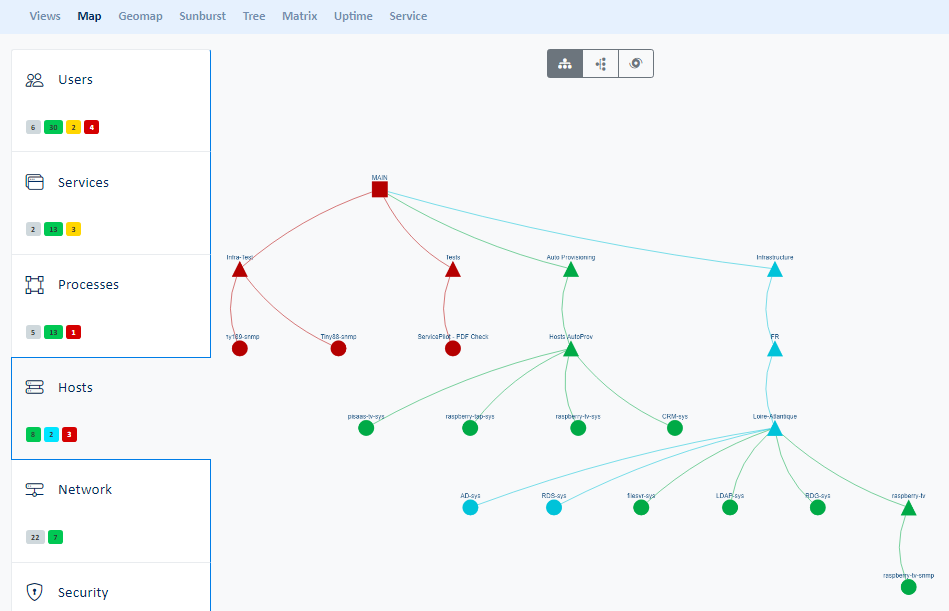 |
| Geomap | The Geomap sub-menu displays the different elements distributed on the map according to their geographic coordinates | 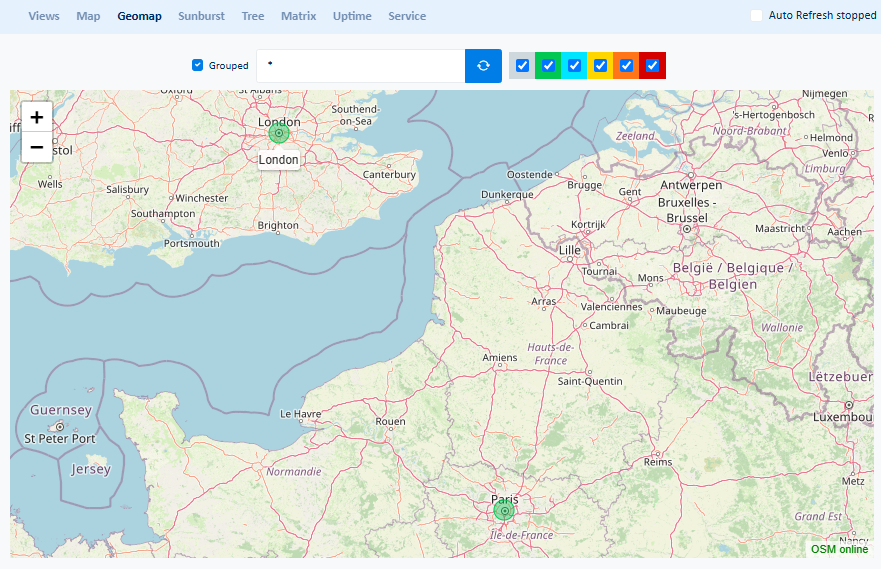 |
| Sunburst | The Sunburst sub-menu shows all of the view hierarchy starting from view level 1 at the core and fanning out to the highest view level on the edges | 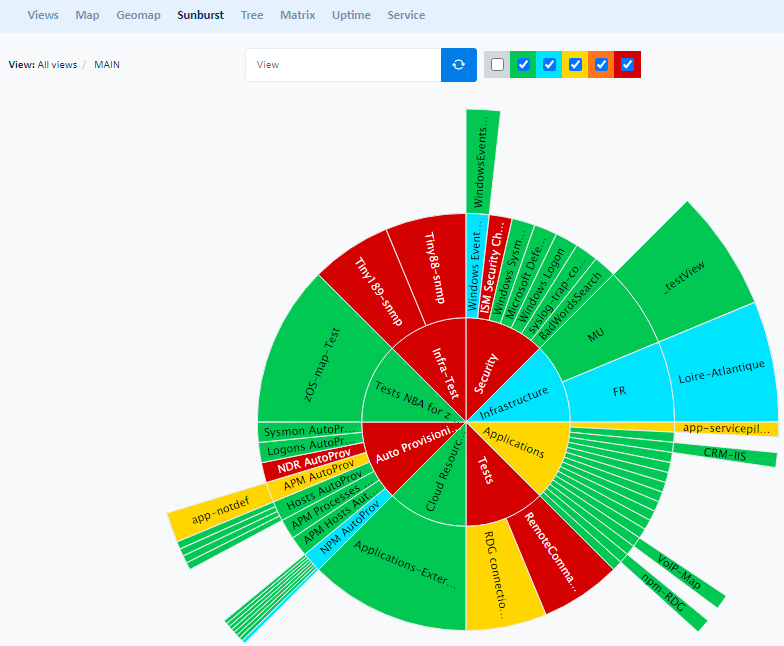 |
| Tree | The Tree sub-menu shows a tree of all the view hierarchy or only the parts that are critical or unavailable | 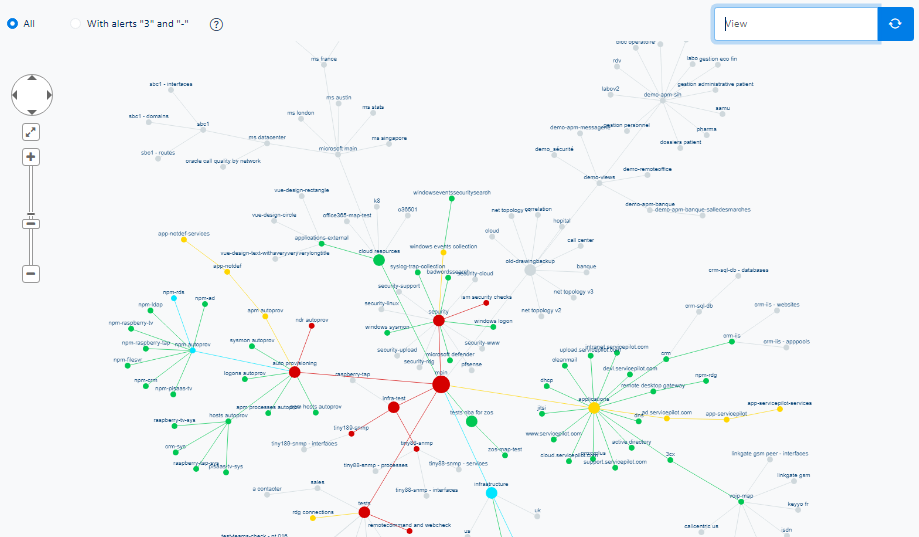 |
| Matrix | The Matrix sub-menu shows tables of hosts or resources set against views or the collection types the resources perform | 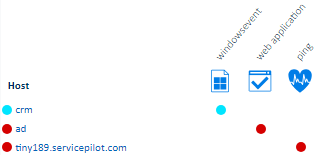 |
| Uptime | The Uptime sub-menu shows Availability & Performance of views and objects as a table over time | 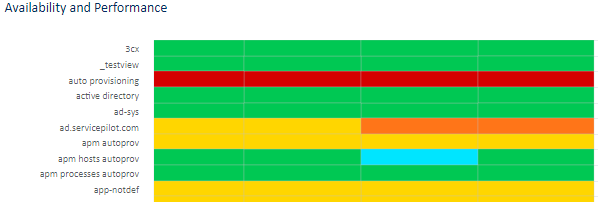 |
| Service | The Service sub-menu shows a table of Availability & Performance statistics and alarm counts for all views | 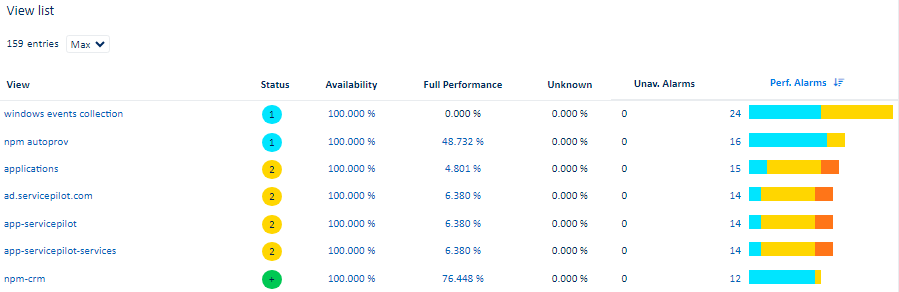 |
Status
| Menu item | Data display | |
|---|---|---|
| Resources | The Resources sub-menu displays all resources and their status | 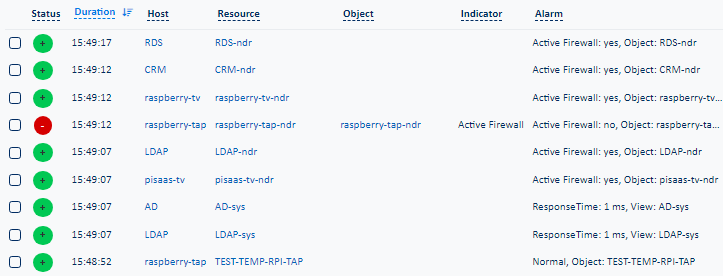 |
| Objects | The Objects sub-menu displays all the objects and their status | 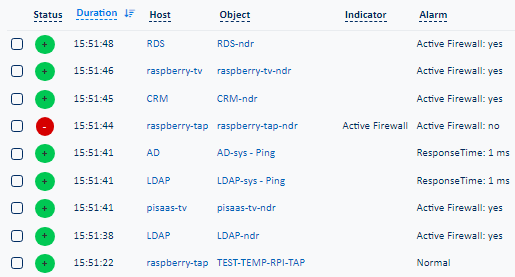 |
| Classes | The Classes sub-menu displays all the classes and their status. Class Actions provide access to Capacity and Trend statistics by class. | 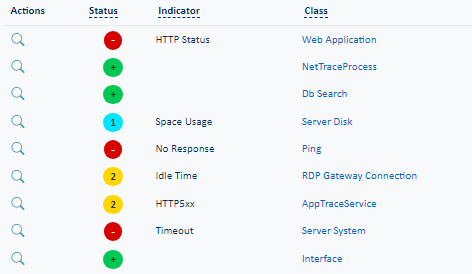 |
| Views | The Views sub-menu displays all the views in a table form with their status | 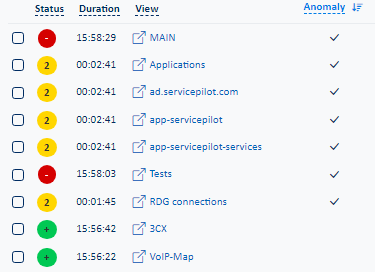 |
Events
| Menu item | Data display | |
|---|---|---|
| Details | The Details sub-menu displays all status changes within the defined time period. The event list can be filtered and queried to show only the elements selected. | 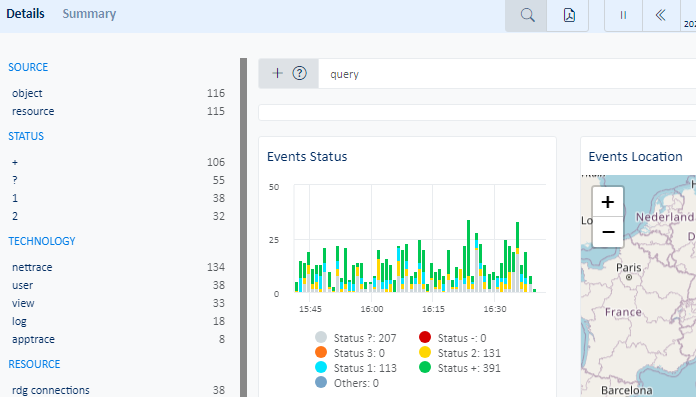 |
| Summary | The Summary sub-menu displays status change counts categorized by different grouping criteria | 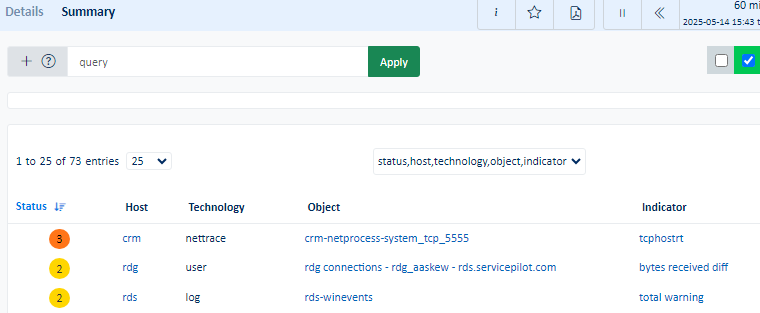 |
Hosts
| The Hosts sub-menu displays all IP / Hostnames in a hexagonal map. The details provided when clicking on an individual host include host Availability and Performance, Network Performance, Inventory, Processes, Security events and Network tracing capabilities. | 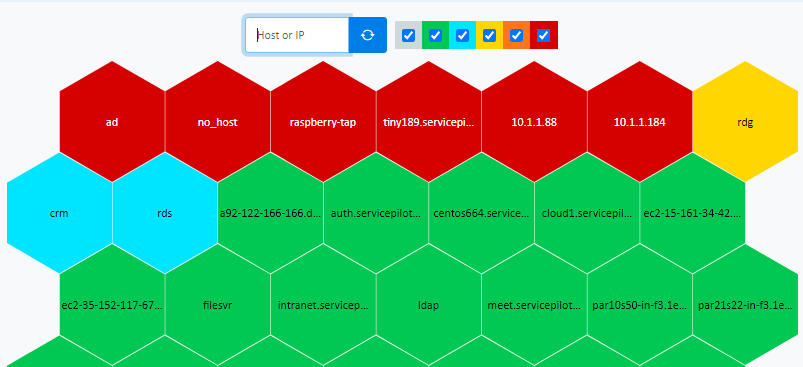 |
Dashboards
ServicePilot provides multiple dashboards that are composed of widgets, each of which querying the ServicePilot database and presenting data in a particular form.
Dashboards may be added to a list of favorites for quicker access.
Custom dashboards can be created, built from existing widgets or from completely new queries into the ServicePilot database.
See the Dashboards documentation for more details.
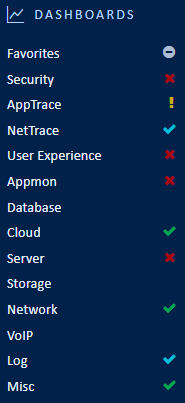
Note that not all dashboard categories will appear initially. Only those with provisioned resources of that category are shown.
| Menu item | Data display | |
|---|---|---|
| Favorites | The Favorites menu displays bookmarked and global dashboards | 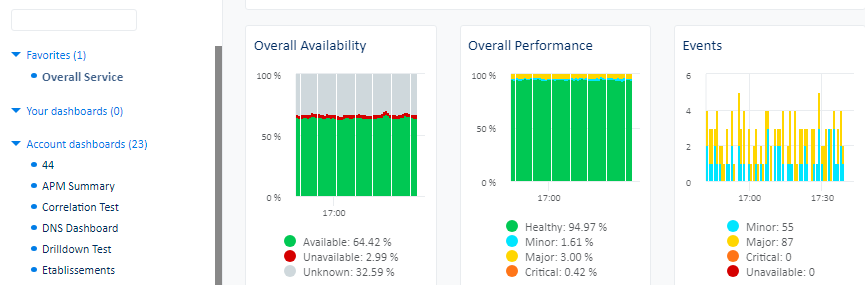 |
| Security | The Security menu displays all security resource dashboards as well as NDR detected attacks | 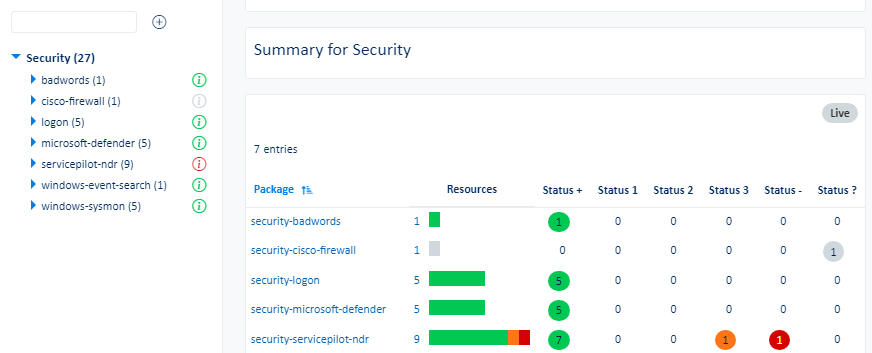 |
| AppTrace | The AppTrace menu displays all apptrace resource dashboards as well as web and database requests captured with application performance monitoring (APM) | 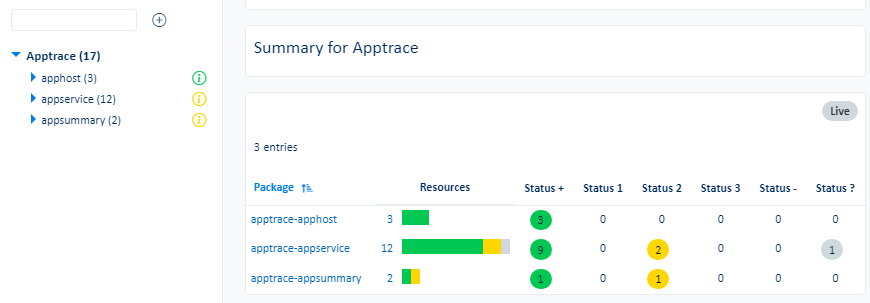 |
| NetTrace | The NetTrace menu displays all nettrace resource dashboards as well as network flows and the possibility of performing network captures | 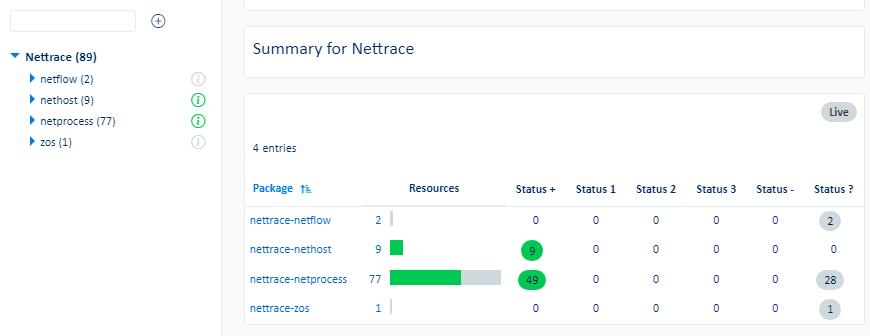 |
| User Experience | The User Experience menu displays all user resource dashboards as well as remote user monitoring (RUM) captures and ServicePilot Endpoint statistics and inventory | 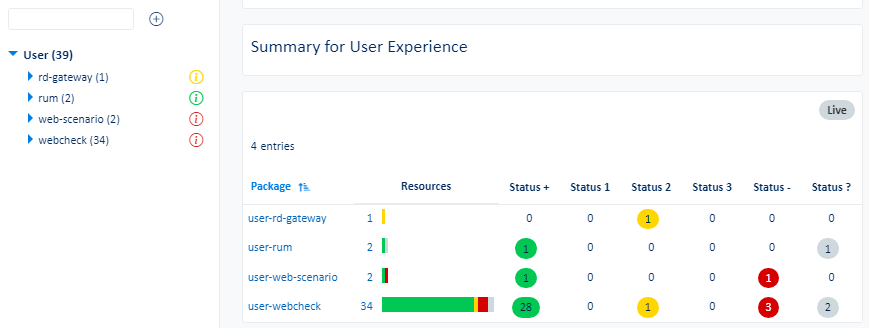 |
| Appmon | The Appmon menu displays all appmon resource dashboards | 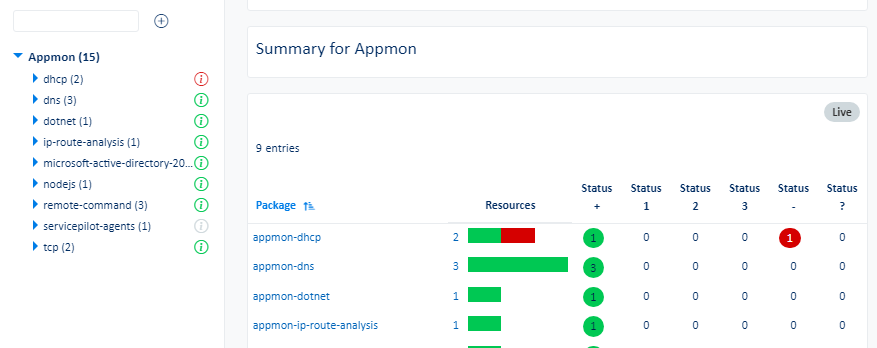 |
| Database | The Database menu displays all database resource dashboards | 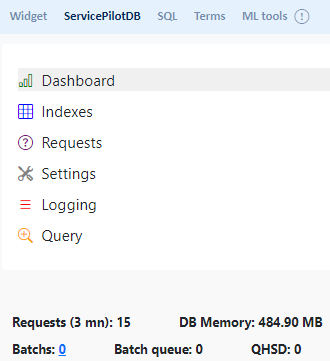 |
| Cloud | The Cloud menu displays all cloud resource dashboards | 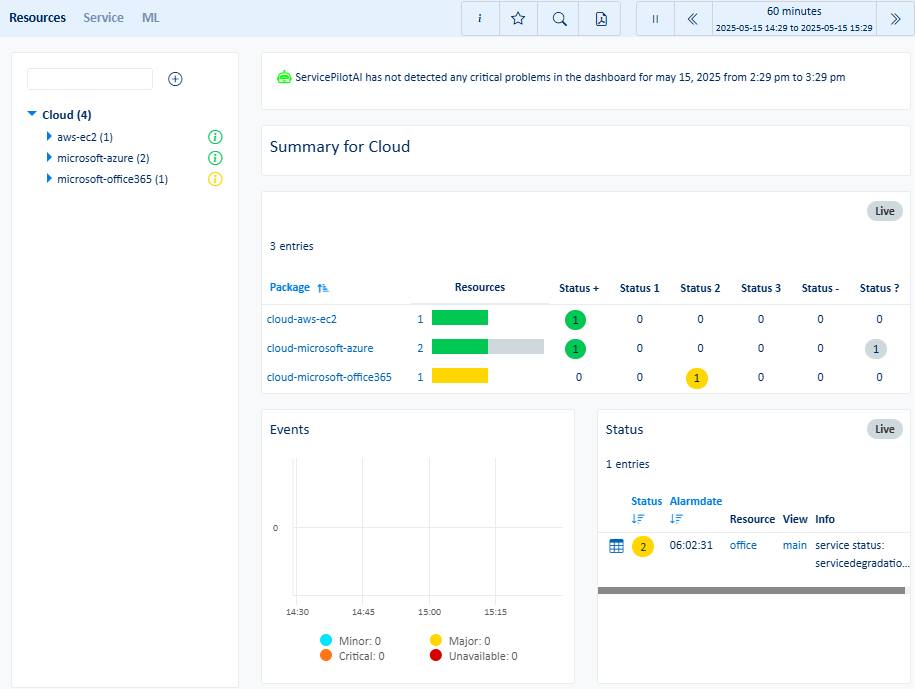 |
| Server | The Server menu displays all server resource dashboards as well as ServicePilot Agent statistics and inventory | 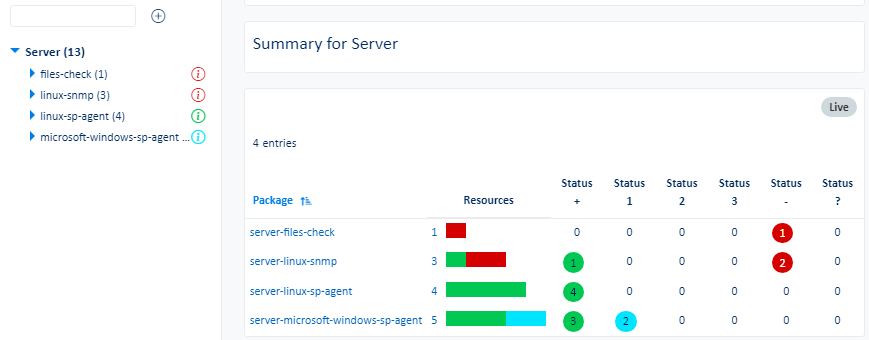 |
| Storage | The Storage menu displays all storage resource dashboards | 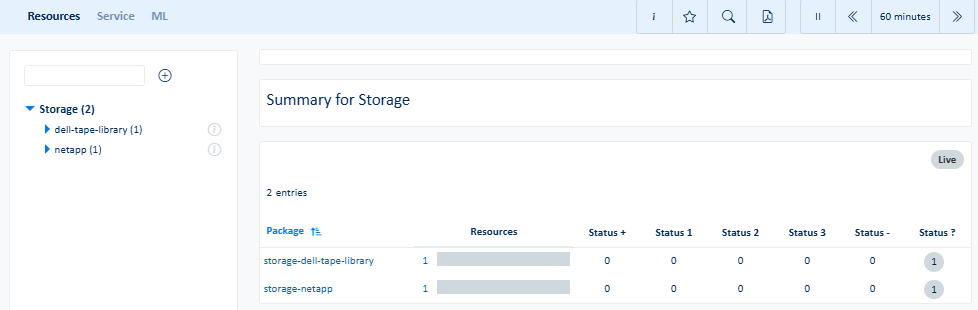 |
| Network | The Network menu displays all network resource dashboards as well as network discovery | 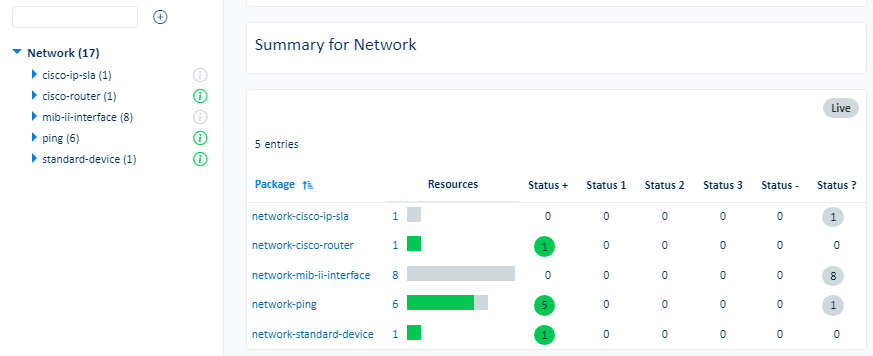 |
| VoIP | The VoIP menu displays all voip resource dashboards | 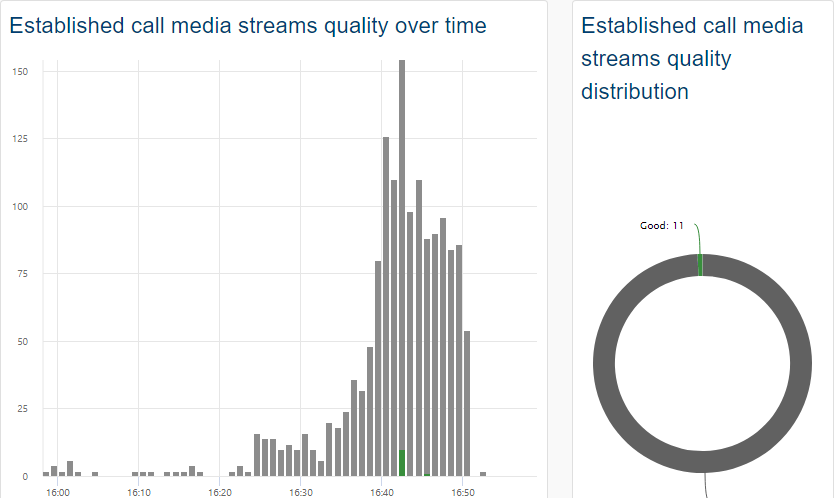 |
| Log | The Log menu displays all log resource dashboards as well as Syslog and SNMP Trap captures | 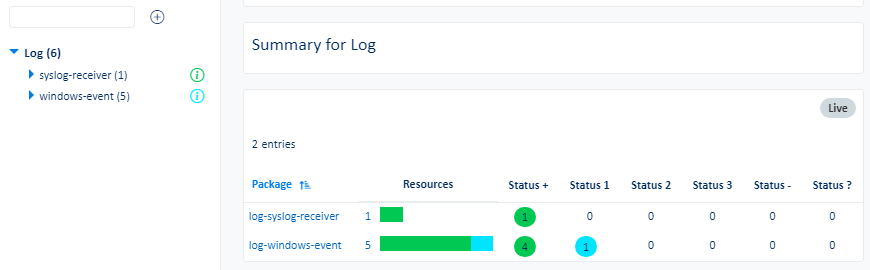 |
| Misc | The Misc menu displays all miscellaneous resource dashboards | 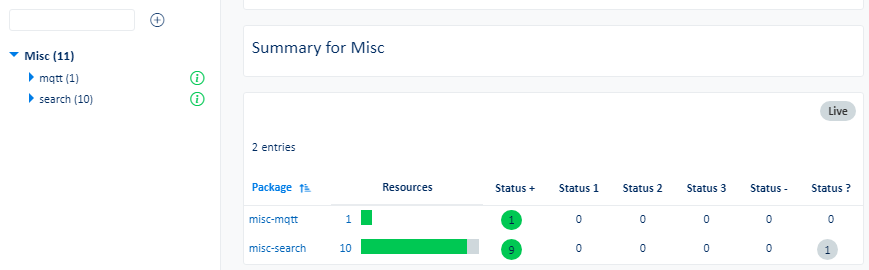 |
Favorites
| Menu item | Data display | |
|---|---|---|
| Portal | The Portal sub-menu displays a global view of all the dashboards: Favorites, Your dashboards, Account dashboards, Global dashboards | 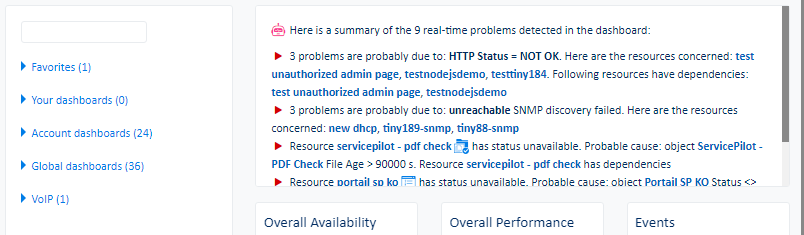 |
| Anomalies | The Anomalies sub-menu displays abnormal peaks, predictions of when indicators pass critical thresholds and trends for all indicators | 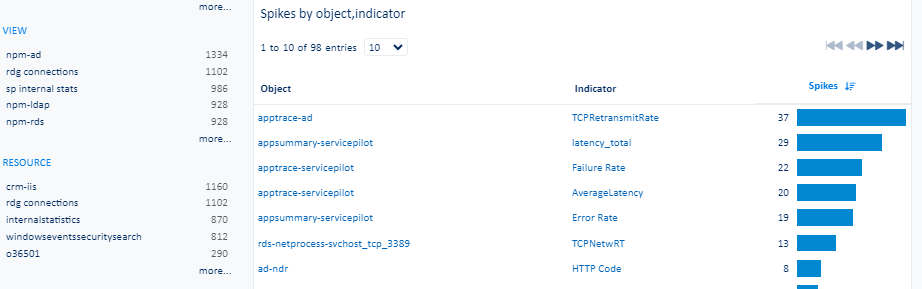 |
| Service | The Service sub-menu displays a global view of performance, availability and alerts. Further tabs also present real-time service states grouped by class, technology, infrastructure and application type. Top events and event duration by class, object, package and resource are show in the Top Events tab. The SLA tab shows service level objectives (SLOs) and if views and resources with SLA profiles set meet the objectives. | 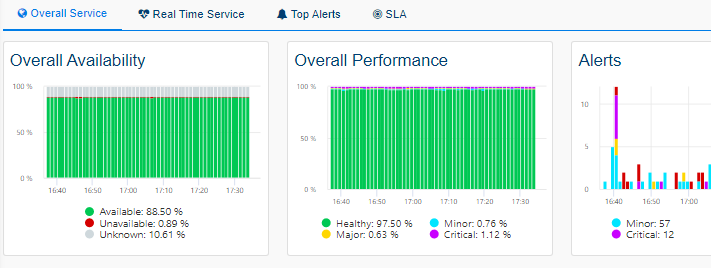 |
| Packages | The Packages sub-menu displays a count of resource states by package type | 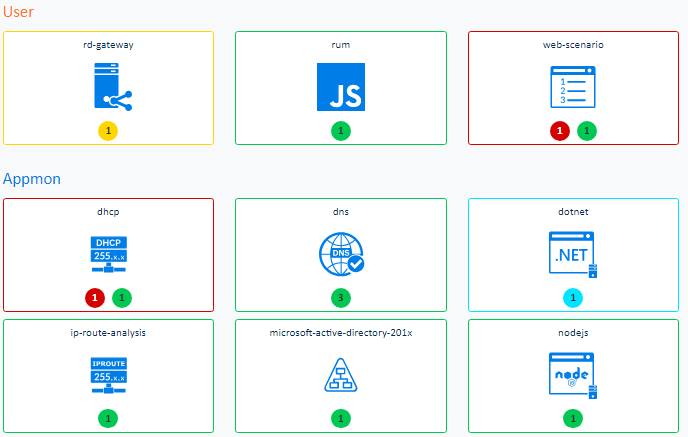 |
| Top Object | The Top Object sub-menu ranks all of the same type of indicator's average, minimum, maximum, first value, last value, 90th percentile and 95th percentile by object | 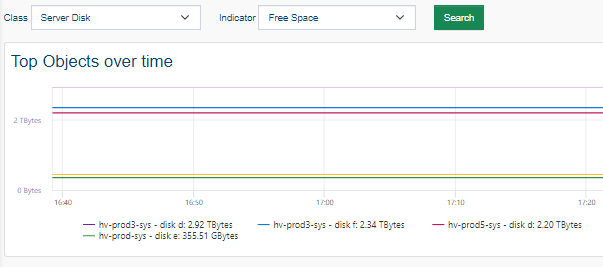 |
| Uptime | The Uptime sub-menu displays the worst availability and performance of objects by class over time with access the details per object | 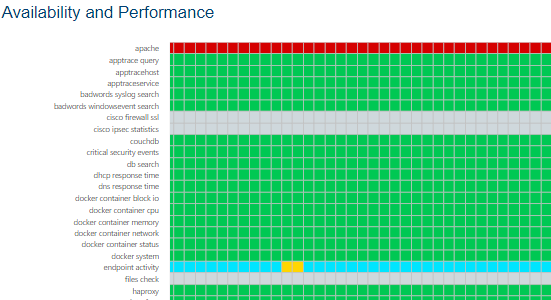 |
| TV | The TV sub-menu displays a dashboard example without any menu for a TV display | 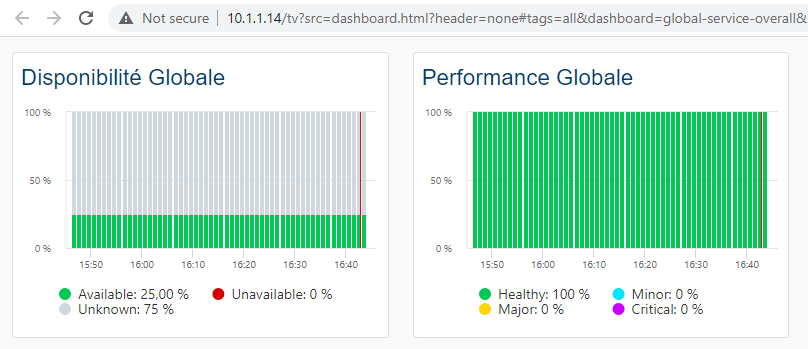 |
Security
| Menu item | Data display | |
|---|---|---|
| Resources | The Resources sub-menu displays the package and resource dashboards for each package in the Security category | 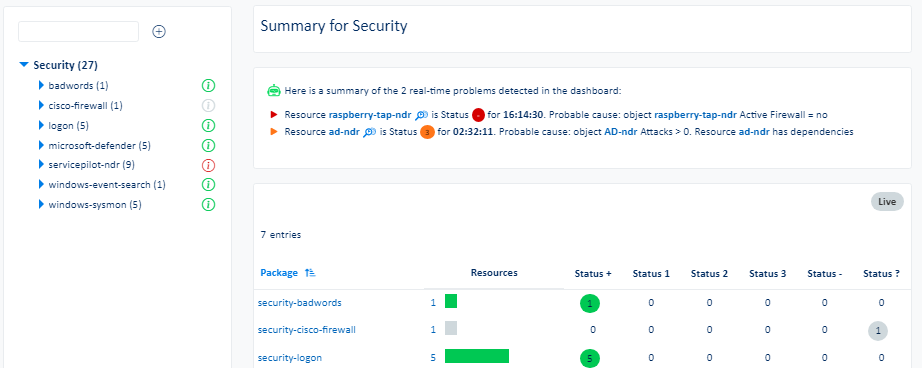 |
| Service | The Service sub-menu displays availability, performance, reliability and maintainability of classes or objects for Security packages and resources | 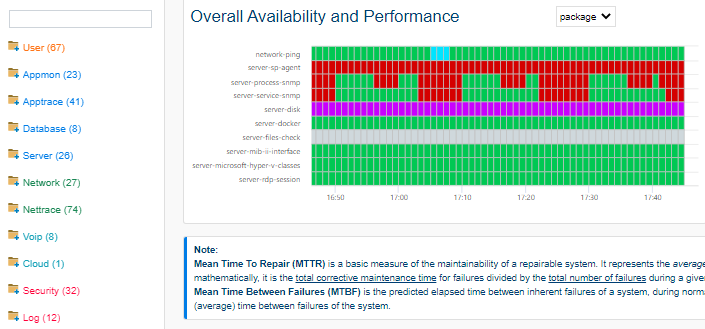 |
| ML | The ML sub-menu displays the largest indicator anomalies, critical indicator predictions and trends for Security packages and resources | 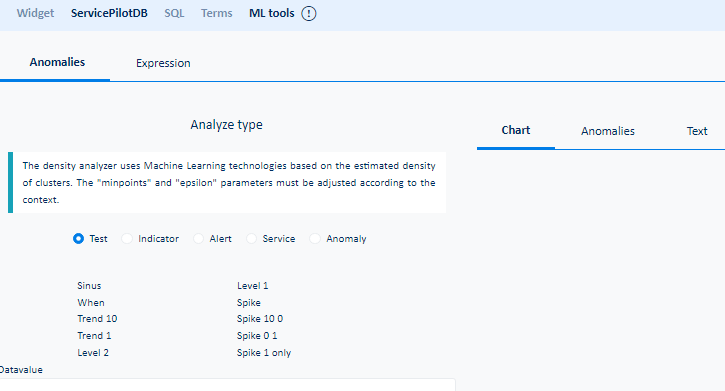 |
| Attacks | The Attacks sub-menu displays detected network and web application attacks | 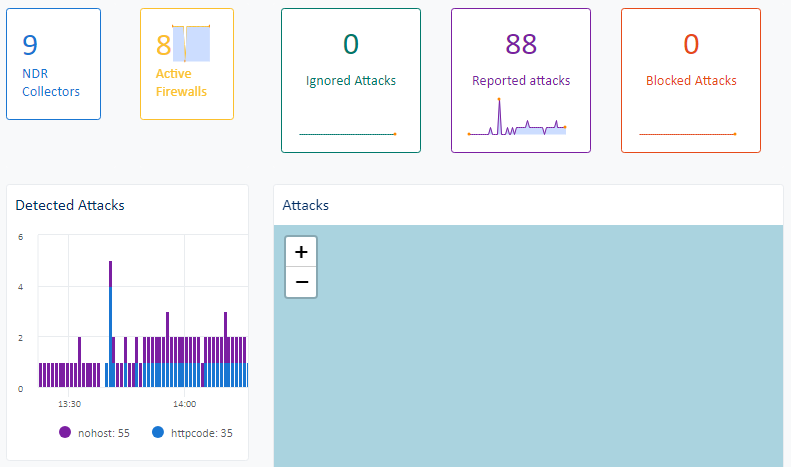 |
AppTrace
| Menu item | Data display | |
|---|---|---|
| Resources | The Resources sub-menu displays the package and resource dashboards for each package in the AppTrace category | 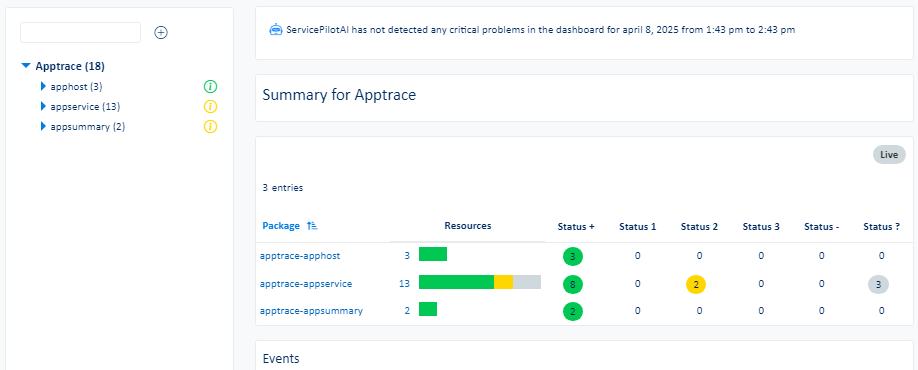 |
| Service | The Service sub-menu displays availability, performance, reliability and maintainability of classes or objects for AppTrace packages and resources | 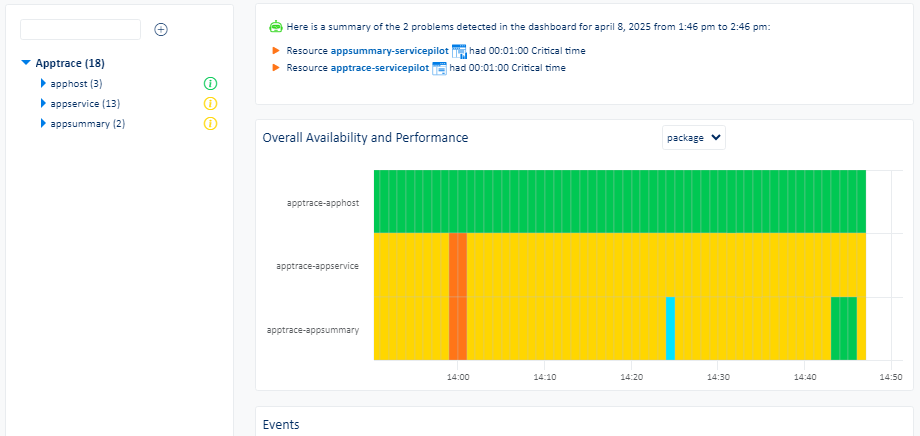 |
| ML | The ML sub-menu displays the largest indicator anomalies, critical indicator predictions and trends for AppTrace packages and resources | |
| Applications | The Applications sub-menu displays web application, service and host health | 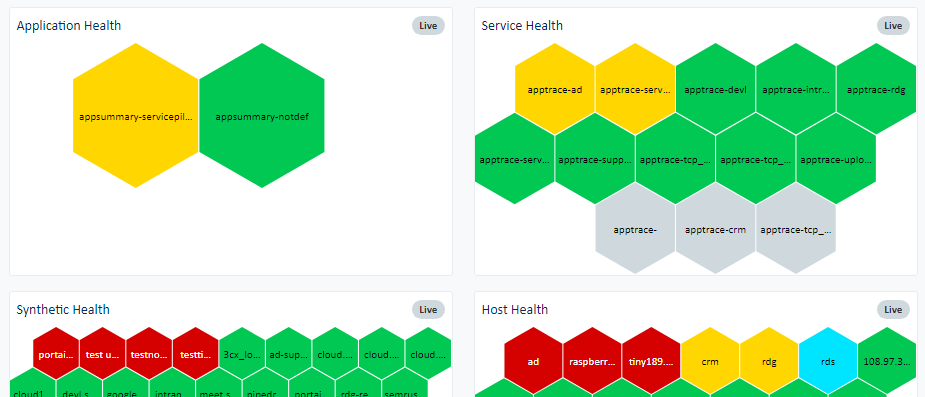 |
| Requests | The Requests sub-menu displays web request details for APM instrumented web applications | 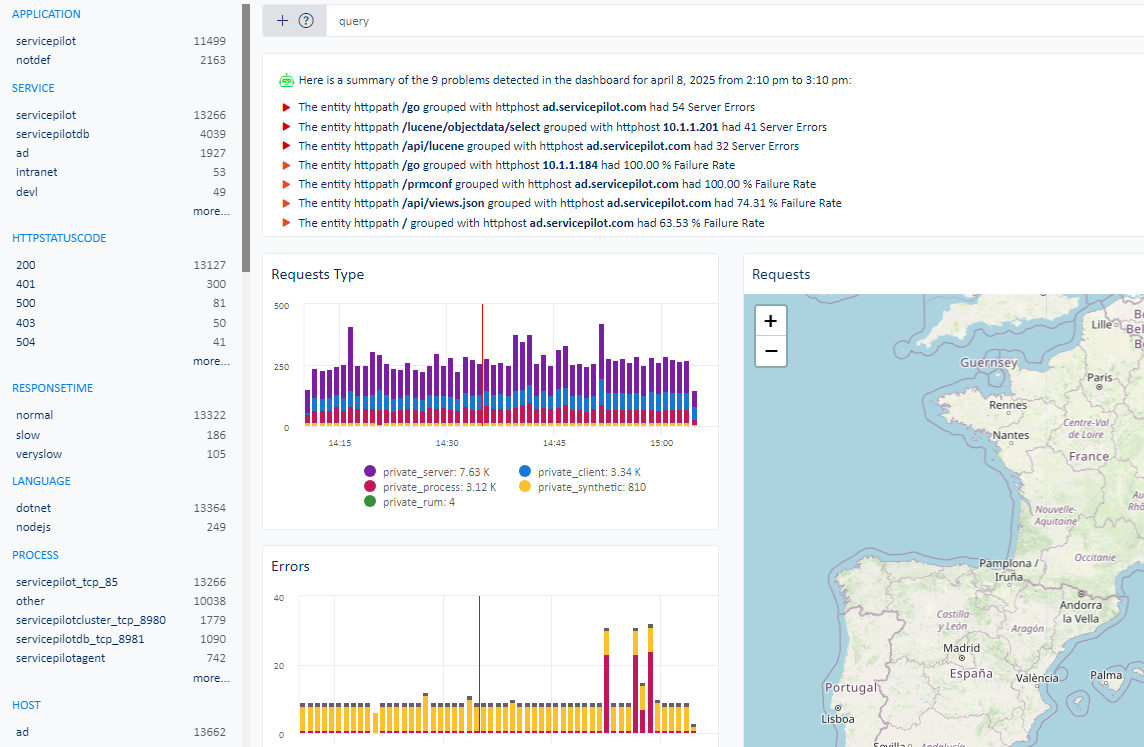 |
| L7 Map | The L7 Map sub-menu displays links between hosts, processes, services and subnets based on collected APM data | 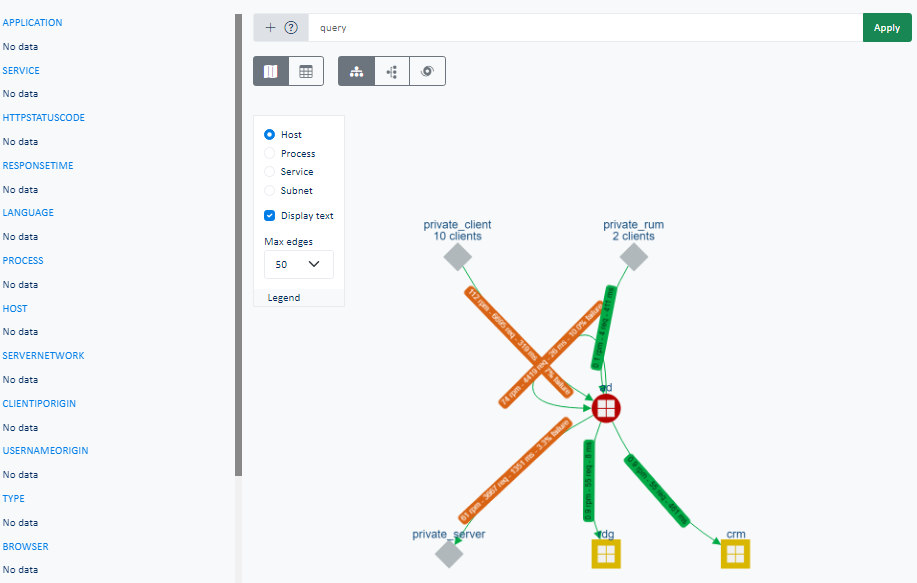 |
| Profiler | The Profiler sub-menu shows results of processes that have been instrumented with profiling enabled | 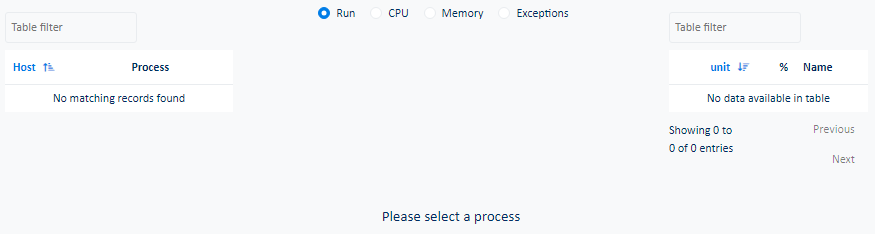 |
NetTrace
| Menu item | Data display | |
|---|---|---|
| Resources | The Resources sub-menu displays the package and resource dashboards for each package in the NetTrace category | 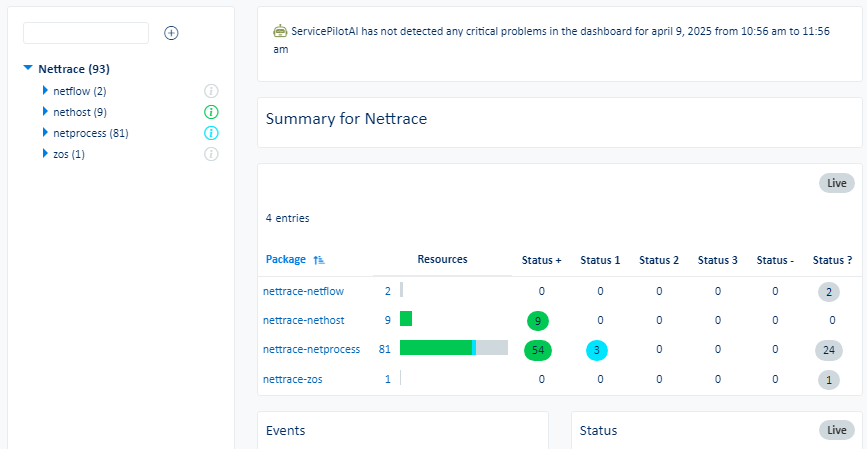 |
| Service | The Service sub-menu displays availability, performance, reliability and maintainability of classes or objects for NetTrace packages and resources | 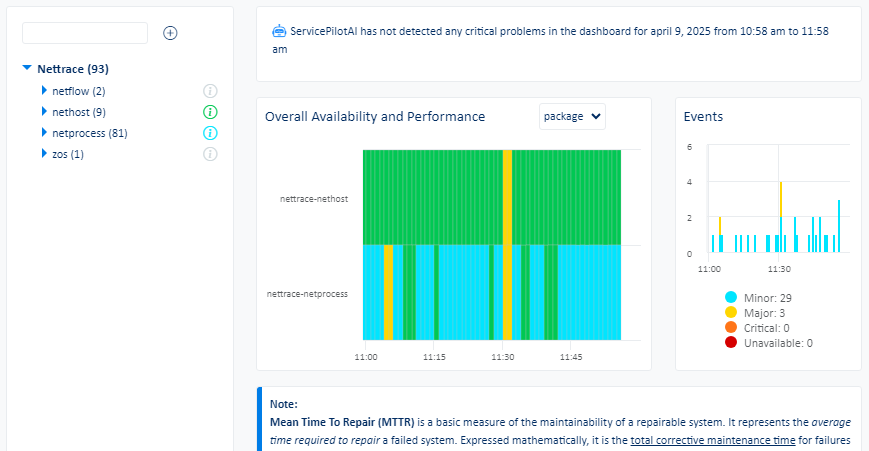 |
| ML | The ML sub-menu displays the largest indicator anomalies, critical indicator predictions and trends for NetTrace packages and resources | |
| Conversations | The Conversations sub-menu displays UDP and TCP network flows captured on servers by the ServicePilot Agent as well as NetTrace instrumented switches and routers | 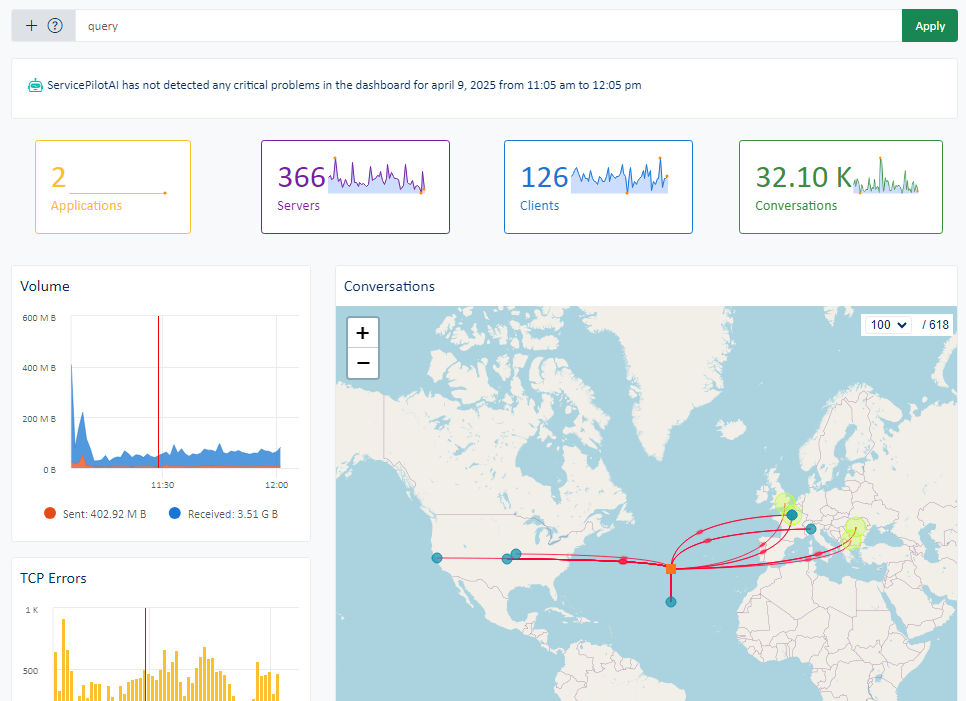 |
| L4 Map | The L4 Map sub-menu displays links between hosts, processes, services and subnets based on collected NPM data | 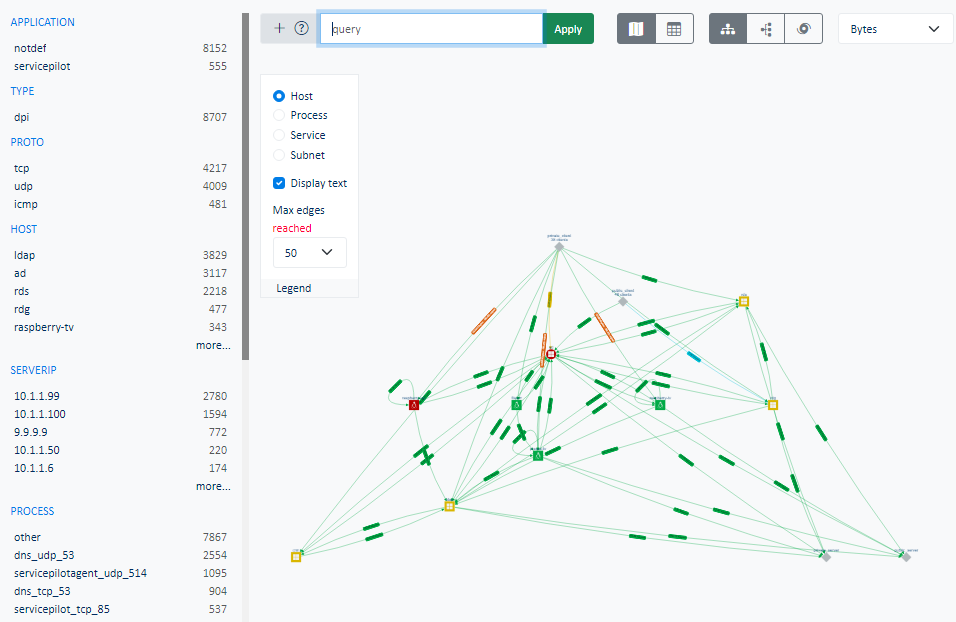 |
| Public | The Public sub-menu displays statistics for the largest network flows using public IP addresses | 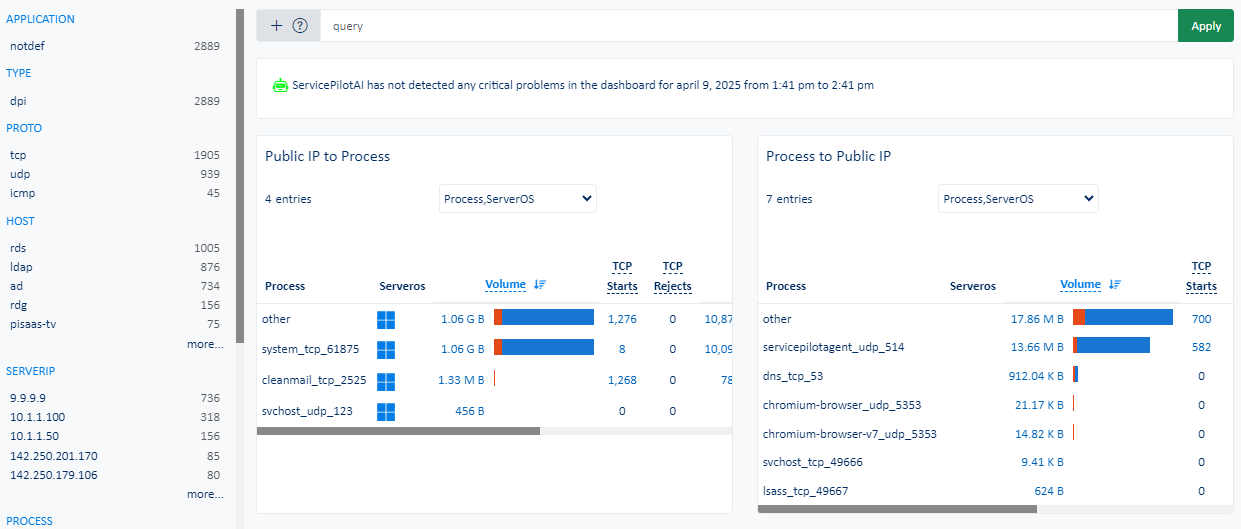 |
| PCAP | The PCAP sub-menu allows for the capture and download of network traffic in PCAP files from hosts on which ServicePilot Agents have been installed | 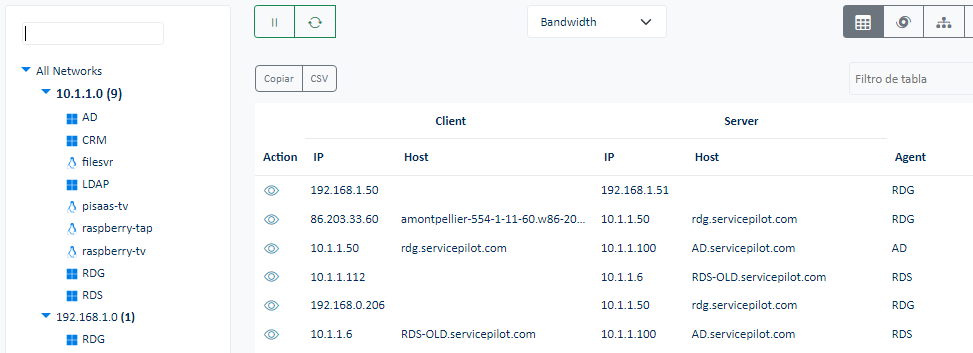 |
User Experience
| Menu item | Data display | |
|---|---|---|
| Resources | The Resources sub-menu displays the package and resource dashboards for each package in the User category | 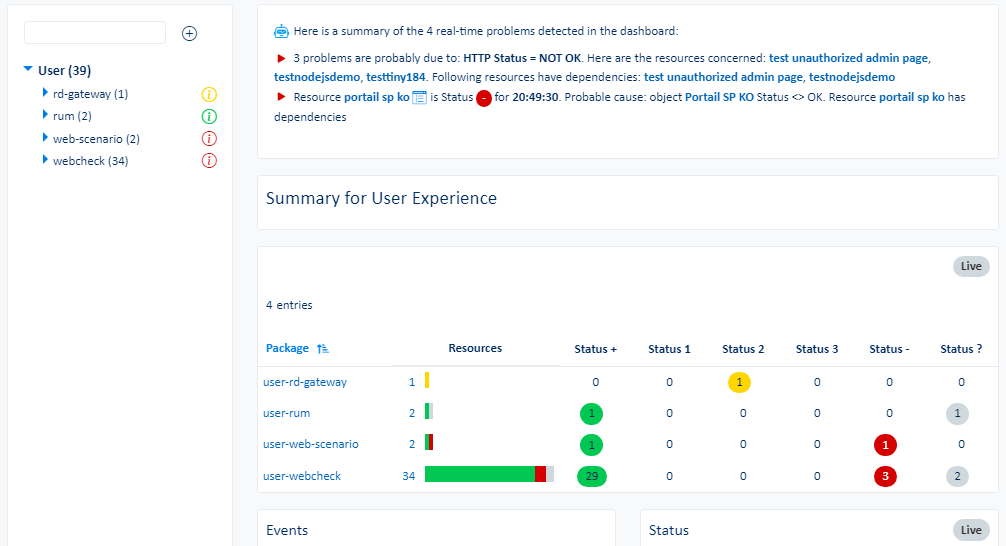 |
| Service | The Service sub-menu displays availability, performance, reliability and maintainability of classes or objects for User packages and resources | 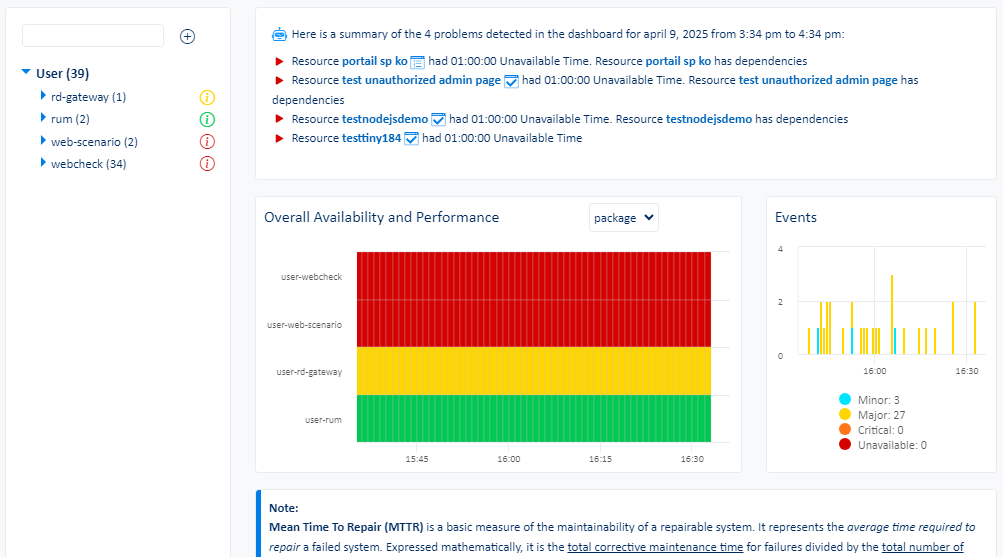 |
| ML | The ML sub-menu displays the largest indicator anomalies, critical indicator predictions and trends for User packages and resources | |
| Browser | The Browser sub-menu displays web application request details for applications that are instrumented with ServicePilot RUM as well as ServicePilot synthetic web requests | 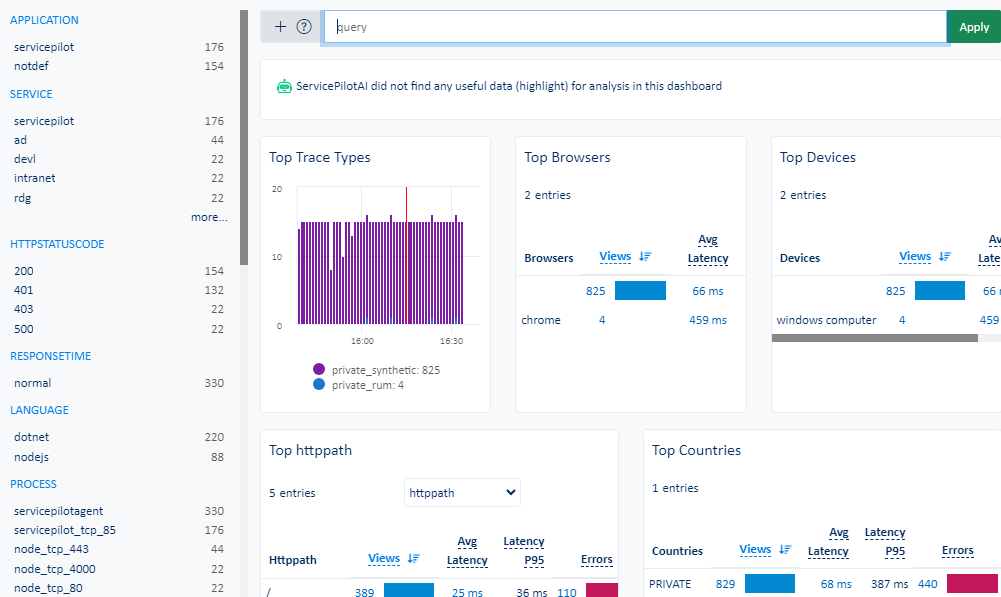 |
| Endpoints | The Endpoints sub-menu displays an overview of Windows workstations that have been provisioned with ServicePilot Endpoint Agents |
Appmon
| Menu item | Data display | |
|---|---|---|
| Resources | The Resources sub-menu displays the package and resource dashboards for each package in the Appmon category | 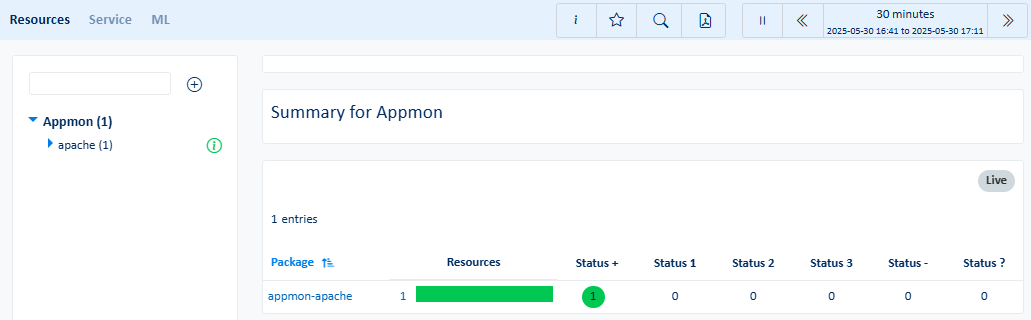 |
| Service | The Service sub-menu displays availability, performance, reliability and maintainability of classes or objects for Appmon packages and resources | 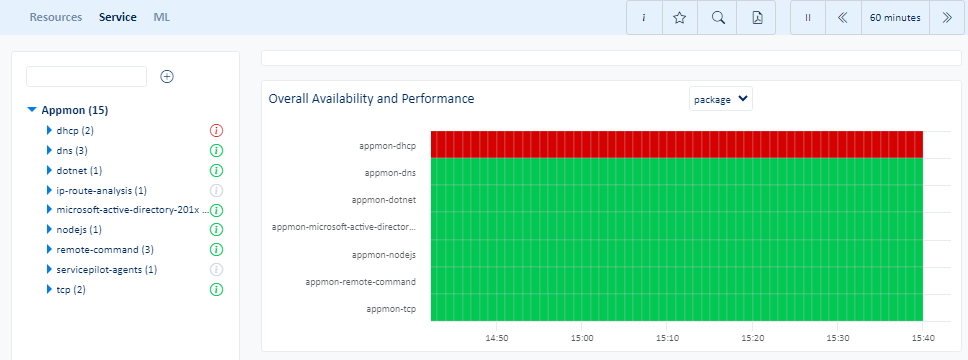 |
| ML | The ML sub-menu displays the largest indicator anomalies, critical indicator predictions and trends for Appmon packages and resources | 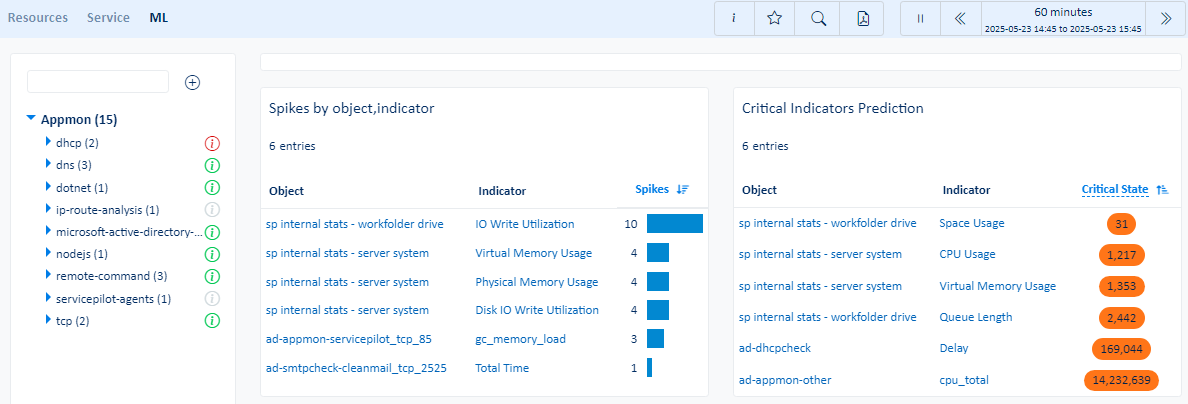 |
Database
| Menu item | Data display | |
|---|---|---|
| Resources | The Resources sub-menu displays the package and resource dashboards for each package in the Database category | 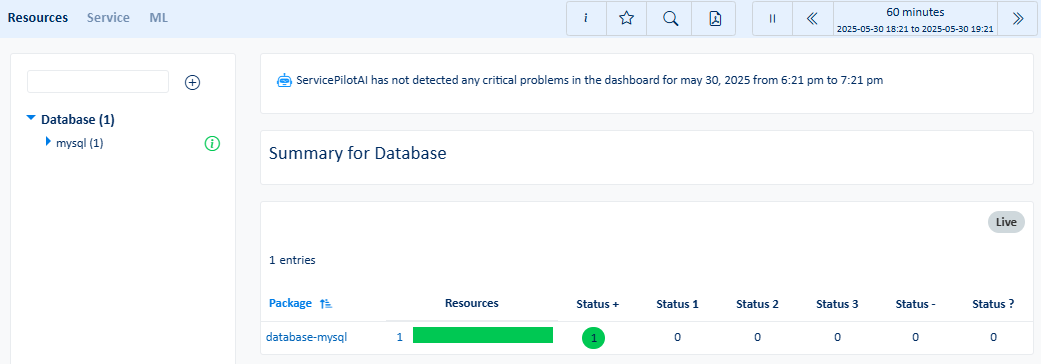 |
| Service | The Service sub-menu displays availability, performance, reliability and maintainability of classes or objects for Database packages and resources | 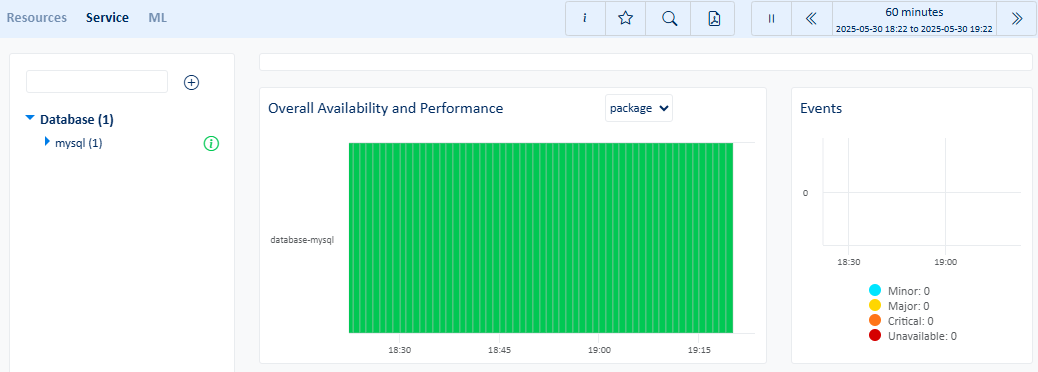 |
| ML | The ML sub-menu displays the largest indicator anomalies, critical indicator predictions and trends for Database packages and resources | 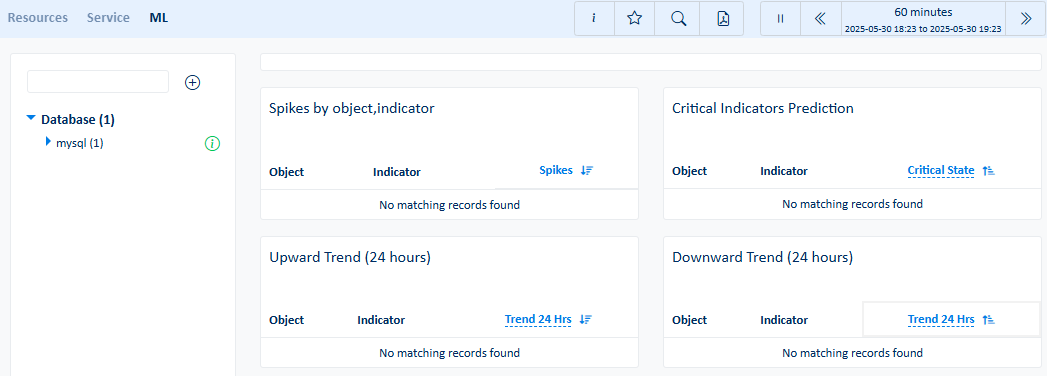 |
Cloud
| Menu item | Data display | |
|---|---|---|
| Resources | The Resources sub-menu displays the package and resource dashboards for each package in the Cloud category | 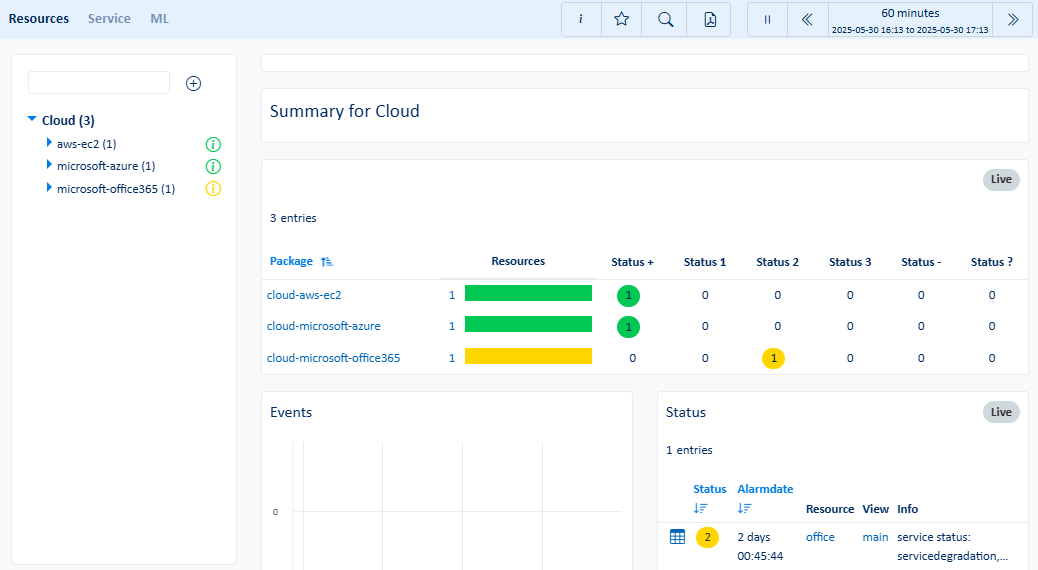 |
| Service | The Service sub-menu displays availability, performance, reliability and maintainability of classes or objects for Cloud packages and resources | 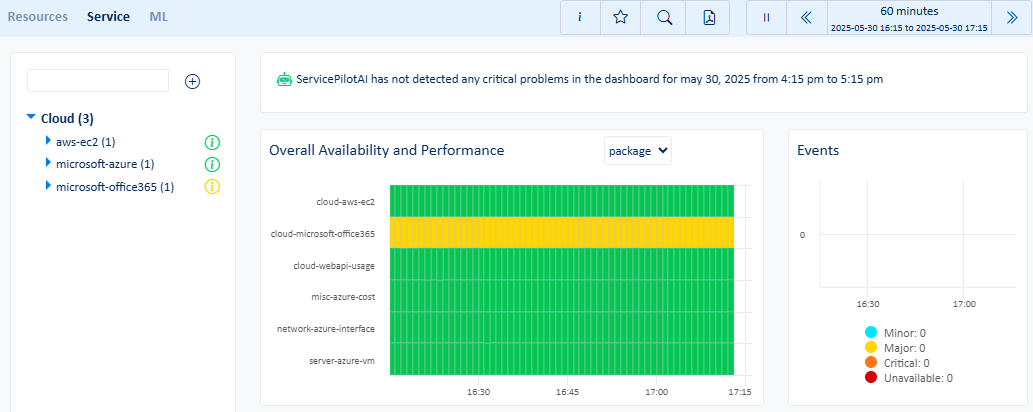 |
| ML | The ML sub-menu displays the largest indicator anomalies, critical indicator predictions and trends for Cloud packages and resources | 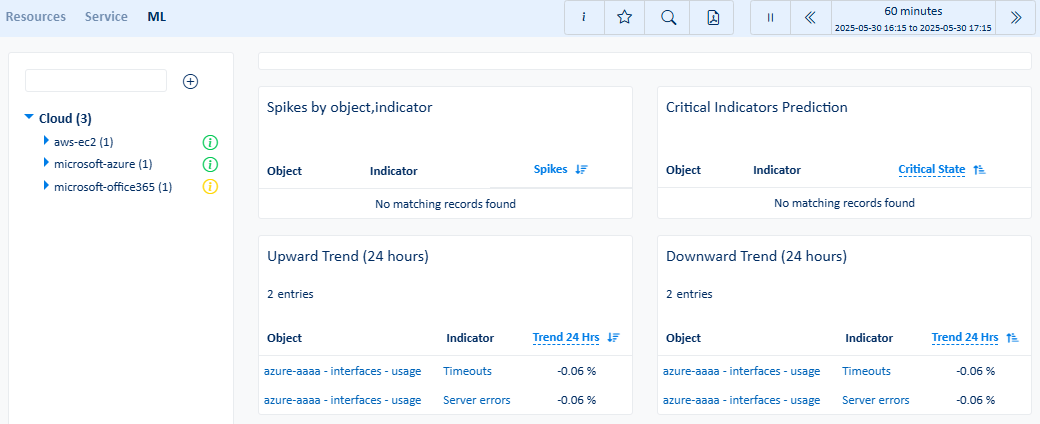 |
Server
| Menu item | Data display | |
|---|---|---|
| Resources | The Resources sub-menu displays the package and resource dashboards for each package in the Server category | 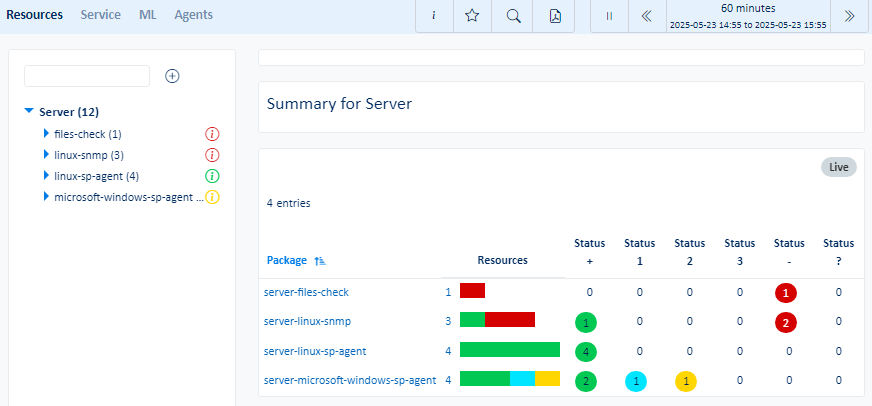 |
| Service | The Service sub-menu displays availability, performance, reliability and maintainability of classes or objects for Server packages and resources | 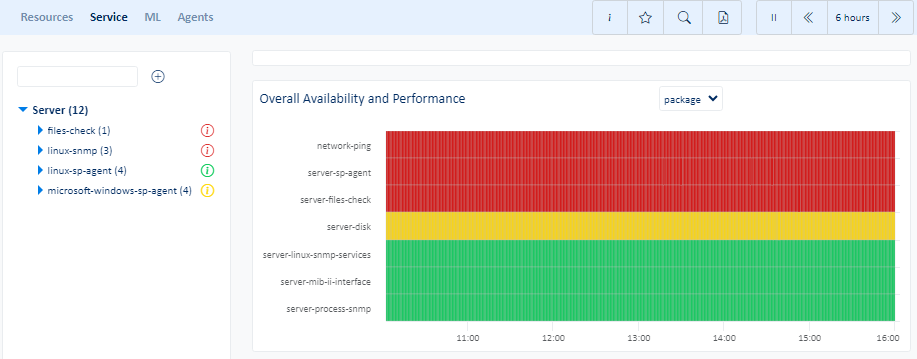 |
| ML | The ML sub-menu displays the largest indicator anomalies, critical indicator predictions and trends for Server packages and resources | 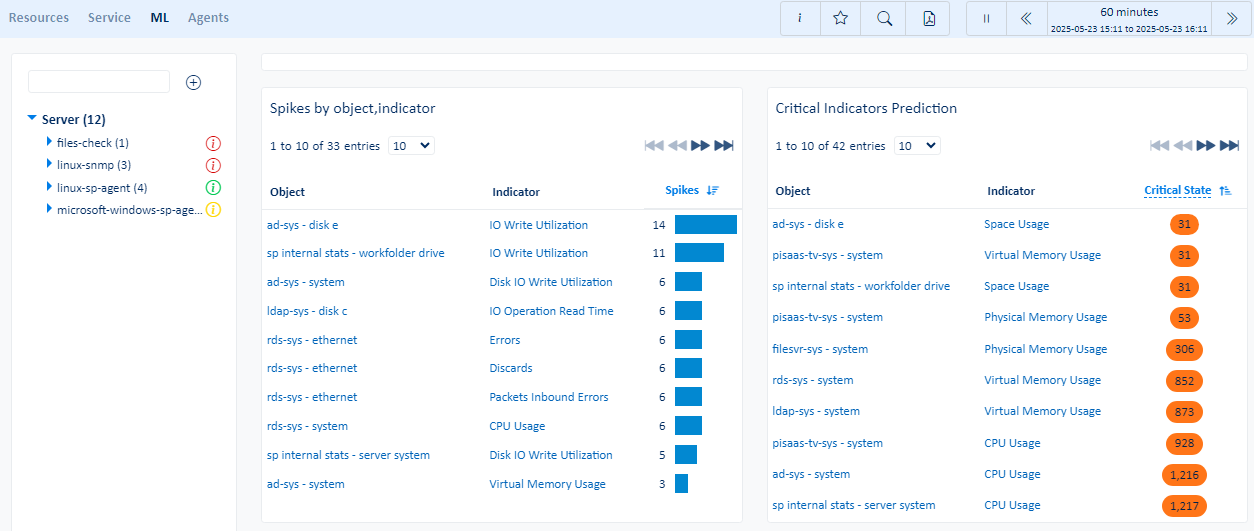 |
| Agents | The Agents sub-menu displays an overview of servers that have been provisioned with ServicePilot Agents | 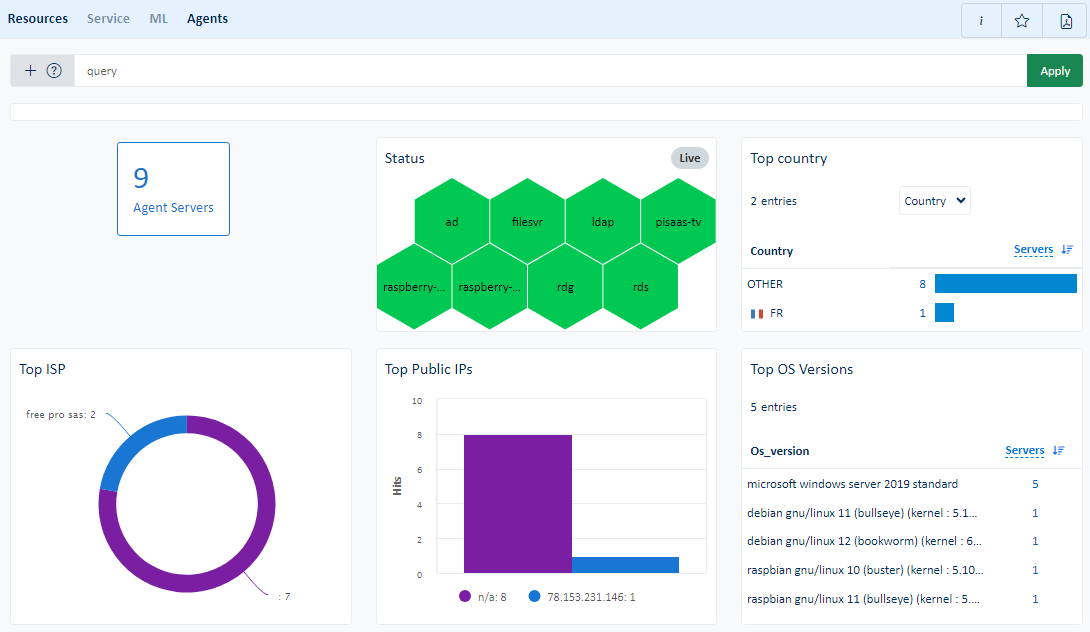 |
Storage
| Menu item | Data display | |
|---|---|---|
| Resources | The Resources sub-menu displays the package and resource dashboards for each package in the Storage category | |
| Service | The Service sub-menu displays availability, performance, reliability and maintainability of classes or objects for Storage packages and resources | |
| ML | The ML sub-menu displays the largest indicator anomalies, critical indicator predictions and trends for Storage packages and resources | |
Network
| Menu item | Data display | |
|---|---|---|
| Resources | The Resources sub-menu displays the package and resource dashboards for each package in the Network category | 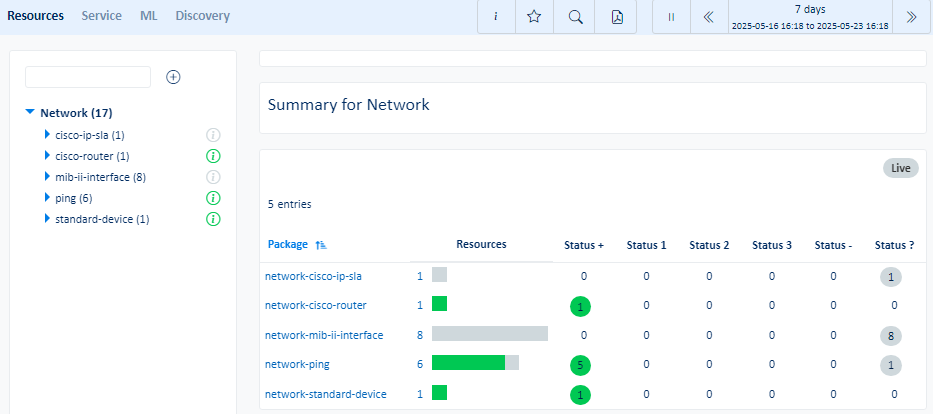 |
| Service | The Service sub-menu displays availability, performance, reliability and maintainability of classes or objects for Network packages and resources | 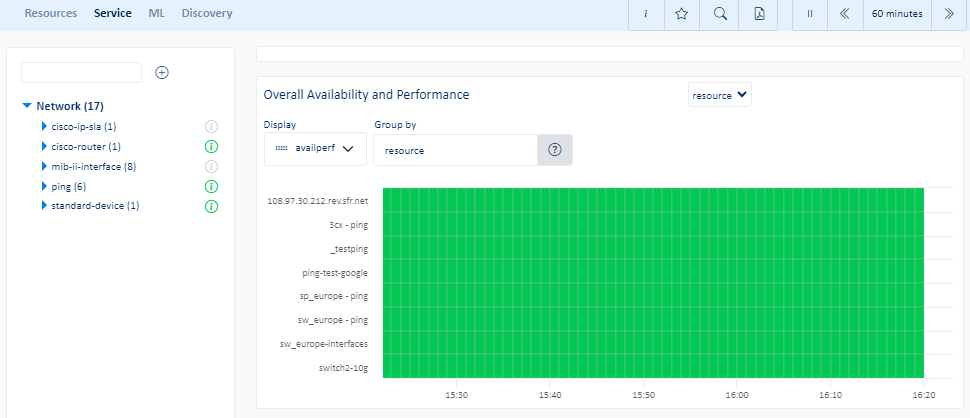 |
| ML | The ML sub-menu displays the largest indicator anomalies, critical indicator predictions and trends for Network packages and resources | 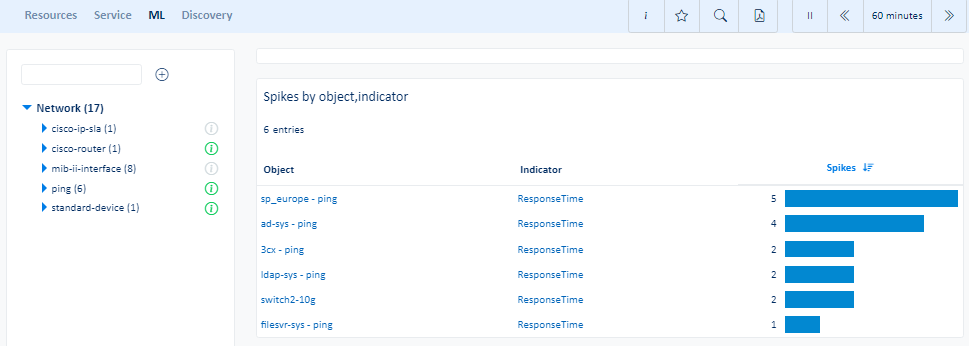 |
| Discovery | The Discovery sub-menu displays the latest results of network scans performed by ServicePilot Agents | 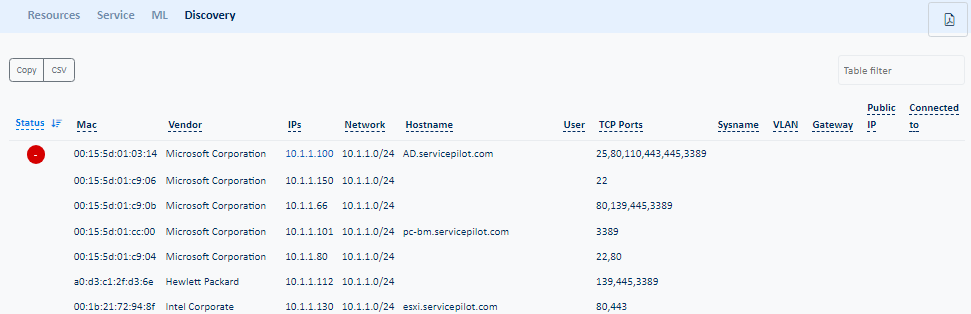 |
VoIP
| Menu item | Data display | |
|---|---|---|
| Resources | The Resources sub-menu displays the package and resource dashboards for each package in the VoIP category | |
| Service | The Service sub-menu displays availability, performance, reliability and maintainability of classes or objects for VoIP packages and resources | |
| ML | The ML sub-menu displays the largest indicator anomalies, critical indicator predictions and trends for VoIP packages and resources | |
Log
| Menu item | Data display | |
|---|---|---|
| Resources | The Resources sub-menu displays the package and resource dashboards for each package in the Log category | 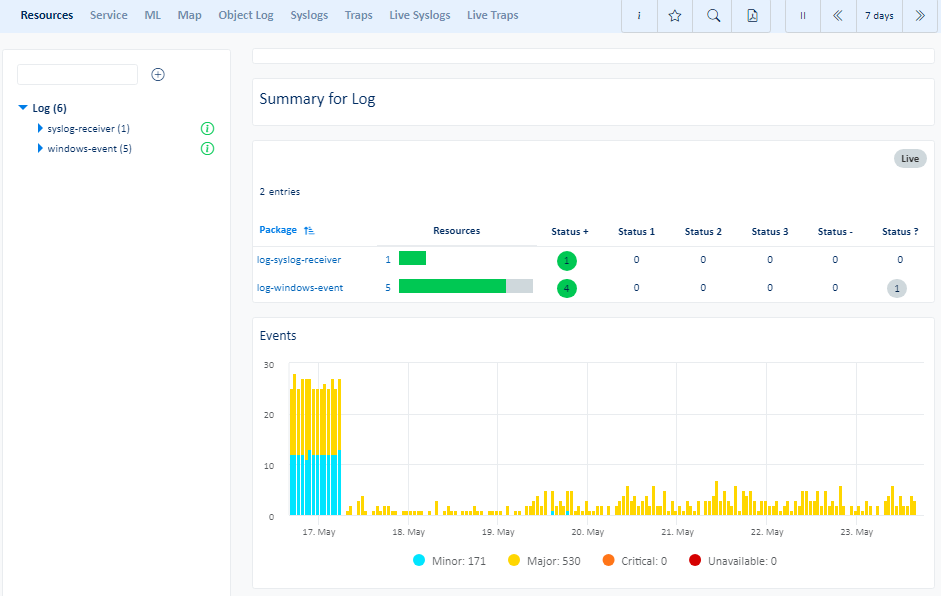 |
| Service | The Service sub-menu displays availability, performance, reliability and maintainability of classes or objects for Log packages and resources | 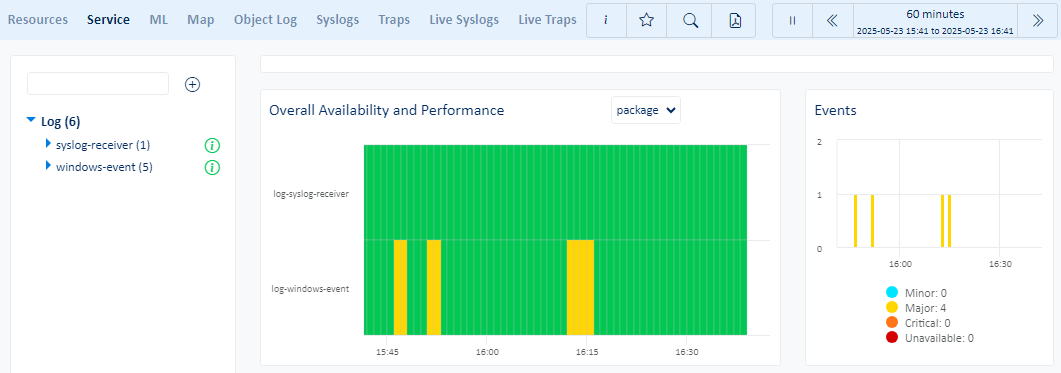 |
| ML | The ML sub-menu displays the largest indicator anomalies, critical indicator predictions and trends for Log packages and resources | 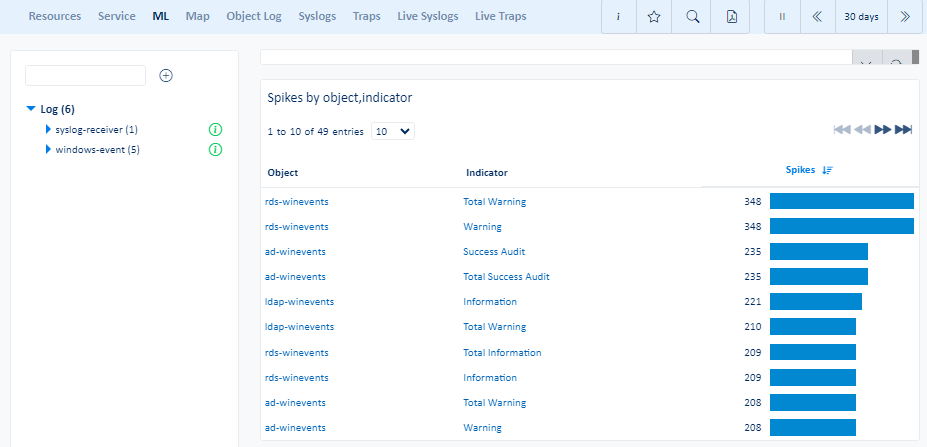 |
| Map | The Map sub-menu displays different logs based on their source IP Address location | |
| Object Log | The Object Log allows for the analysis of object logs in a filterable dashboard | 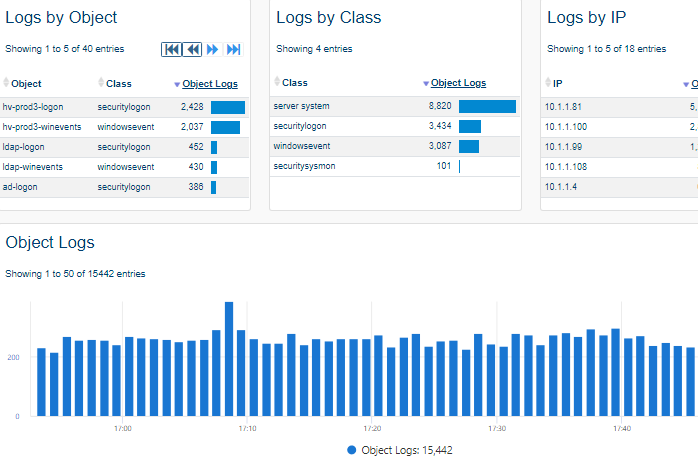 |
| Syslogs | The Syslogs sub-menu allows for the analysis of syslogs in a filterable dashboard | 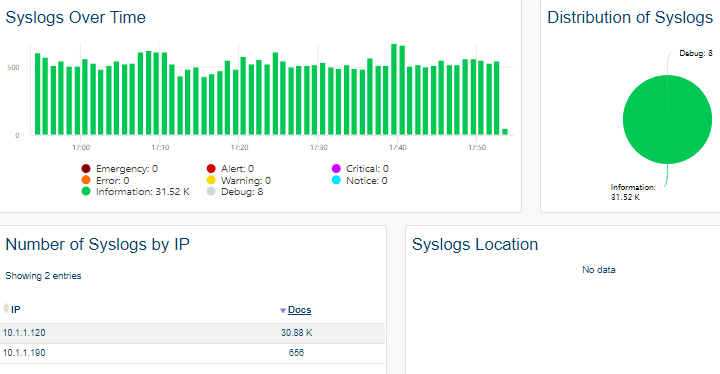 |
| Traps | The Traps sub-menu allows for the analysis of SNMP traps in a filterable dashboard | 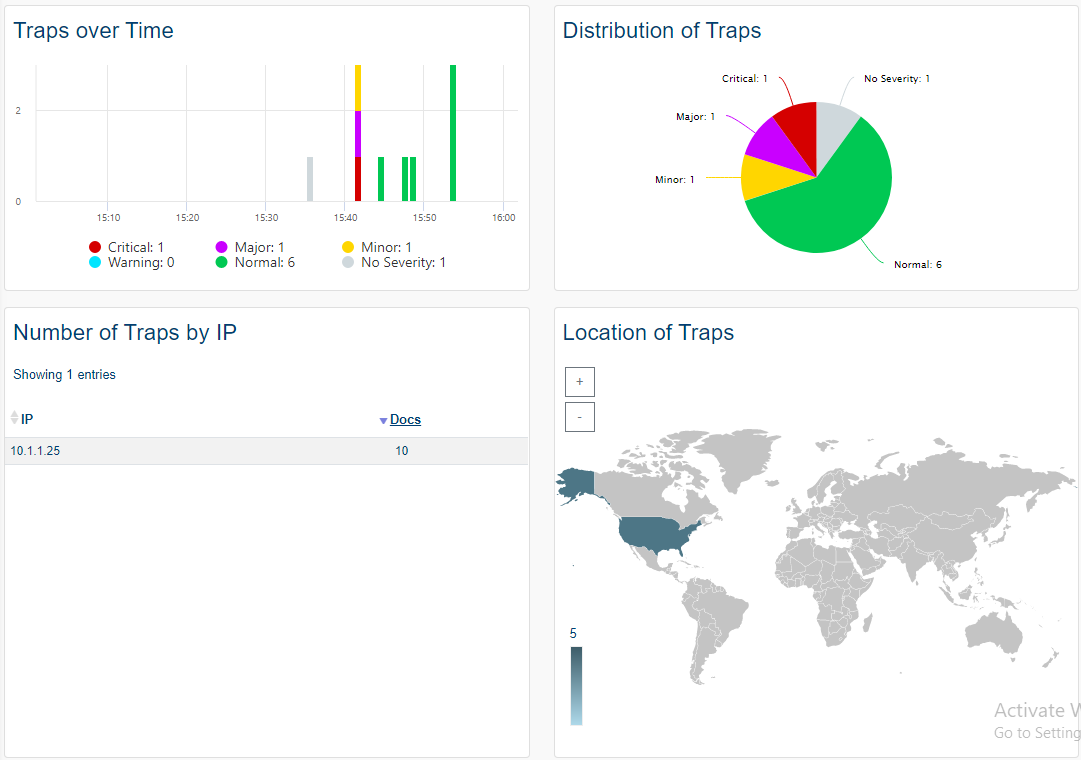 |
| Live Syslogs | The Live Syslogs sub-menu displays the details of received syslogs in real-time | 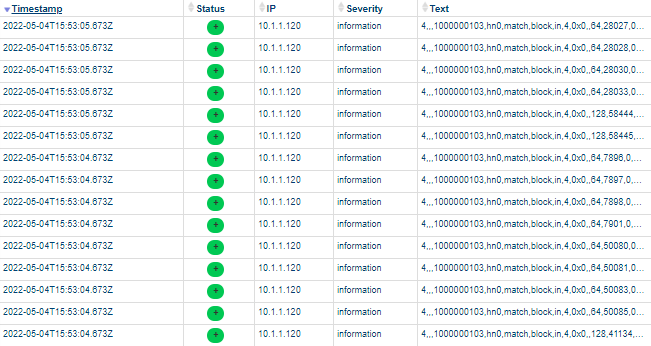 |
| Live Traps | The Live Traps sub-menu displays the details of received SNMP Traps in real-time | 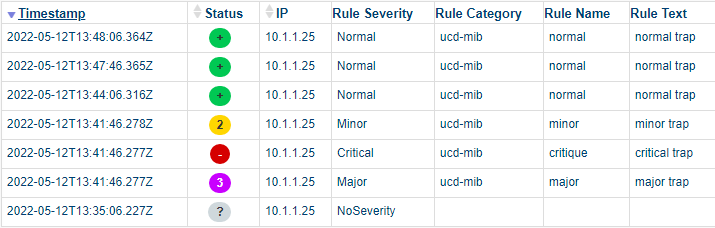 |
Misc
| Menu item | Data display | |
|---|---|---|
| Resources | The Resources sub-menu displays the package and resource dashboards for each package in the Misc category | 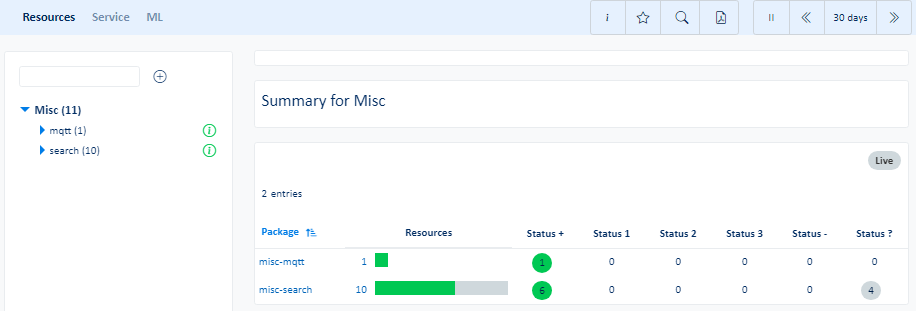 |
| Service | The Service sub-menu displays availability, performance, reliability and maintainability of classes or objects for Misc packages and resources | |
| ML | The ML sub-menu displays the largest indicator anomalies, critical indicator predictions and trends for Misc packages and resources | |
Tools
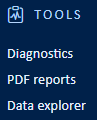
The Tools menu groups together items that are used on occasion, either to define a new database search or diagnose in detail why a device is unreachable or view historical PDF reports.
See the Search documentation for details on custom searches.
| Menu item | Data display |
|---|---|
| Diagnostics | Check connectivity between ServicePilot Agents and devices as well ServicePilot Agent host inventory |
| PDF reports | The PDF reports view allows for the generation of PDF reports based on templates built-in or generated by ServicePilot administrators. Scheduled reports might also be retrieved |
| Data explorer | Perform custom ServicePilot database searches and save them for later inclusion in dashboards and PDF reports |
Diagnostics
| Menu item | Data display | |
|---|---|---|
| Diagnostics | The Diagnostics sub-menu provides tests to make sure equipment communicates correctly using Ping and SNMP | 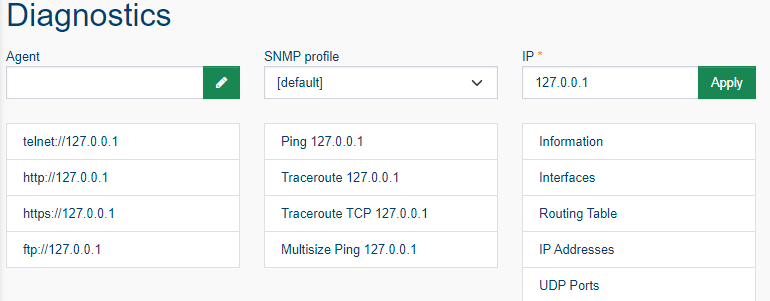 |
| Operations | The Operations sub-menu displays acknowledged objects, objects with SNMP indicies that have been shifted and the ability to manage and unmanage objects | 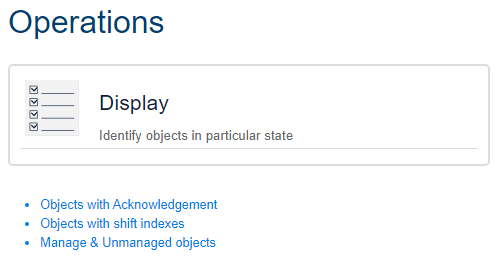 |
PDF reports
| The list of generated PDF reports that the user has rights to view are shown as well as the ability to generate an ad-hock PDF report based on existing PDF report templates. | 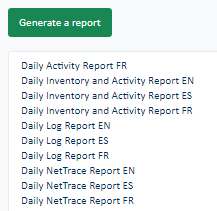 |
Data explorer
| Menu item | Data display | |
|---|---|---|
| Widget | The Widget sub-menu allows for the building and management of custom dashboard and PDF report widgets | 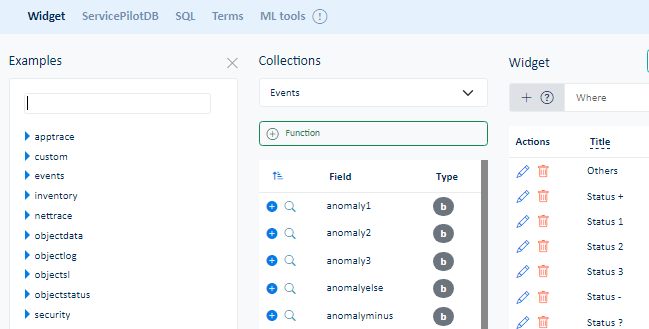 |
| ServicePilotDB | The ServicePilotDB sub-menu shows the current status of the ServicePilot NoSQL database and allows raw Lucene queries of the data | |
| SQL | The SQL sub-menu allows building and making custom SQL requests. These SQL requests can be run as Web API queries | 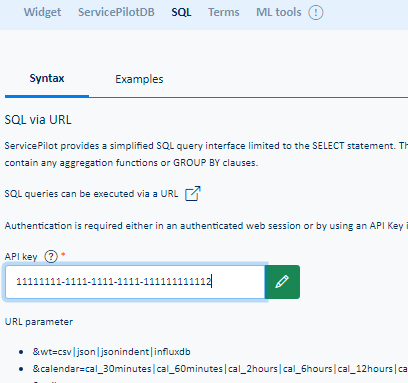 |
| Terms | The Terms sub-menu presents a list of pre-defined queries to the ServicePilot database | 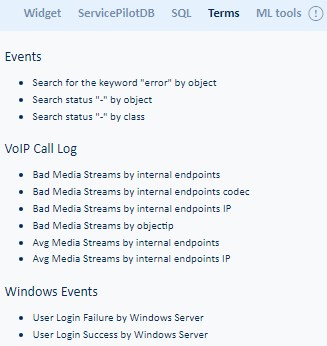 |
Setup
As an administrative user of ServicePilot, configuration may be changed under the Setup menu items. Start with Users, Agents, Provisioning and Policies documentation for more details.
| Menu item | Data display | |
|---|---|---|
| Provisioning | Modify resources to be monitored using the View editor, of via the Resources list. Packages and How to documentation is provided to automate provisioning and provide data to ServicePilot. | 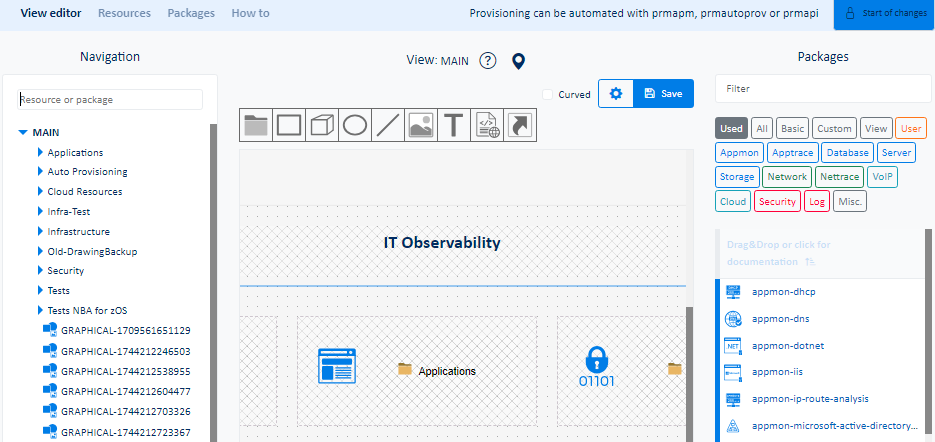 |
| Agents | View, install and manage ServicePilot Agents | 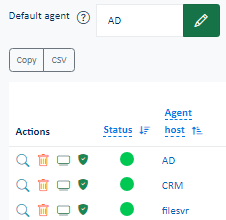 |
| Parameters | Landing page for ServicePilot Administration and settings | 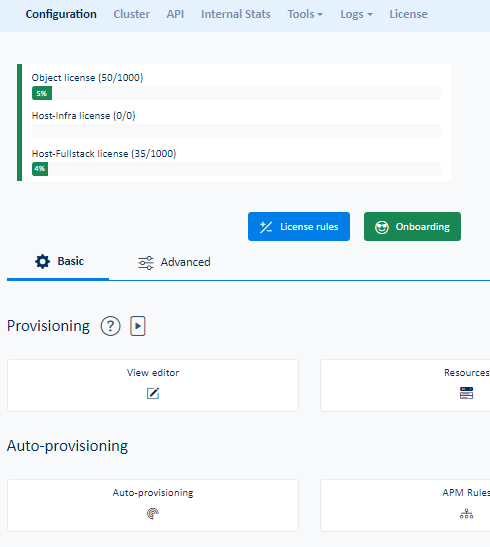 |
Concepts
What is a Package?
A deployment entity which contains definitions (classes, view, objects, dashboard, PDF reports)
A package is a collection of pre-configured elements that can be imported into a ServicePilot configuration. A number of parameters are applied to the package when importing it into the configuration to monitor equipment as desired. These parameters are package dependent but a graphical wizard presents the information requested.
ServicePilot provides a host of build-in packages to monitor different equipment types. If a package does not exist for a particular device, it is often possible to monitor this device using a collection of built-in packages to monitor different parts of the device's operation.
Example: A
server-microsoft-windows-snmppackage defines components of a Windows Server to monitor (Disk, CPU, Memory, Ethernet, etc) and how to discover and monitor each of these using SNMP.
What is a Resource?
Use of package
A resource is one use of a package in the running configuration. The package definition plus the unique parameters applied in the package wizard result in a unique resource that helps build up the elements monitored by ServicePilot.
Example: A
server-microsoft-windows-snmppackage is added to the ServicePilot configuration and becomes a resource to be monitored by the provisioning of this package with specific package parameters such as SNMP access credentials.
What are Views?
Hierarchical containers to organize resources by location or business function
Objects containing statistics are added to ServicePilot by placing them in a logical hierarchy of elements called views. Each uniquely named view may contain other views or objects as well as other graphical elements. The nested views allow different hierarchies to be built up by ServicePilot administrators, possibly to present equipment by geographic location or service grouping.
The worst status of the monitored equipment percolates up from the indicators to their container objects and then on to the view in which the object is placed, all the way up the hierarchy to the root MAIN view.
Example: An
Office Aview might be created as a container in which to place all servers, network switches and applications that are based at this particular location.
What are Objects?
A collection of statistics
Objects are uniquely named collections of indicators, each indicator being a captured or calculated statistic. Each object will collect data from a single source. Based on the availability of source data, object availability over time is calculated. If any indicators exceed defined thresholds then the object will also take on the state of the worst performing indicator. Objects may therefore be in the following states:
| State | Description |
|---|---|
 - OK - OK |
Object source data is available and all of the object's indicators are nominal or unknown |
 - Minor - Minor |
At least one of the object's indicators has passed a minor threshold but none of the indicators are currently major or critical |
 - Major - Major |
At least one of the object's indicators has passed a major threshold but none of the indicators are currently critical |
 - Critical - Critical |
At least one of the object's indicators has passed a critical threshold or the object is in a critical service anomaly state. |
 - Unavailable - Unavailable |
The object source data is unreachable or the object is in a unavailable service anomaly state. |
 - Unknown - Unknown |
The object's state has not been determined either because it has yet to collect data or it has specifically been told to ignore data by placing the object in an unmanaged state. An unknown state can also be the result of all indicator thresholds being set to unknown. |
Example: An object named
Server - eth0collects data from a single Ethernet interface.
What are Classes?
Object technical properties (definition of the collection, indicators, thresholds, …)
Classes regroup a series of properties forming the basis of a family of like objects. Each object is based on only one class definition, however multiple objects can be based on the same class. Classes define what indicators an object will have, the type of data expected for each indicator and how this data is calculated before being stored. Classes can also contain scripts to discover elements to be monitored and indicator statistics calculated from captured data. Finally, classes also specify the default indicator thresholds and capture frequency for objects.
Example: An 'Interface' class defines what objects based on this class will collect and their status thresholds. Each object based on this class will behave in the same way apart from collecting the information from a different source.
What is an Indicator?
A single statistic
Each indicator in an object presents a single statistic over time.
Indicators are either collected from monitored equipment or calculated:
| Indicator type | Source |
|---|---|
| Monitor | The indicator data is obtained by querying the monitored device |
| Complex | The indicator data is calculated based on the values of the monitored indicator data received |
| Information | An SNMP indicator or table that can be retrieved on demand |
| Control | An SNMP indicator used to check that values retrieved for the object still correspond to the same monitored element |
Example: An object named
Server - eth0includes indicators 'Status' and 'In Traffic'. Indicators like the 'In Load' percentage are then calculated.
What is a Threshold?
A threshold is a condition giving a status to an indicator
Each indicator can have up to 3 fixed thresholds, 1 dynamic threshold and 2 Machine Learning thresholds that will change the status of the indicator, the object and its view hierarchy.
| Thresholds type | Details |
|---|---|
| Fixed thresholds | These are three sucessive operators, three corresponding states and three fixed values that are tested against the indicator value. If no value matches, the state of the Else field is applied to the indicator. |
| ML spike threshold | If the indicator value deviates abruptly from its expected value, a ML spike threshold exception will be raised. ML spike is calculated only if a critical or unavailable fixed threshold is present on the indicator and a regression line could be determined. |
| ML cluster threshold | If the indicator value deviates from its expected value a number of times within a short time period, a ML cluster threshold will be raised. ML cluster is calculated only if a critical or unavailable fixed thresholds is present on the indicator and a regression line could be determined. |
| Dynamic threshold | Based on a script, determines whether or not it is necessary to activate the indicator thresholds. |
What are Events?
Unsolicited data receipt
ServicePilot may be sent SNMP Traps, Notifications, Syslogs or other custom log data. On receipt of events, additional meta-data can be added before storage in data collections by event type. This resource can then be queried and filtered as well as performing statistical analysis to produce graphs, lists and alerts.
Example: An SNMP Trap is received by ServicePilot. It is decoded and tagged with a 'Severity' label and stored in the Trap database collection.
What are Policies?
Common configuration applied to resources. Specified in resources or views.
See the Policies documentation for details.
Further information
The ServicePilot web interface contains texts and descriptions to help use the tool.
To view explanations, go to the built-in help pages:
| 1. Open the Help pop-up | |
| 2. Select one of the tabs |  |
Built-in help
| In many places a question mark icon provides further information, either as a tooltip or as more detailed web pages. | |
