Dashboards and PDF Reporting
What are Dashboards?
Tiled layout of widgets, each of which presents a different view of the collected data
Dashboards of data are made available to extract, collate and highlight statistics captured. Dashboards might present a summary of the environment for all elements of the same package or detailed statistics for a particular monitored element. There are four types of dashboard:
| Type | Description |
|---|---|
| Global | Overview dashboards, summarizing the status of an aspect of the supervision. For example: A summary of the availability and performance of all monitored components or a table counting the number of objects by object class. |
| Package | Per package summary dashboards. These dashboards provide statistics for all resources of the same type. For example: A summary of all Windows Servers, listing those that have the highest CPU, Memory and Disk usage. |
| Resource | A per resource dashboard. These dashboards collate information from just one resource, highlighting important statistics based on the resource type. For example: A network router will have a dashboard detailing the important statistics for this particular router. |
| Custom | Custom dashboards may be created by users to include any widgets they are interested in. Administrative users can see all custom dashboards and can make a Custom dashboard available to all users. |
Where to find dashboards?
There are a number of ways to access dashboards in ServicePilot.
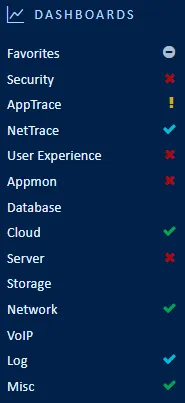
- Navigate to DASHBOARDS
From here dashboards are mainly found under two tabs.
| Tab | Description |
|---|---|
| Favorites | A number of dashboards that the user has tagged as favorites. |
| Custom | Global and custom dashboards can be accessed from this page as well as dashboards associed with provisioned resources. |
- Package and Resource dashboards may be accessed via ANALYSIS > Metrics.
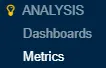
Dashboards presended under Metrics are categorized by package type.
| Level | Type | Description |
|---|---|---|
 |
Package category | Overview dashboards showing some key indicators from resources of the same gerneral category. |
 |
Package | Dashboards summarizing statistics for all resources of the same type. |
 |
Ressource | Dashboards showing important statistics for the resource. |
Time span
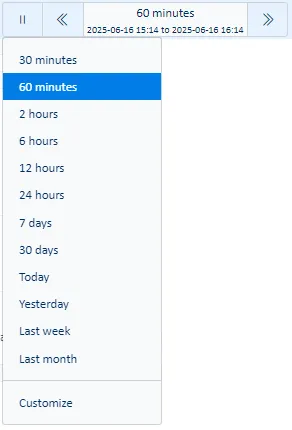
Whenever queries are made for historical data, there is always a time span filter presented at the top left of the screen. All queries will be made based on this filter.
To speed up queries, always select the smallest time span required and only expand the time span as needed once the query is known to contain the correct data. This is particularly true of event type data rather than polled data.
Note that if not data is presented when zooming in to a shorter time period in dashboards it is possible that this data is no longer present in the database. More detailed data is kept for a shorter time that the coarser grained indicator averages. Select a larger time frame or specify a more recent time period to obtain data from the database.
Dashboard query
It is possible to further filter any dashboard by adding an extra query to the data that is already presented.
| 1. Select the query button when viewing a dashboard |  |
| 2. Add a filter and click Apply |  |
Use the + icon the build up more complex queries using a dialog to select the elements required. If you need help with the query syntax, open the query help using the Question mark link.
If names contain spaces, then you can use double quotes or escape the space. If you want to use wild cards then you cannot use double quotes as the wild card is then not interpreted.
object:"my server"
or
object:my\ server*
Also note that some characters have special meaning and so need to be escaped. The list of escaped characters is provided in the help.
status:\?
This will return items that have a status set to unknown (?).
duration:[10 TO 60] AND -quality:*
This will return records with duration between 10 and 60 inclusive that do not contain a quality indicator.
Limit search to a part of the hierarchy
It is often useful to limit output to a part of the supervised equipment by filtering by view. If you select the view tag then this will only discover objects that are members of the view and not objects that are in all sub-views of the view selected.
view:"server - interfaces"
This will query objects that are in the server - interfaces view.
view3:site\ *\ servers
This will query all objects that are under a view at level 3, and beneath, that has the pattern site * servers. A level 3 view is a view at the third level of the monitoring hierarchy. For example MAIN > Sites > Site A > Site A Servers.
Limit search to items over a limit
It can be interesting to limit results to objects with indicator values above or below a value. By including this type of filter, data that no longer matches the information will be removed which might affect other queries that do not contain this indicator.
cpu usage>3
Be careful not to add extra spaces before or after the operator.
Look for records where a field contains text
When parsing logs, it might be interesting to find all records that contain or do not contain a particular word or part of a word. Bear in mind that the match will be done at a word level and not phrases. This means it is not possible to search for a sentence like: Error: unknown type. Instead a keyword of unknown might be used as the search term.
text:error*
or
!text:*error*
Please note that these types of queries take a lot of processing time and might even timeout. Limit the time span to get results in this case.
Create a custom dashboard
All users may create their own custom dashboards by cloning and changing an existing dashboard or starting from a clean slate.
| 1. Using a user with administrative or operator privileges, log in to ServicePilot. |
| 2. Open SETUP > Parameters |
| 3. Click on Reporting > Dashboards |
| 4. Either add a new dashboard with the + Add a dashboard button or use the blue pencil icon to edit an existing dashboard. |
Add widgets to a dashboard
New widgets are added to the dashboard by dragging the icon representing the new widget types to include.
Before letting go, make sure that a purple highlight appears to indicate where the new widget will be placed.
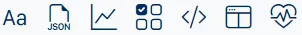
| Widget Type | Use |
|---|---|
 - Title or text - Title or text |
Include a title or text widget. Remember to complete the title and text fields in all languages used. If the Iterations checkbox is checked then this title becomes a header that is repeated multiple times based on the result of the Query field. {resource}, {object} or {view} variables may then be used in the title. The end of the section is defined by the next title at the same level. |
 - JSON widget definition - JSON widget definition |
Widgets are defined in terms of parameters in a JSON formatted document. You may extract the JSON definition of any existing widget using the copy button on the existing widget and paste the text here. |
 - Select existing widget - Select existing widget |
Existing widgets from built-in dashboards or custom dashboards can be selected and a clone inserted. |
 - Real-time View - Real-time View |
A widget showing the current state of a particular view in the view hierarchy. |
 - HTML and metadata - HTML and metadata |
A widget containing valid HTML text, pictures and metadata. |
 - Web page - Web page |
A widget containing a web page, embedded into the dashboard as an iFrame. The content may be auto-refreshed at a defined interval. |
 - Live Ping - Live Ping |
A widget that will ping an IP address every couple of seconds and display the latency graph. |
Edit dashboard widget parameters
Depending on the type of widget to be modified, some editing buttons will appear to the right of the widget title.
Note: The buttons only appear when the mouse is moved over the widget title.
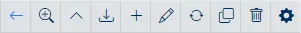
| Widget buttons | Use |
|---|---|
 - Move widget - Move widget |
Move the widget to the left. By using this action on a widget in the third column, it will move into the second column along with the existing widget. In this way it is possible to stack multiple widgets in one column against only one widget in another column. |
 - Widget pop-up - Widget pop-up |
Show widget content in a pop-up dialog box taking up more of the screen. This is useful to see larger views on more complex graphs. |
 - Hide/Show - Hide/Show |
Roll-up or Unroll the widget to just the title. |
 - Export to CSV - Export to CSV |
Export the raw data used to display the graph to a comma separated value (CSV) file. |
 - Add series - Add series |
Add a data series to the widget. |
 - Options - Options |
Edit widget parameters. Set the widget type and view presentation. A second dialog might be shown after editing the widget definition to set the widget title. |
 - Refresh - Refresh |
Refresh the content of just this widget. |
 - Copy widget definition - Copy widget definition |
Copy the JSON widget definition to the clipboard so that it may be viewed or re-imported as another widget. |
 - Delete - Delete |
Remove the widget from the dashboard. Note: If a widget is deleted by mistake, do not save the dashboard. Instead re-load the dashboard and make the correct changes. |
 - Edit - Edit |
Edit the widget JSON source definition. |
Custom dashboard parameters
Custom dashboard parameters can be accessed using the Parameters button.

Administrative users may set a dashboard as being available to a number of groups of users. Multiple groups can be selected using the standard shift or control meta-characters.
What are Reports?
PDF Reports present the same widget data as dashboards on the screen, except that they output this as PDF. Reports may be generated in a number of ways:
- From dashboard content - when viewing a dashboard
- When required - based on a report template
- Scheduled - from a report template to be stored or sent by email
View generated PDF reports
Users may view PDF reports that were scheduled and ran. Go to PDF Reports by clicking on the reports icon.
![]()
Export dashboard as PDF
When viewing any dashboard, click on the PDF on-the-fly button to generate a PDF report with the same content.

Create a Report template
A PDF report template is required to generate a report if it will not be generated on-the-fly from a dashboard. ServicePilot provides some sample templates but these might be customized by cloning their definitions and making changes. It is also possible to start a report template from scratch.
| 1. Using a user with administrative privileges, log in to ServicePilot |
| 2. Open SETUP > Parameters |
| 3. Click on Reporting > Edit PDF reports |
| 4. Select a unique report template name and specify if you wish to start from a blank report or an existing report template |
| 5. Once the report template has been added to the configuration it can be edited using the blue pencil icon |
Add widgets to a report template
New widgets are added to report templates by dragging the icon representing the new widget types to include.
Before letting go, make sure that a purple highlight appears to indicate where the new widget will be placed.

| Widget Type | Use |
|---|---|
| - Title or text |
Include a title or text widget. Remember to complete the title and text fields in all languages used. If the Iterations checkbox is checked then this title becomes a header that is repeated multiple times based on the Query field. {resource}, {object}, {view} and {hostname} variables will be defined based on the collection specified. At least one of these variables must be specified in the title. The first variable specified in the title can then be used in widget query field within the iteration. The end of the section is defined by the next title at the same level. |
| - JSON widget definition |
Widgets are defined in terms of parameters in a JSON formatted document. You may extract the JSON definition of any existing widget using the copy button on the existing widget and paste the text here. |
| - Select existing widget |
Existing widgets from built-in dashboards or custom dashboards can be selected and a clone inserted. |
| - View |
A widget showing the current state of a particular view in the view hierarchy. |
| - HTML and metadata |
A widget containing valid HTML text, pictures and metadata. |
 - Page break - Page break |
Add a page break. |
Edit report template widget parameters
Widget parameters are common between the report template widgets and the dashboard widgets. See the Edit dashboard widget parameters section for details.
Custom report template parameters
The report template name and description can be modified using the the Parameters button.
Scheduling reports
Scheduling a report to be generated every day, week, month, etc allows for the ServicePilot data to be distributed to people who would not normally use the monitoring tool's web interface.
| 1. Using a user with administrative privileges, log in to ServicePilot |
| 2. Open SETUP > Parameters |
| 3. Click on Reporting > Schedule a report |
| 4. Either add a new report with the + Add a scheduled report button or use the blue pencil icon to edit an existing report schedule. |
| 5. Select a unique report name and complete the report settings before clicking on OK |
| Report setting | Use |
|---|---|
| Template | Select a report template |
| Generation frequency | Specify the frequency at which the report will be generated. If Manual generation is selected, then the report will not be generated on a schedule but will be available to be generated as needed from the PDF reports menu entry. Reports generation times are based on the ServicePilot server's local French time zone. |
| Content | The Security group and High level view limit the results returned in the report to what users of the group have access to. The Content timeframe sets the time span over which data will be returned. This can be further filtered by a Time period filter that can limit results to open hours only. This is useful when the report should only include availability, performance and alert details for service level agreement monitoring that exclude scheduled maintenance periods. |
| Layout settings | Indicate the page format to use and if a table of content is to be added. |
| Localization settings | Set the report language, number format and time zone over which the data will be presented. |
| Email settings | If the report is scheduled, it may be sent to a comma separated list of email addresses. The email Subject and Email body fields may contain {FREQUENCY}, {PERIOD}, {REPORTNAME} and {PDFNAME} variables. |
| Notes | Add manual notes under titles based on the title reference specified. |
