Application Tracing with ServicePilot
OTEL, Zipkin and other Libraries Integrations
With ServicePilot, integrating OTEL, DD agent or Zipkin is seamless and straightforward. Our plug-and-play solution simplifies the incorporation of these tracing standards, enhancing your monitoring capabilities without complex configurations.
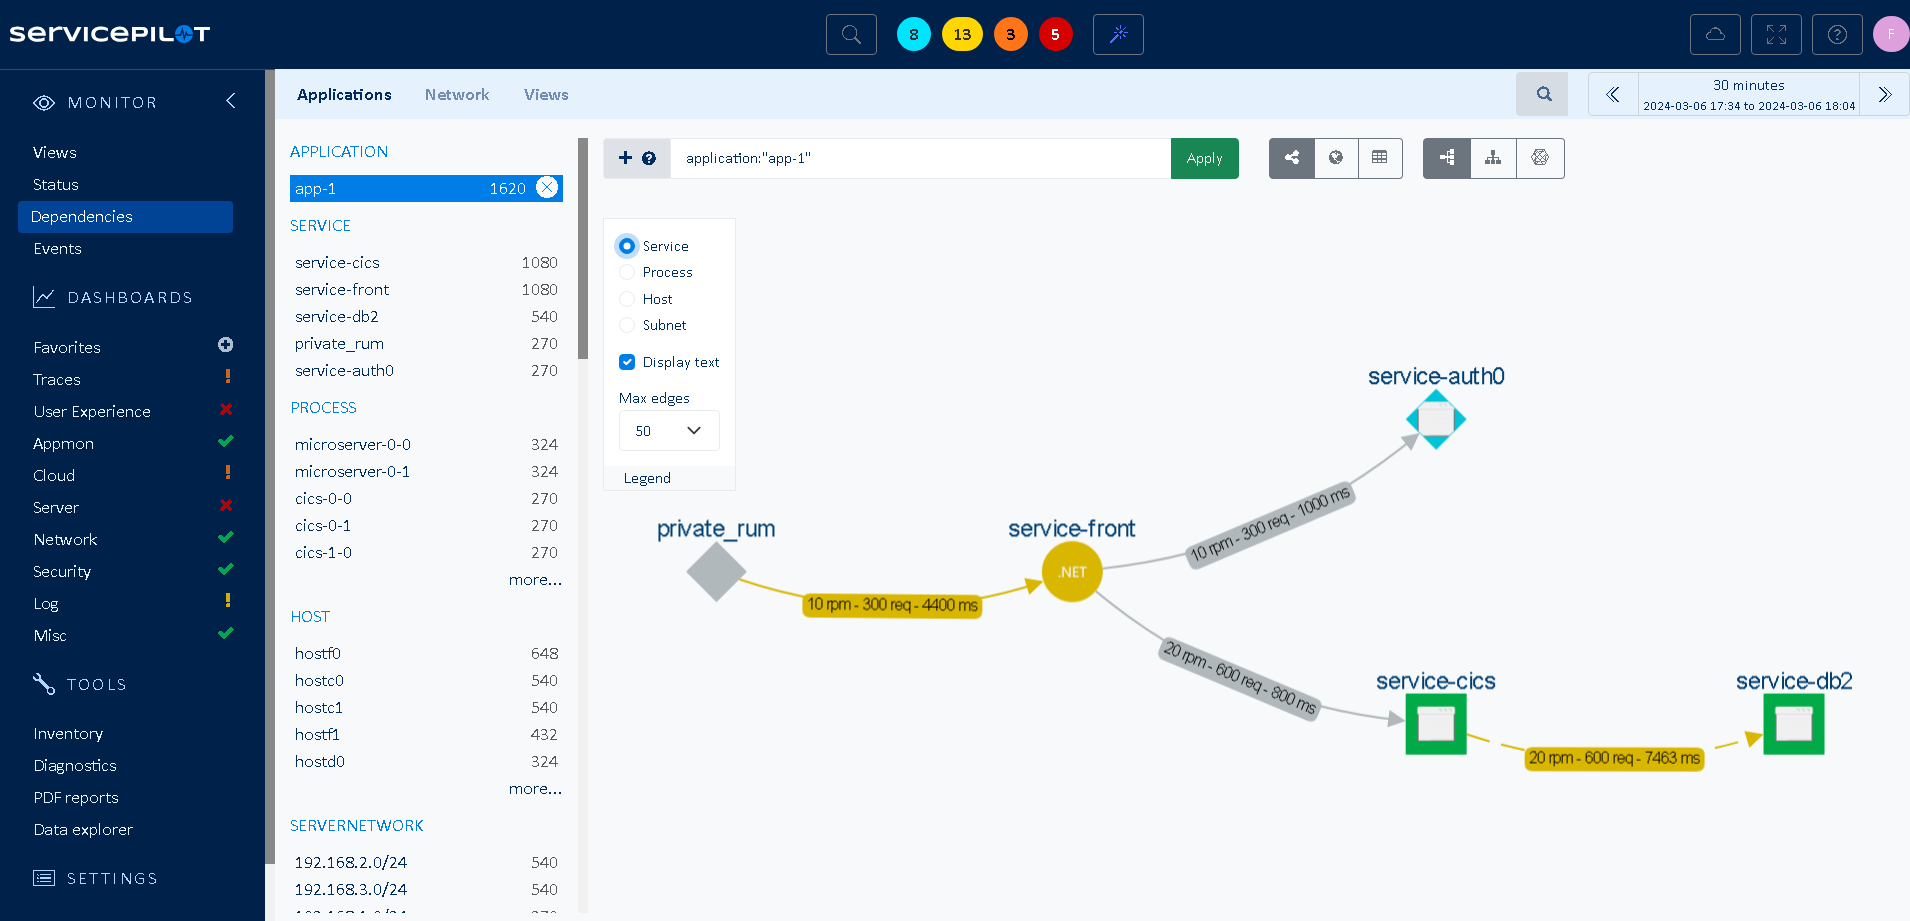
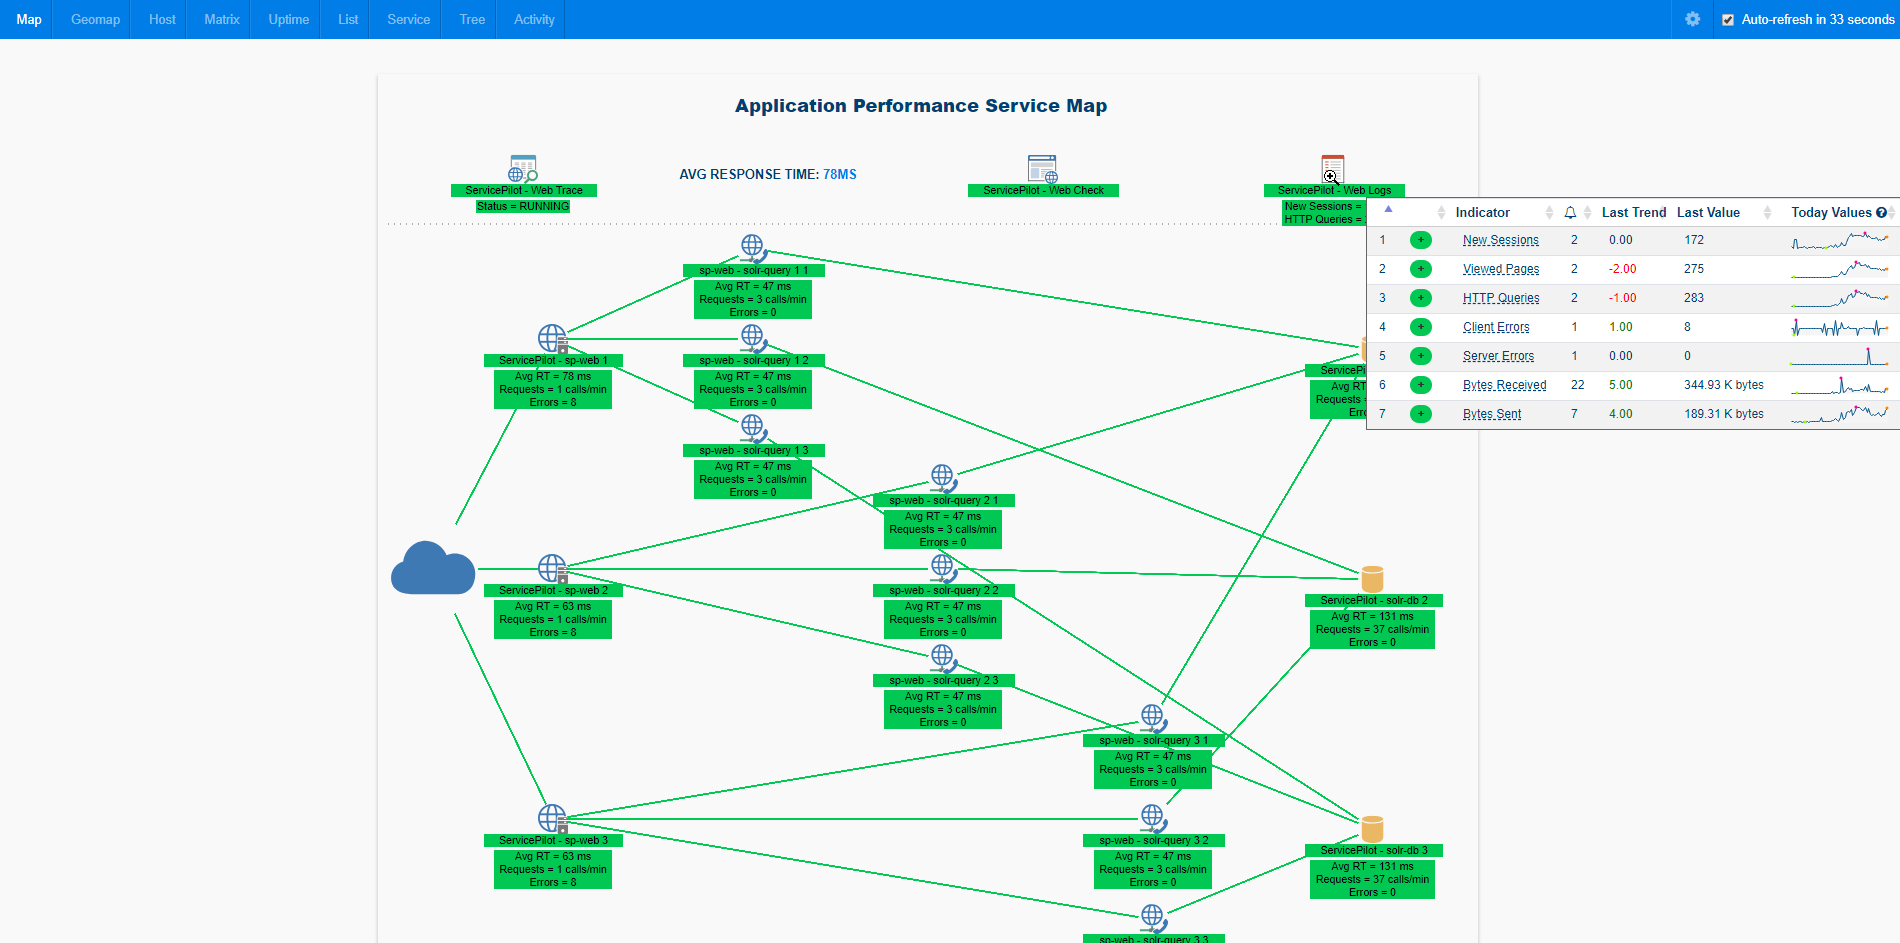
Application dependencies are automatically mapped and built-in SRE dashboards expedite the process of spotting latency issues for multiple applications and services
- Easy Integration: Quickly set up and start utilizing OTEL, Zipkin and DD traces
- Expanded Monitoring: Broaden your tracing capabilities with diverse, industry-standard integrations
Applications, Dependencies and Traces Visual Representations
Visualize your application landscape with ServicePilot's intuitive representation of applications, their dependencies and trace data. Advanced dashboards enable drill into your applications to analyze latency distribution or error rate per transaction.
This visual approach aids in understanding complex application interactions and pinpointing potential issues. Our intuitive query and filtering features help you refine your visualizations further to focus only on the data you want to observe.
- Clear Visualizations: Easily comprehend application relationships and behaviors
- Enhanced Understanding: Identify issues and optimize performance through detailed visual data
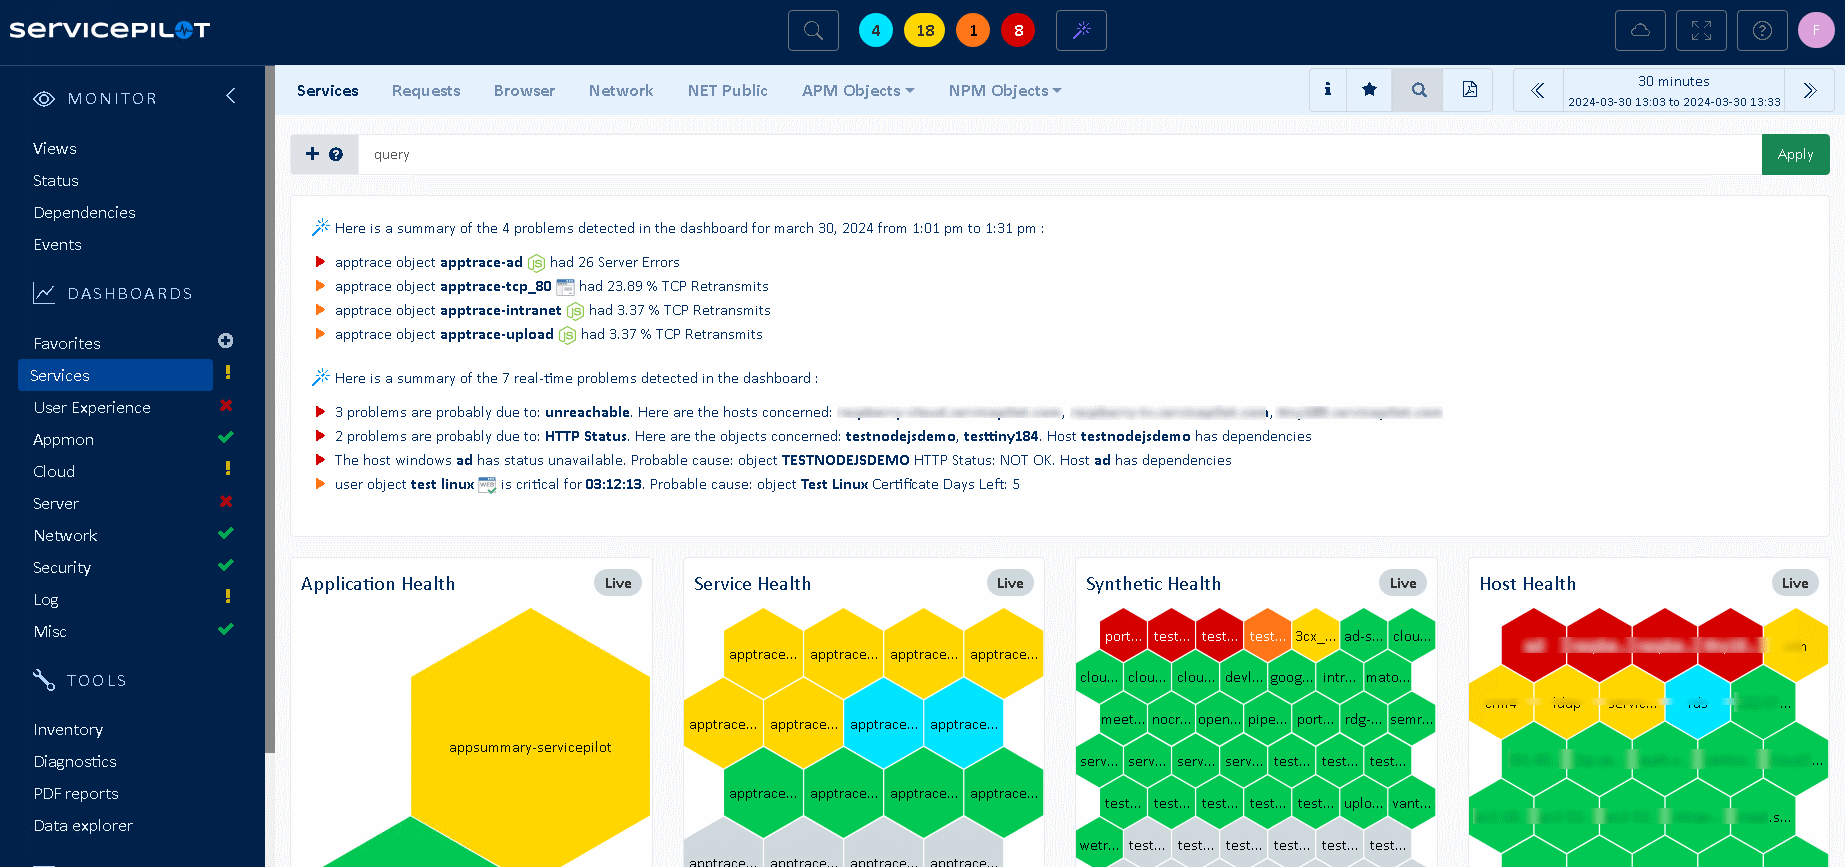
ServicePilot AI to Solve Distributed Application Issues Faster
ServicePilot employs advanced AI algorithms to accelerate problem-solving in distributed applications. It ensures smoother operations and enhanced efficiency.
This technology quickly identifies problematic issues and anomalies, leading to faster and more accurate issue resolution. AI analytics coupled with ML pattern correlation allow to concentrate on abnormal bottlenecks and specific transactions causing delays or errors.
- AI-Driven Insights: Harness AI for rapid anomaly detection and pattern recognition
- Efficient Troubleshooting: Reduce resolution times for distributed application issues
Fully Automatic Instrumentation for .NET, Java & NodeJS
ServicePilot takes application tracing a step further with fully automatic instrumentation for .NET, Java and JavaScript NodeJS applications without touching a single line of code.
This feature, combined with profiling and other observability capabilities, offers an unparalleled view into application performance, enhancing monitoring and troubleshooting processes.
- Automatic Instrumentation: Effortless setup for .NET, Java & JS application tracing
- On-demand Profiling: Gain in-depth insights into application performance for targeted optimizations
Distributed Application Tracing and Dependency Monitoring
Smart Alerts for Proactive Response
Compatible with OpenTelemetry, we deliver smart alerts and notifications based on APM indicators such as latency or errors.
Multi-platform Performance Optimization
Optimize your applications performances with any chosen programming language: Java, .NET, PHP, Node.js, Ruby, Python, Go and C++.
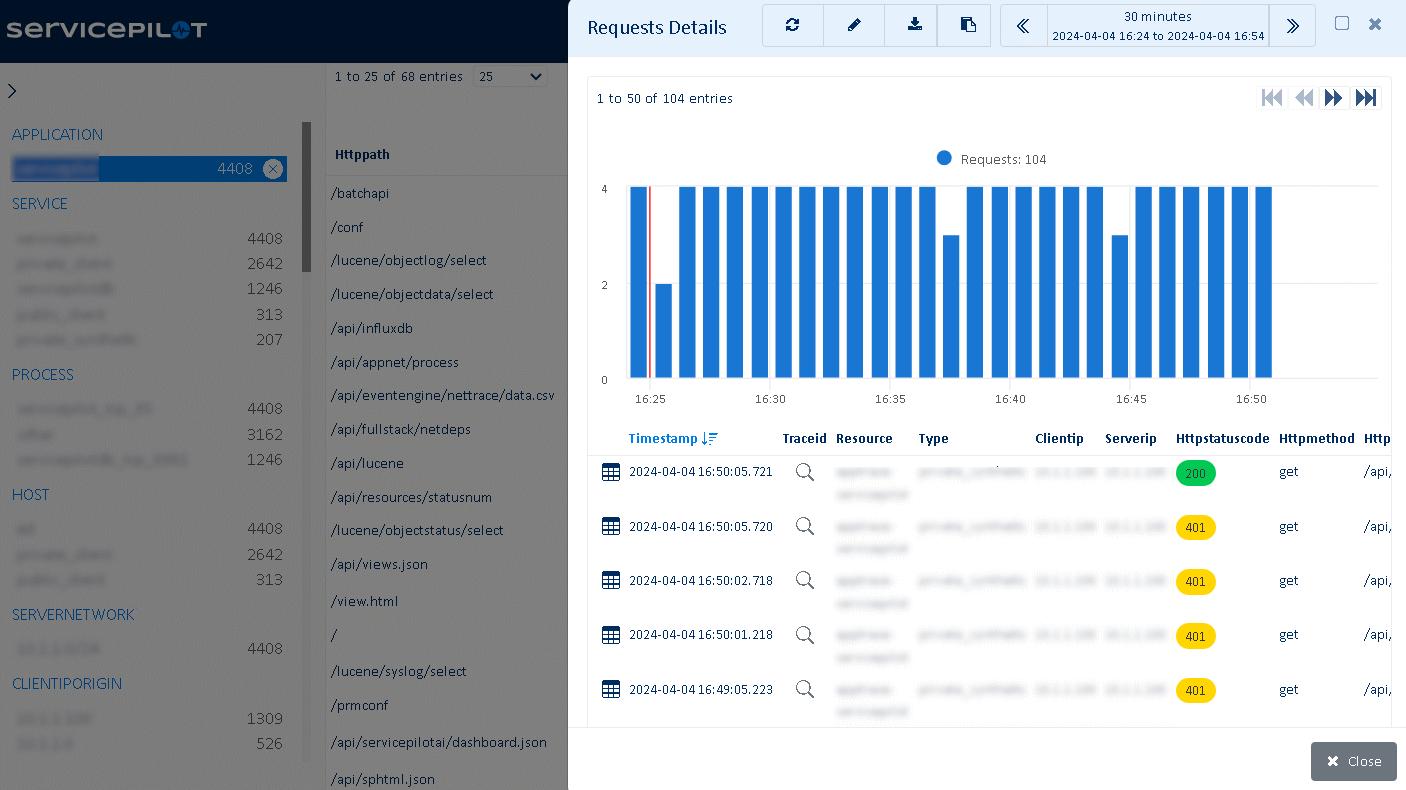
Live and Historical Performance Analysis
Analyze the availability and performance of your web application. Both real-time and past data will help you understand how your application is performing to improve it.
Custom Visualization for Key APM Data
Our visualization options help you easily understand how well your application is performing. This helps you make decisions based on custom data to improve your application's performance.
Application Trace Integration examples
Other Application Trace Solutions
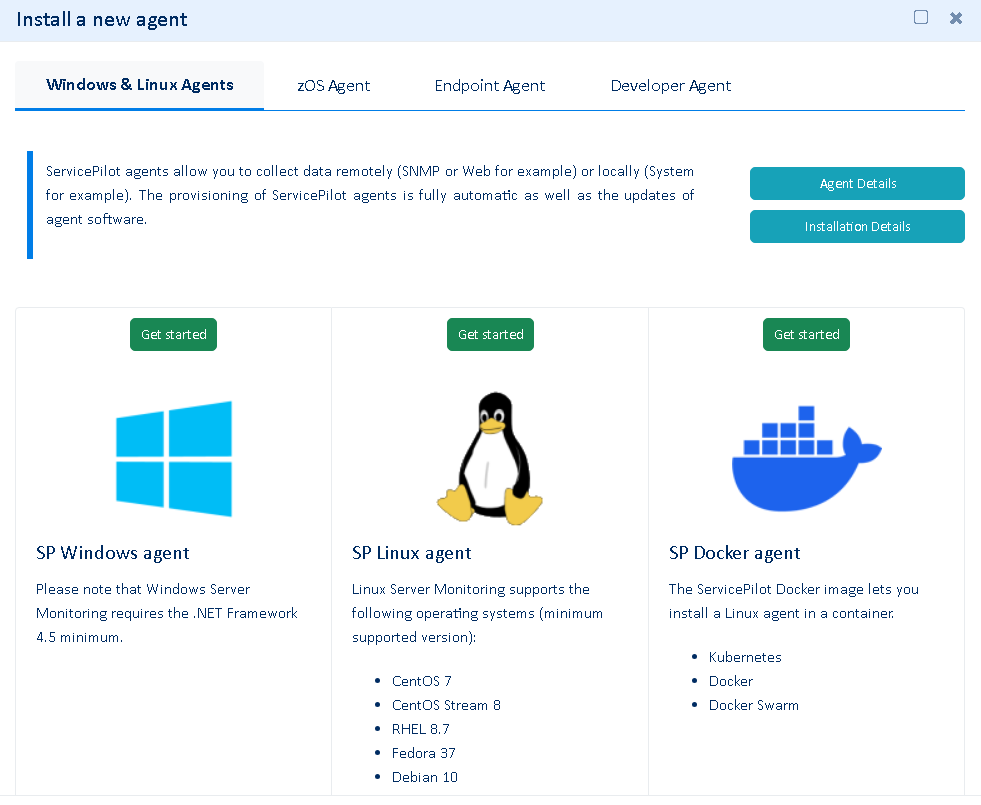
Free installation in
a few clicks
SaaS Plateform
- No on-premise software setup, servicing and configuration complexity
- Instant setup, complete and pre-configured to ensure robust monitoring
OnPremise Plateform
- Contracts and commitments over time ( > 1 year)
- Performance, Data Storage and Infrastructure Management
- 2 additional solutions: VoIP and Mainframe monitoring
