What is a Web check?
A Web check is a single HTTP request to a Web application. It's a simple, quick way to monitor the availability and performance of a website or Web service. It can be used to verify that a Web server is responding as expected, that a webpage is accessible, or that a specific element on a page is present and functioning correctly.
ServicePilot's Web check supports both HTTP and HTTPS, and can be used to periodically test a Web application page and extract data as indicators. If the Web application is only accessible via a proxy, the request is routed through the specified proxy. This allows for monitoring of Web applications in a variety of network configurations.
Web checks can be particularly useful for monitoring the uptime and performance of critical Web applications, identifying issues before they impact users. They can also be used to track performance trends over time, helping to identify potential areas for optimization.
Some of the key metrics that can be collected through Web checks include:
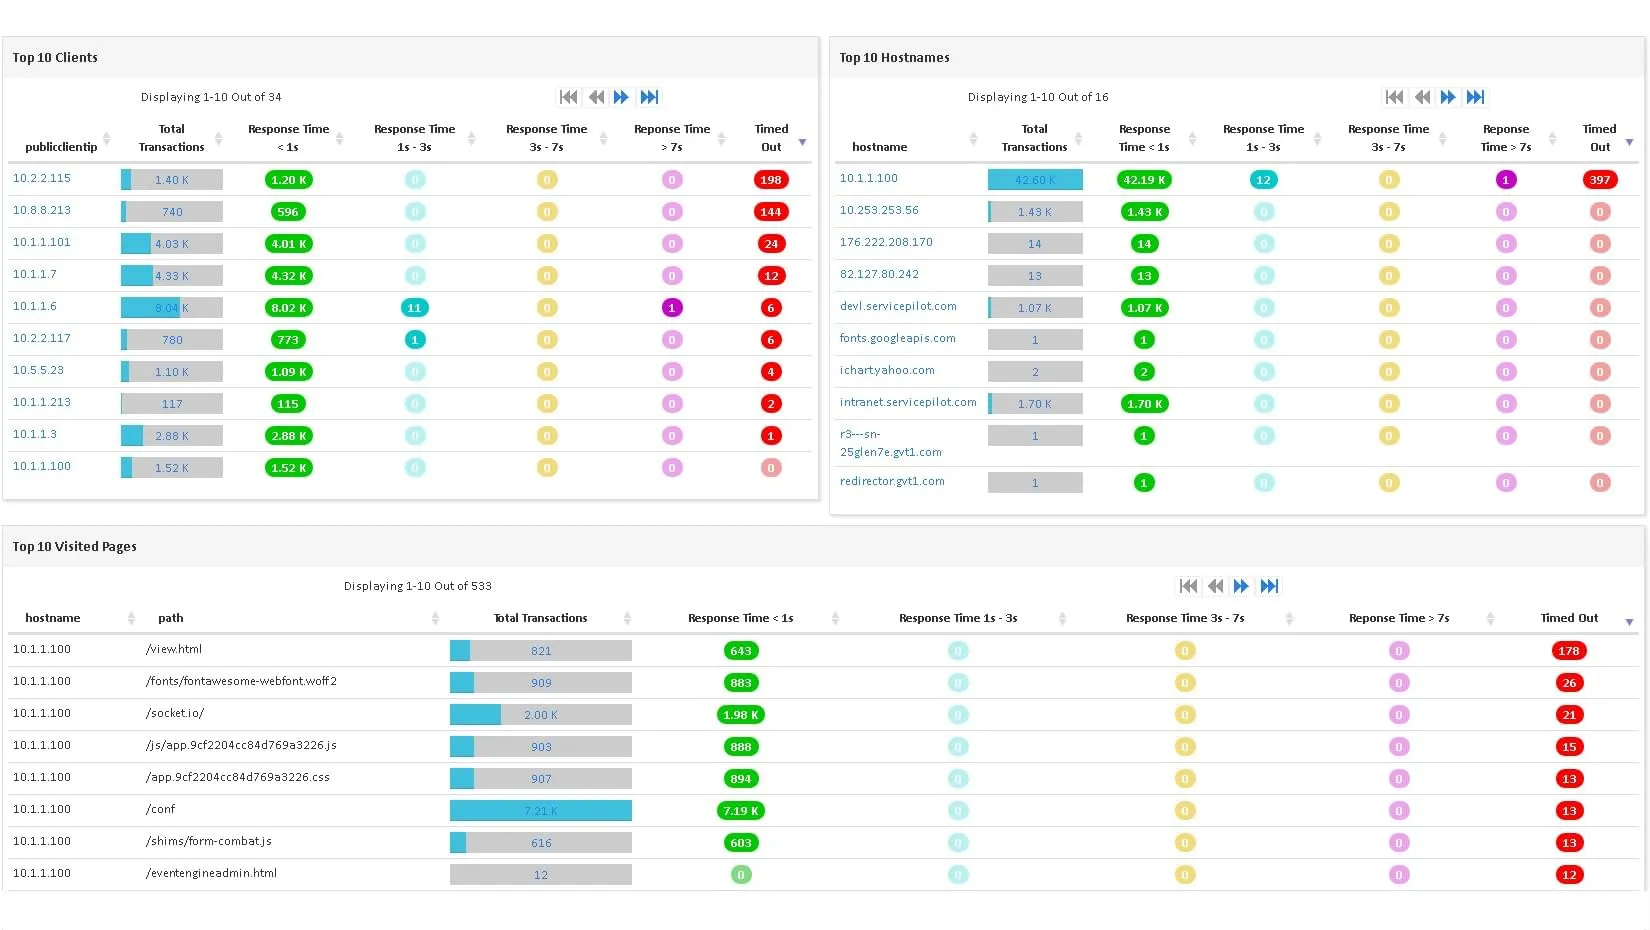
- Response Time: The time it takes for the server to respond to the request.
- Status Code: The HTTP status code returned by the server, which can indicate success, failure, or other conditions.
- Content Verification: Checks for specific content on the returned page to ensure the page is loading correctly.
How to monitor applications with Web checks?
ServicePilot makes it easy to monitor Web checks with no configuration required on the target server. A resource of the user-webcheck package then needs to be added via the ServicePilot Web interface.
The ServicePilot Agent retrieves the target page to get only the HTML source content of the page. JavaScript and Cookies are not processed during these requests.
Requests to pages can be customized as required e.g. using GET or POST methods, and with additional HTTP Headers and POST parameters. Page data can also be extracted as indicators and graphed (for numeric data).
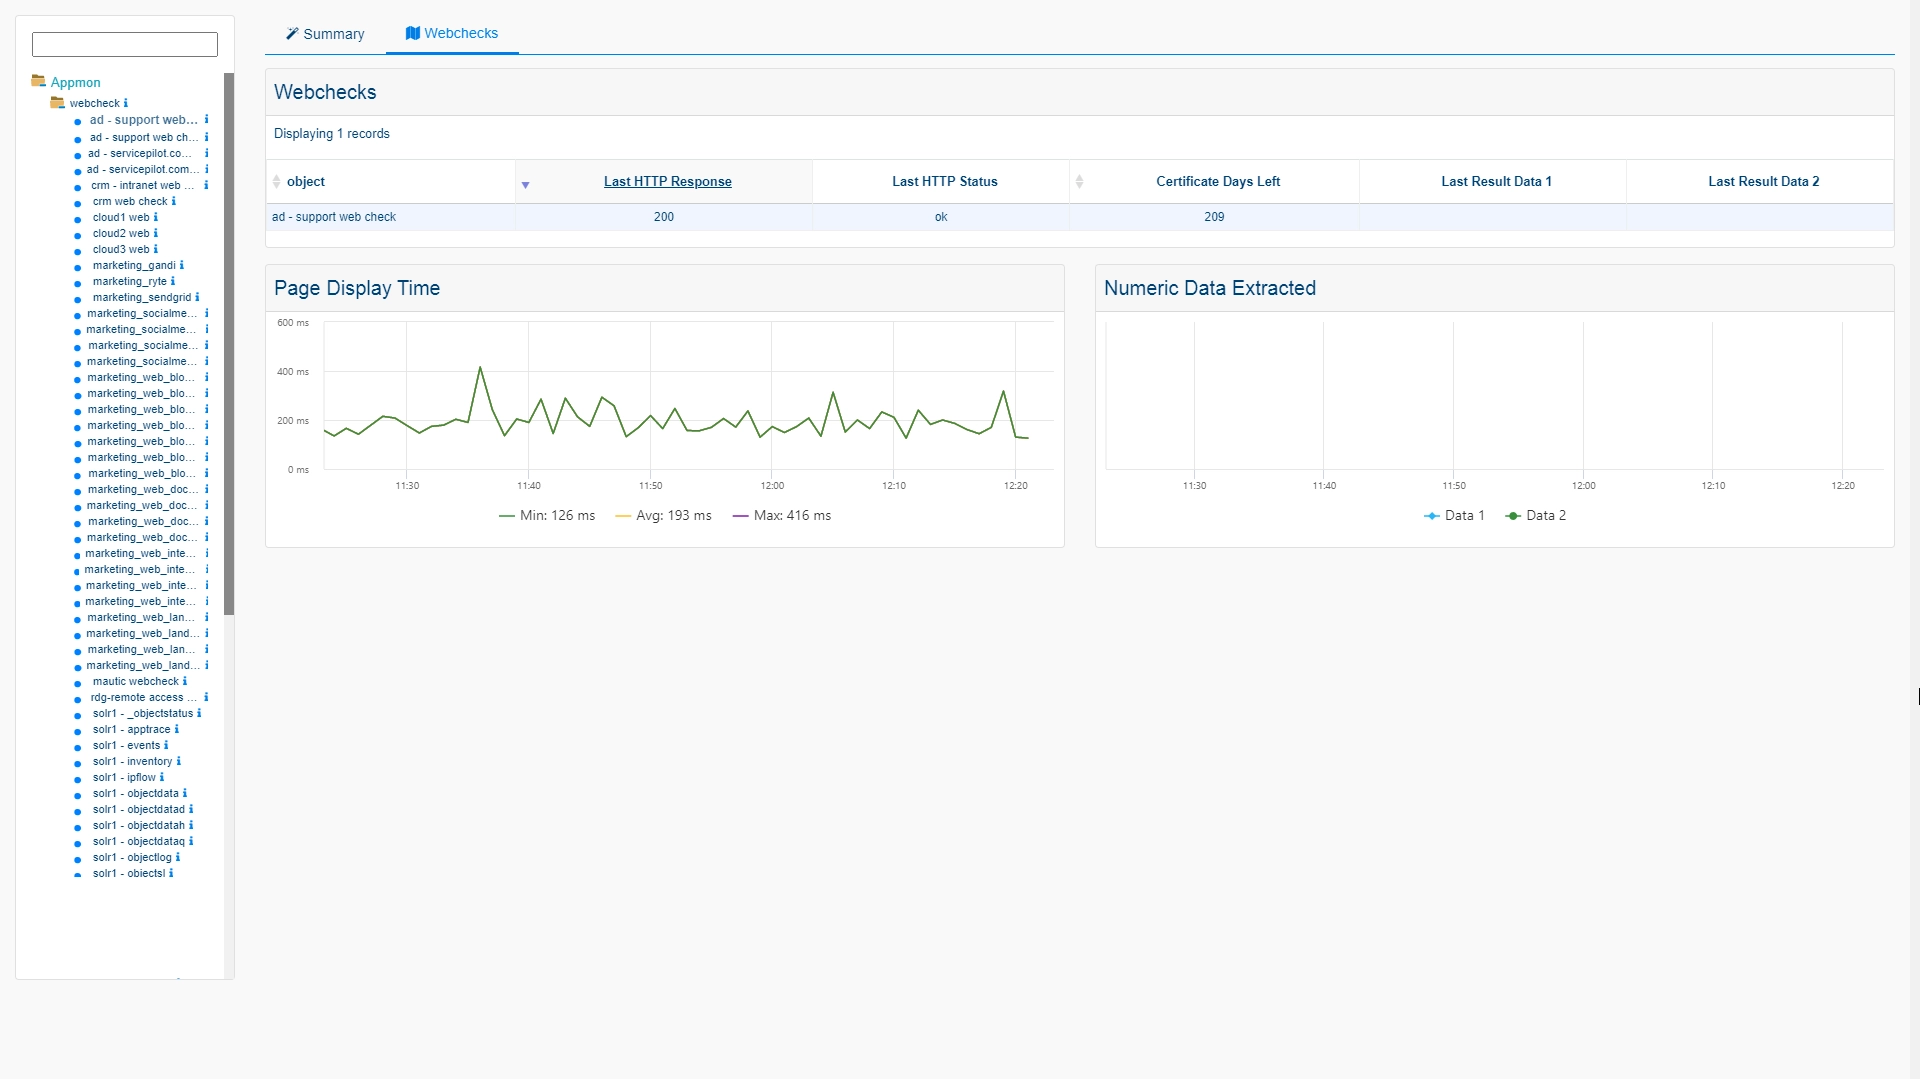
The indicators gathered for each Web check include:
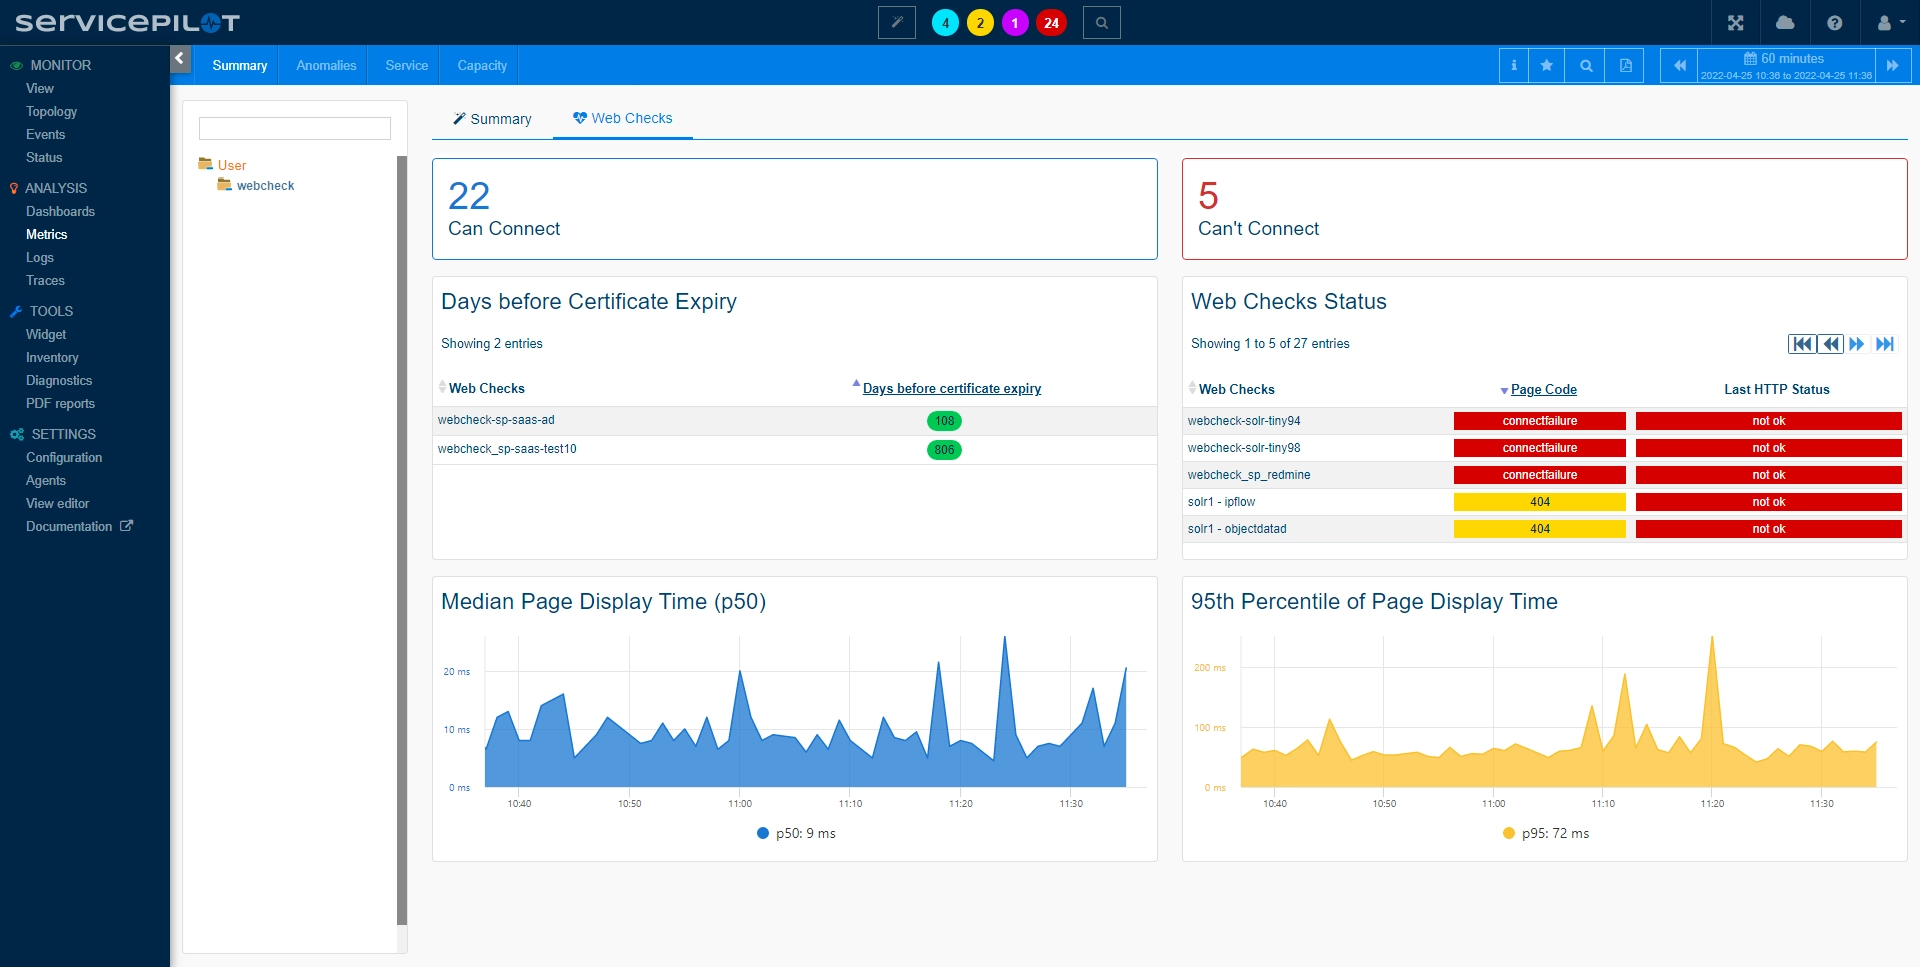
- Page Code
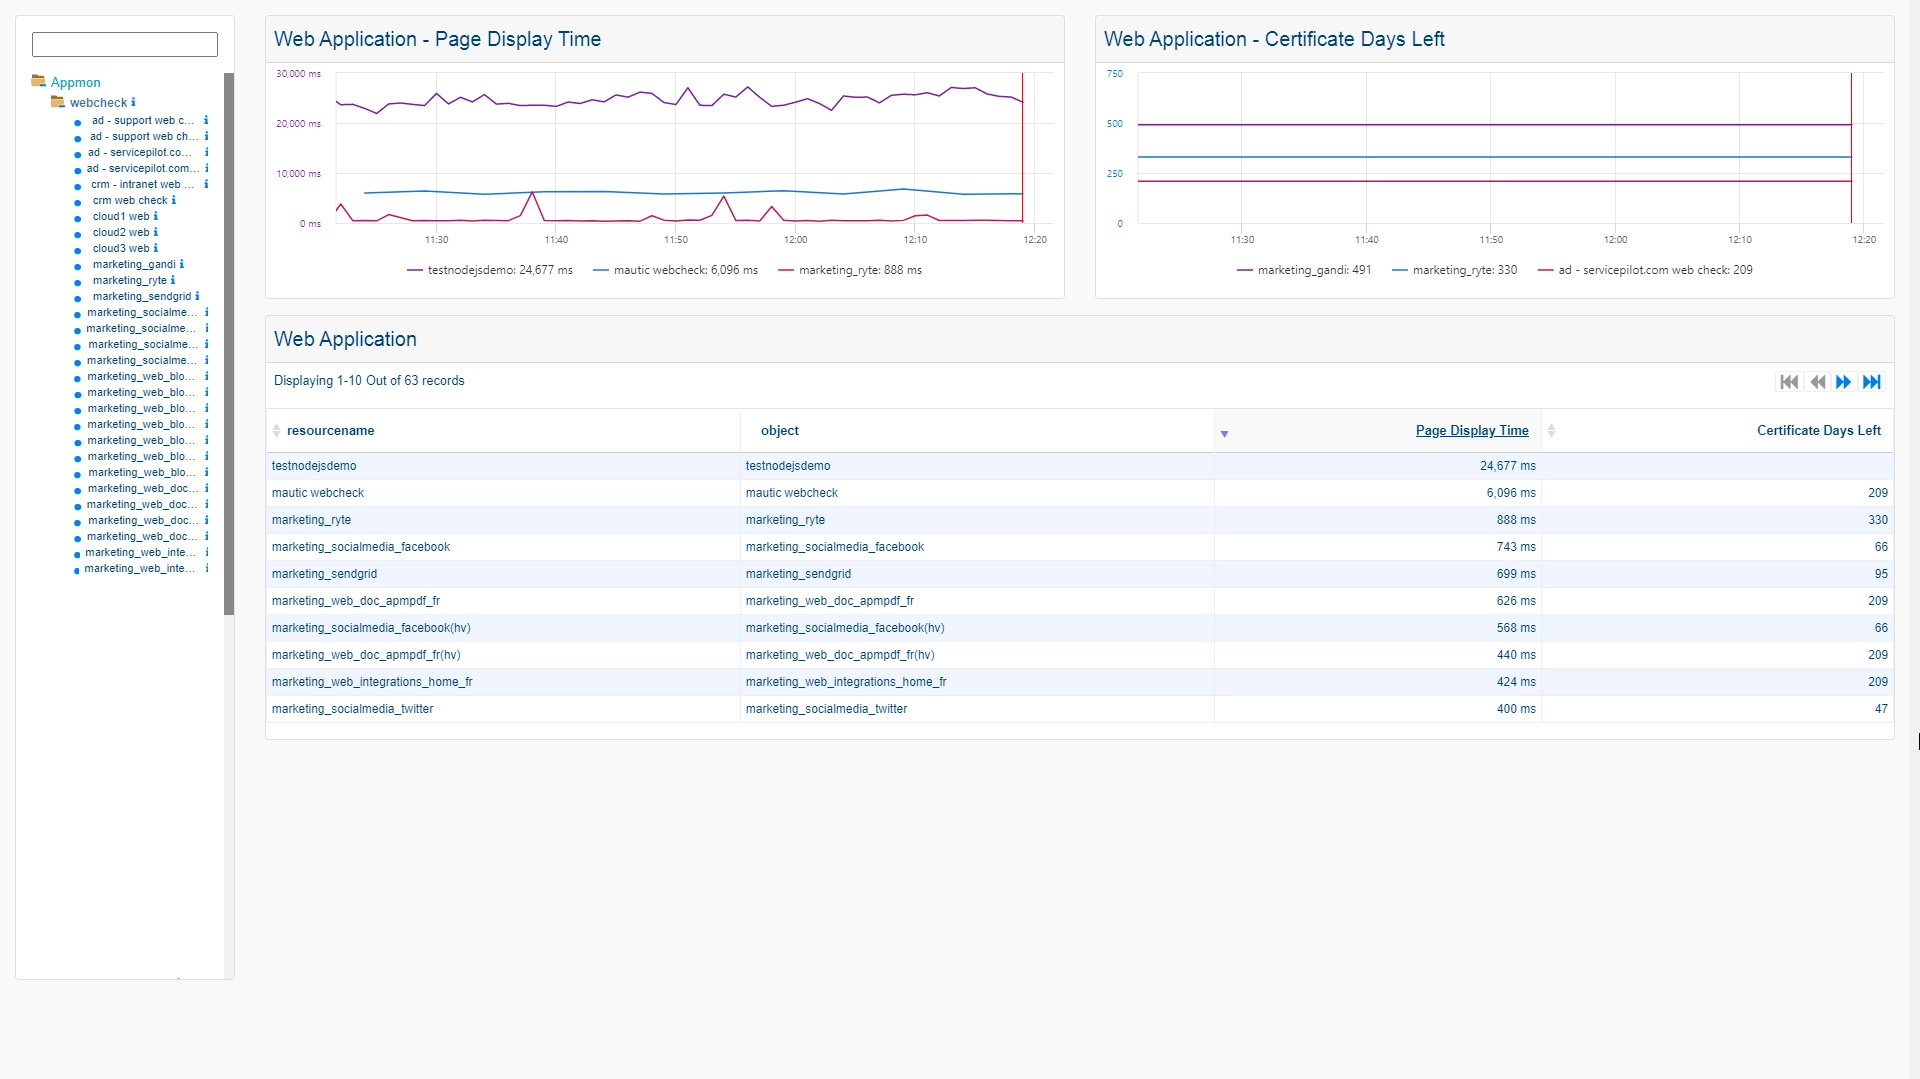
- Page display time
- HTTP status
- SSL Certificate information
- Certificate common name
- Number of days left before certificate expiry
- Custom indicator extraction...
URL Page code and HTTP status are a very good way to establish a Web application availability SLA baseline. Additional Web checks can be performed to cover different simple HTTP tests or accessibility scenarios.
A good indicator of your Web server application performance is the initial connection time to the application server (connection time), also known as "time to first byte". This is the elapsed time between request and the first element returned being displayed. See your browser's "Inspect" Network waterfall diagram. In general, this should be less than 1 second (or as small as possible), ideally under 200 ms.
Long Web application server response times delay page loading speeds and display time. Front-end optimizations are more than vital in order to optimize HTTP(S) Page Display Time. Page display time should ideally be under 3 seconds.
How to install a webcheck resource?
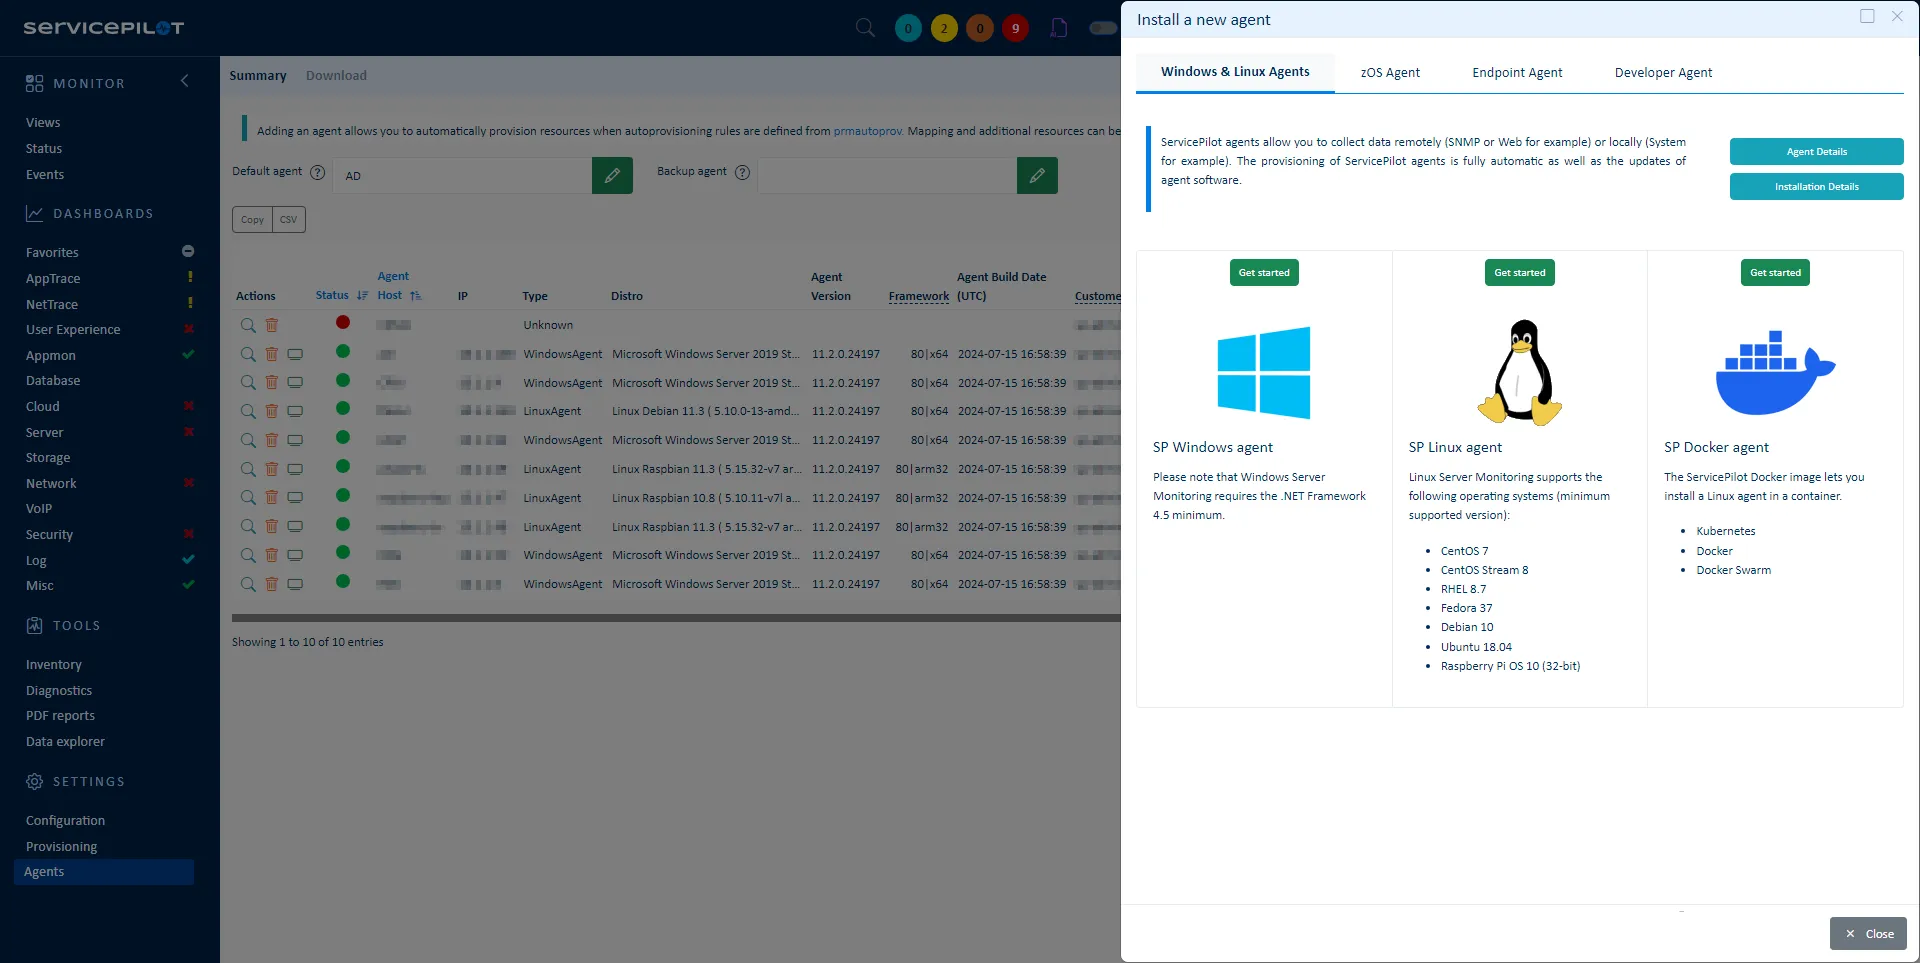
- Use your ServicePilot OnPremise installation or a SaaS account.
- Add a new webcheck resource via the web interface (
/prmviewsor/prmresources) or via API (/prmpackagespage), the default ServicePilot agent or another agent will be provisioned automatically.
Details of the webcheck package are located in the
/prmpackagespage of the software.
Benefits
ServicePilot enables you to deliver IT services faster and more securely with automated discovery and advanced monitoring features.
By correlating the technology WEBCHECK SYNTHETIC with APM and infrastructure monitoring, ServicePilot is able to provide a more comprehensive view of an organization's IT environment.
This allows IT teams to quickly identify and diagnose issues that may be impacting application performance, and take corrective action before end-users are affected.
Start with a free trial of our SaaS solution. Explore our plans or contact us to find what works best for you.