Log Management and Analysis
Efficient Log and Data Collection
ServicePilot is a robust solution for swift event collection from several IT log sources. Our system supports various formats, including Syslogs, SNMP Traps, Windows Events, W3C, IIS, CDR and files. This helps centralize and store all the log data in one place for analysis.
Let's consider an IT company with complex systems that generate a big amount of log data. With our software, they can centralize all their log data of any format, making sure that all relevant data is captured for analysis.
- With efficient log and data collection you can simplify your IT operations, make better decisions
- It ensures robust security and promotes operational efficiency
Real-Time and Historical Log Analysis
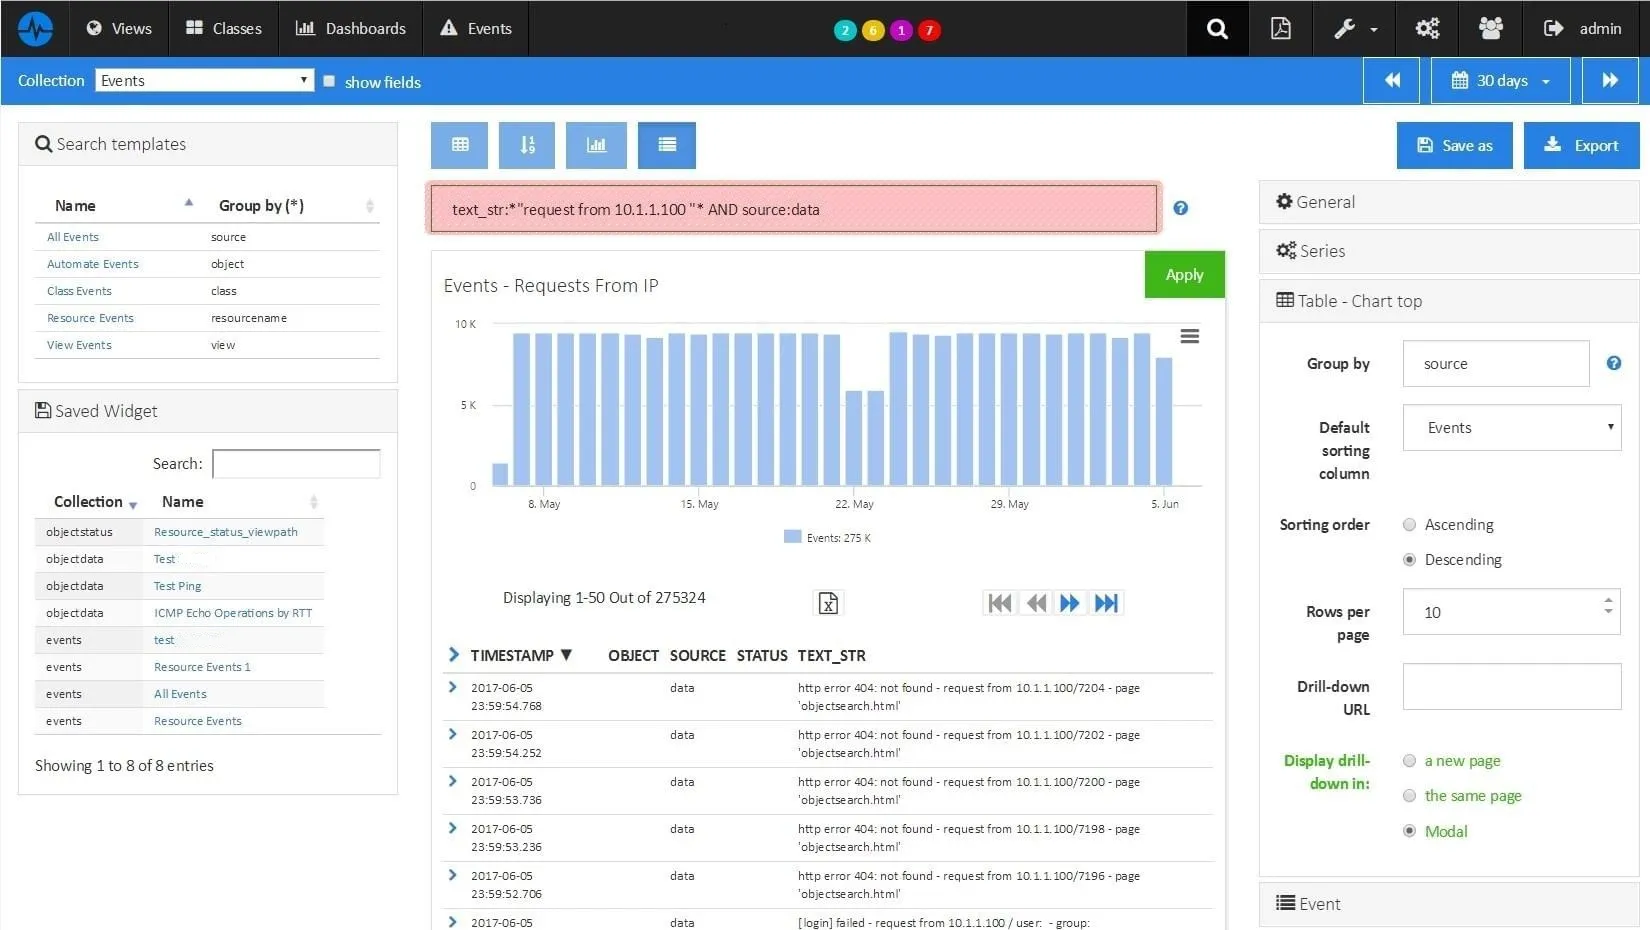
Our advanced interfaces help real-time and historical data analysis. It gives answers to crucial IT security questions such as why there are multiple logins to servers, unsuccessful logins, frequent attempts to change passwords, reboots, changes to user groups and more.
Let's take the example of a financial institution where data security is essential. With ServicePilot, they can analyze both past log data and in real-time. They can detect suspicious activities, keep track of patterns and quickly find as much security threats as possible.
- The ability to perform simple yet powerful log data analysis improves your IT security
- It also optimizes system performance and compliance requirements
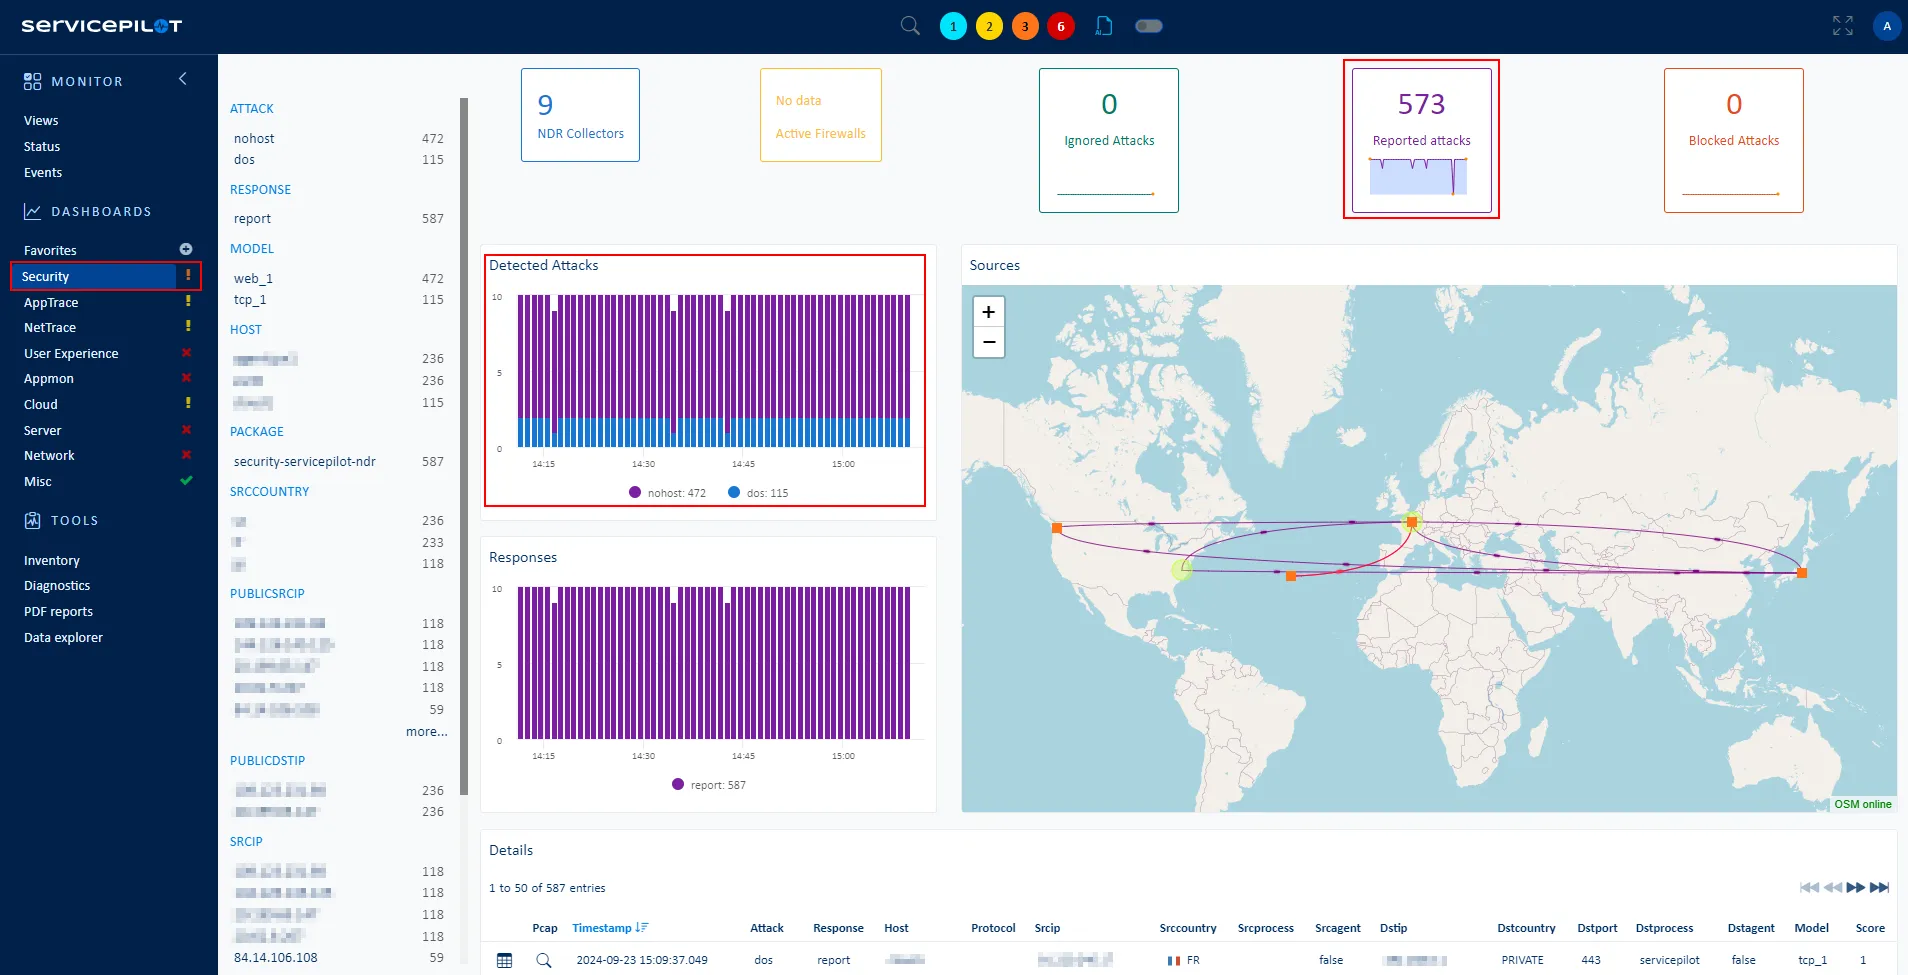
Interactive Dashboards
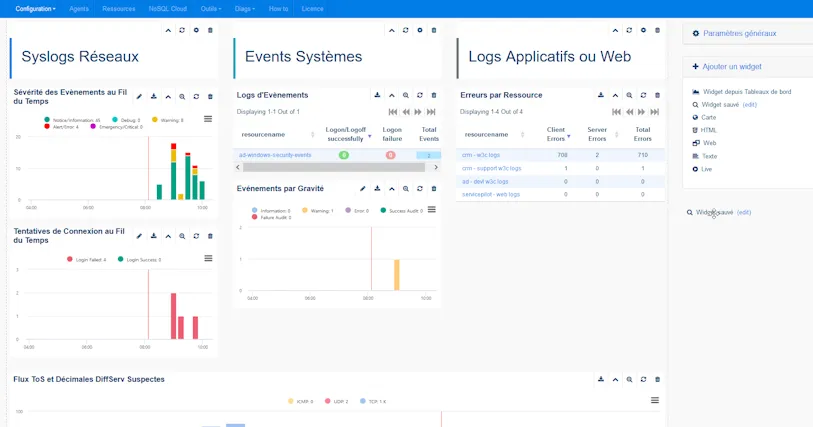
Our solution allows you to filter your logs and other data effectively. It helps you identify security threats and abnormal behavior that could indicate issues or attacks. By using filters, you can create dashboards that show data from different sources in a single view such as firewall KPI, VPN access, desktop performance or specific Windows Events.
Let's imagine a scenario in an IT operations center where thousands of logs are generated every minute. With our interactive dashboards, the team can correlate data from various sources, easily see abnormal patterns and respond to potential threats more quickly.
- By using interactive dashboards and analytics, you can make your threat detection better
- It improves the response times and maintains a secure IT environment
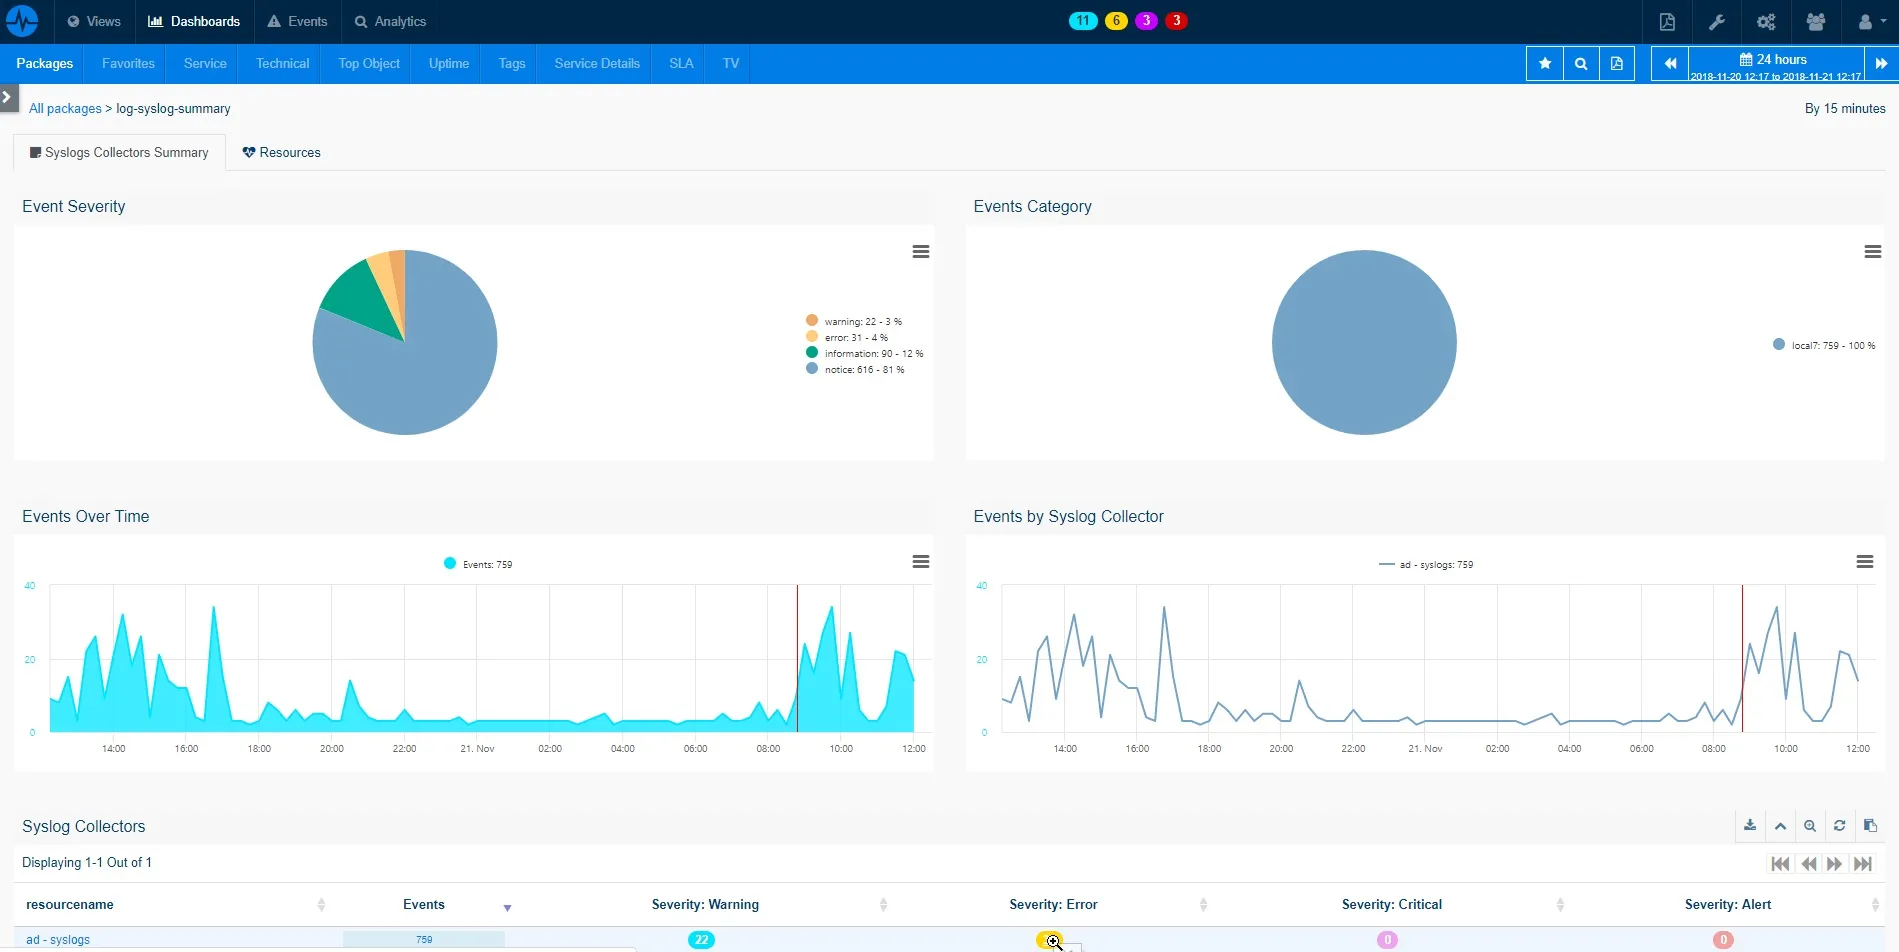
Converting Logs into Actionable Metrics
ServicePilot has a special way of turning logs into relevant metrics. This helps us analyze many different logs and make rules for when to send alerts based on specific metrics. It also helps us set limits for when to send alerts based on certain events and shows us trends in the data visually. This makes it easier to summarize and understand the important information.
Take an example of a tech company that deals with a deluge of log data daily. With our software, logs are turned into metrics so they can automate alert rules based on specific numerical thresholds. This means they can set alerts when the number of failed login attempts limit is reached allowing them to promptly address security concerns.
- When logs are converted into metrics, businesses enhance their ability to see trends
- They automate processes and extract critical insights from vast amounts of log data
Rule Definitions for Personalized Alerts
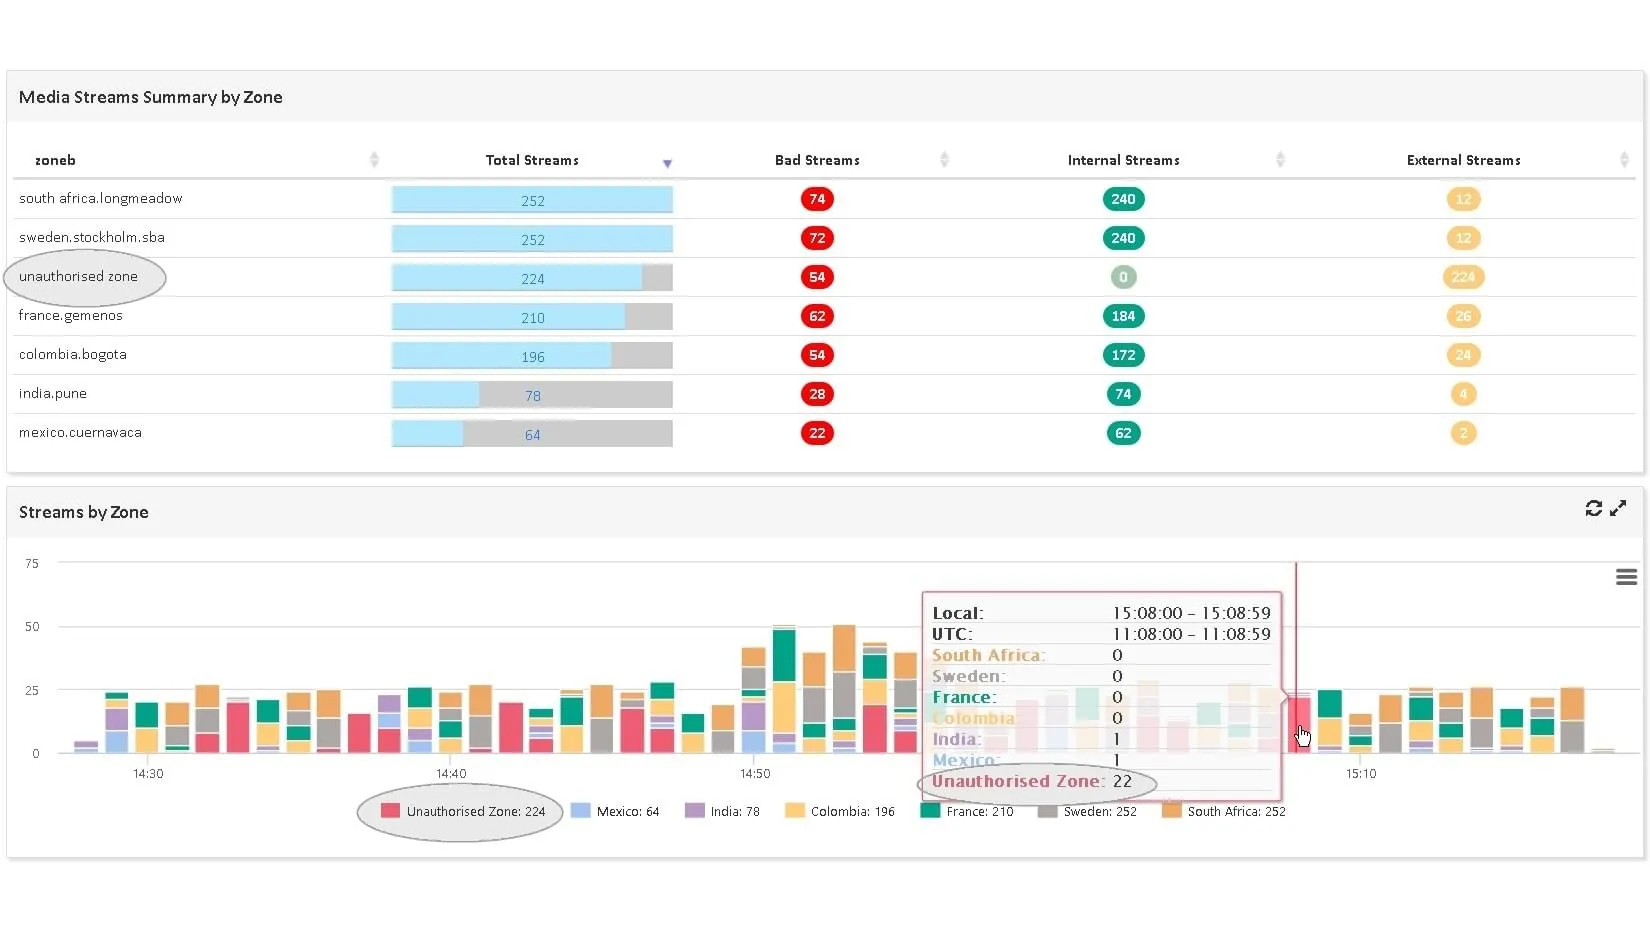
ServicePilot allows you to set up custom alert and log filtering rules. This helps you categorize visualizations and create event groupings by scope, technology or site to isolate and deal with issues effectively. By integrating NIDS/HIDS data into ServicePilot, you can centralize alerts from multiple security systems and exactly measure their impact on performance and monitoring.
Let's consider an organization with multiple branches across the country. They can define alert and log filter rules based on geographical locations, isolate issues at specific sites for solving problem quickly. Also, by centralizing alerts from different security systems, they can gain a global view of the entire security performance.
- Creating custom detection and alert rules helps to identify and isolate problems fast
- It also allows businesses to make better decisions based on data and improve their overall system's performance
In our trading room, we receive events from thousands of servers. ServicePilot helps us to quickly detect problems.
ServicePilot for Event Analysis and Log Management
Unified Source Analysis
Analyze all your log sources with a single monitoring solution to correlate IT silos and improve overall system understanding.
Big Data-Ready Solution
Collect, centralize and store your logs in a custom database to enjoy the benefits of fast search capabilities and efficient data management.
Dynamic Visualizations
Access the indexed events in the database through all your queries to generate pertinent graphs and understand your log data better.
Customizable Rules and Alerts
Create custom rules and set thresholds to trigger alerts, for real-time incident detection and swift resolution.
Log and security Management integration
Other Log Management Solutions
Free installation in
a few clicks
SaaS Plateform
- No on-premise software setup, servicing and configuration complexity
- Instant setup, complete and pre-configured to ensure robust monitoring
OnPremise Plateform
- Contracts and commitments over time ( > 1 year)
- Performance, Data Storage and Infrastructure Management
- 2 additional solutions: VoIP and Mainframe monitoring
