View the data
Data is continuously collected as soon as equipments and services are properly monitored. It is then centralized, processed and presented in the ServicePilot interface, where you can explore it through multiple visualization modes. It makes it easier to perform incident troubleshooting, track performance trends and build a clear, end‑to‑end understanding of your IT environment.
Monitoring
Real-time data, along with the current operational status of all monitored resources, can be viewed in various formats depending on the type of analysis required. ServicePilot offers a range of display modes that allow users to obtain an immediate overview as well as examine in greater detail the behavior, availability, or status changes of resources.
| Menu item | Data display |
|---|---|
| Views | The Views menu item shows data as a hierarchy of views that contain further views and objects and graphical elements. The objects contain indicators which store the data obtained. |
| Status | The Status menu item provides lists of resources, objects, classes and views by status. |
| Events | The Events menu item shows the changes in status of the resources, objects, indicators and views. |
| Hosts | The Hosts menu item allows you to view the status of hosts (data collected by source IP address / host name). |
Monitor menu
Views
| Menu item | Data display | |
|---|---|---|
| Views | The Views sub-menu shows a graphical representation of views and allows for navigation through the view hierarchy. | 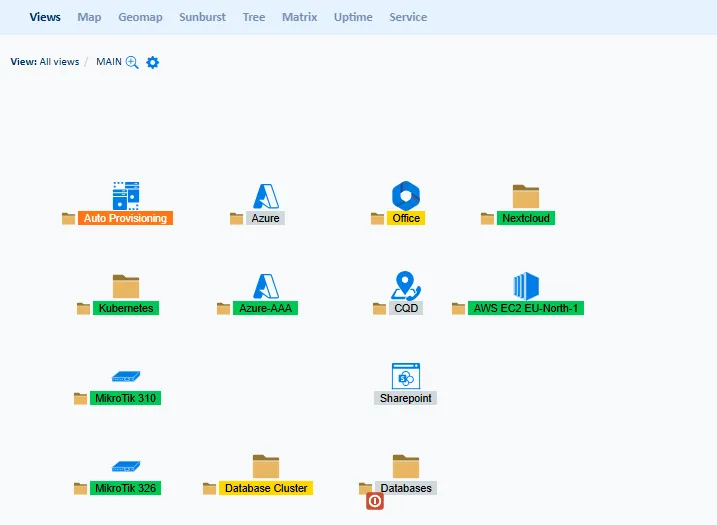 |
| Map | The Map sub-menu shows a tree indicating the position of different resource types based on the category of the resource selected. | 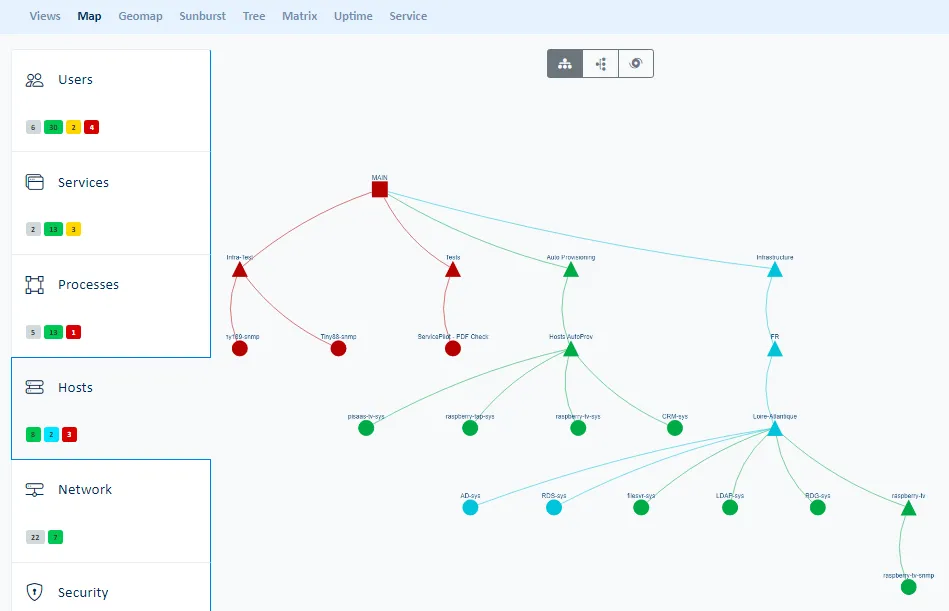 |
| Geomap | The Geomap sub-menu displays the different elements distributed on the map according to their geographic coordinates. | 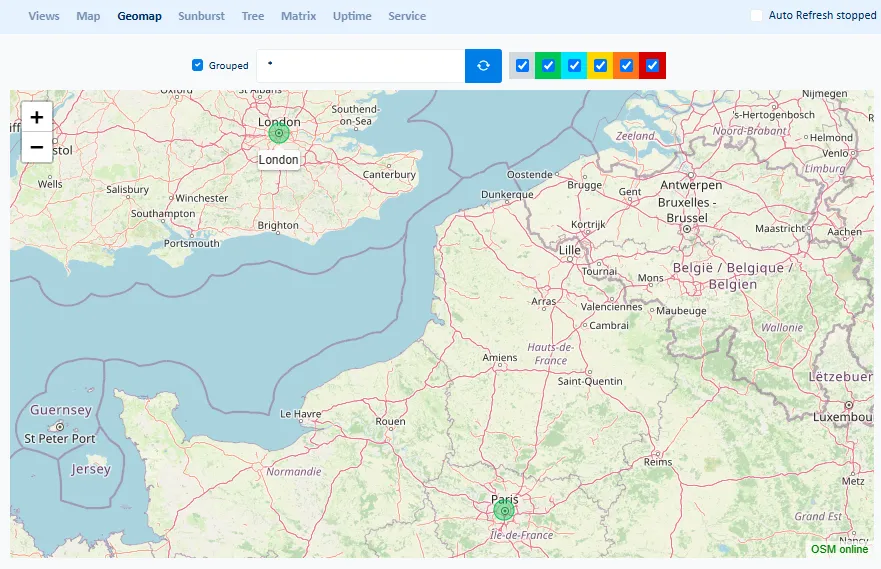 |
| Sunburst | The Sunburst sub-menu shows all of the view hierarchy starting from view level 1 at the core and fanning out to the highest view level on the edges. | 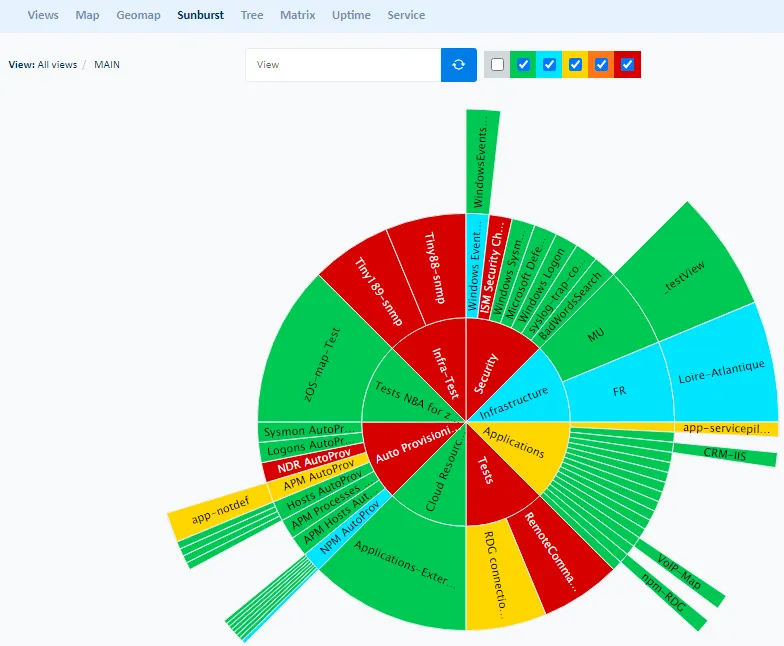 |
| Tree | The Tree sub-menu shows a tree of all the view hierarchy or only the parts that are critical or unavailable. | 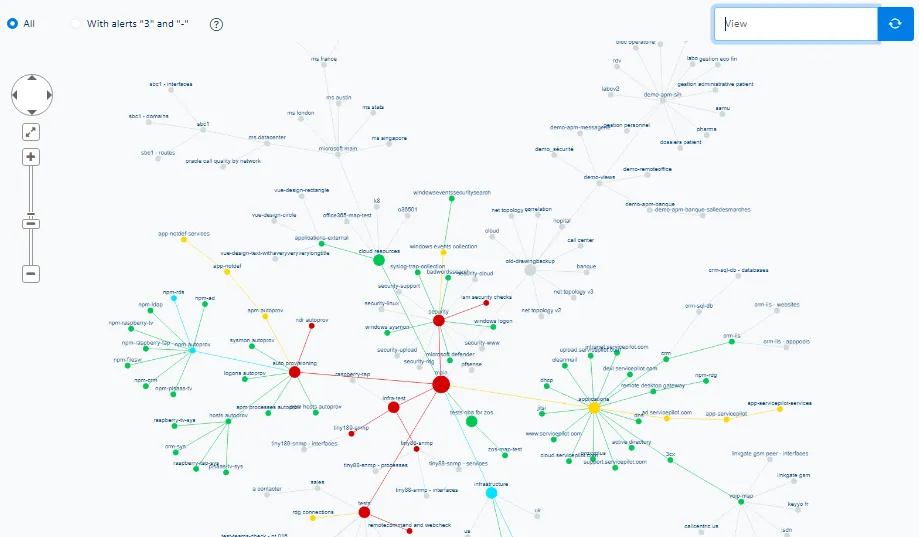 |
| Matrix | The Matrix sub-menu shows tables of hosts or resources set against views or the collection types the resources perform. | 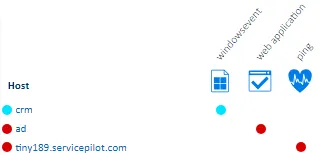 |
| Uptime | The Uptime sub-menu shows Availability & Performance of views and objects as a table over time. | 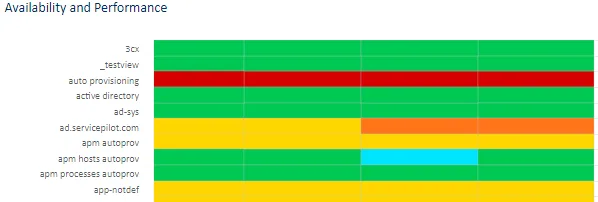 |
| Service | The Service sub-menu shows a table of Availability & Performance statistics and alarm counts for all views. | 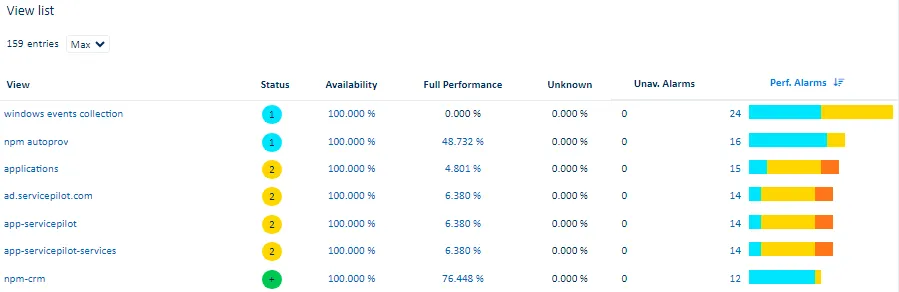 |
Status
| Menu item | Data display | |
|---|---|---|
| Problems | The Problems sub-menu displays problems and their status. | 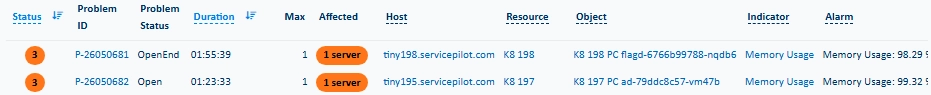 |
| Anomalies | The Anomalies sub-menu displays anomalies and their status. | 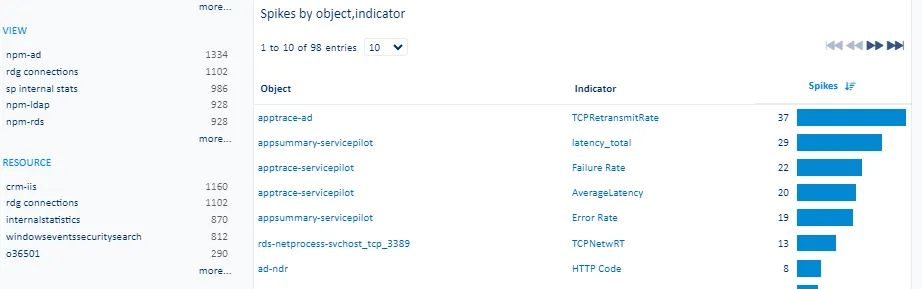 |
| Resources | The Resources sub-menu displays all resources and their status. | 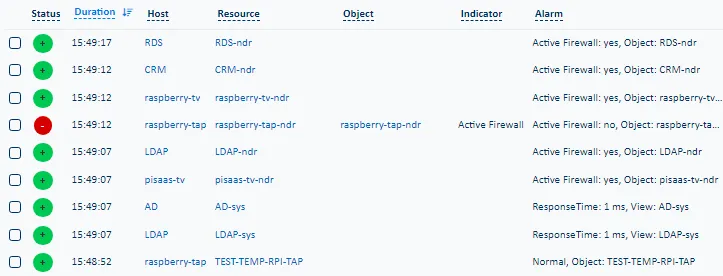 |
| Objects | The Objects sub-menu displays all the objects and their status. | 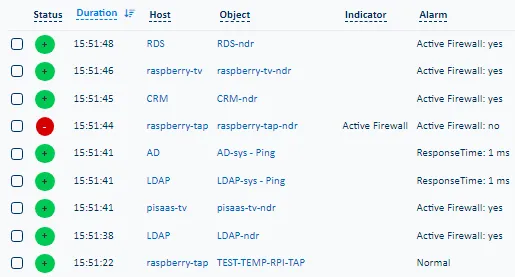 |
| Classes | The Classes sub-menu displays all the classes and their status. Class Actions provide access to Capacity and Trend statistics by class. | 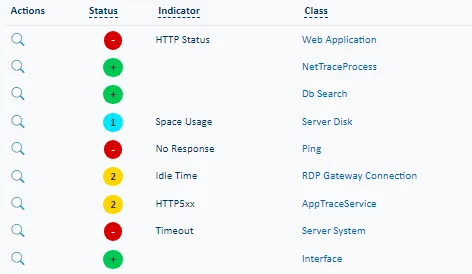 |
| Views | The Views sub-menu displays all the views in a table form with their status. | 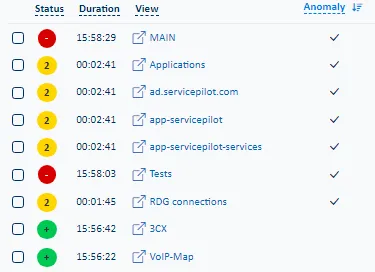 |
Events
| Menu item | Data display | |
|---|---|---|
| Details | The Details sub-menu displays all status changes within the defined time period. The event list can be filtered and queried to show only the elements selected. | 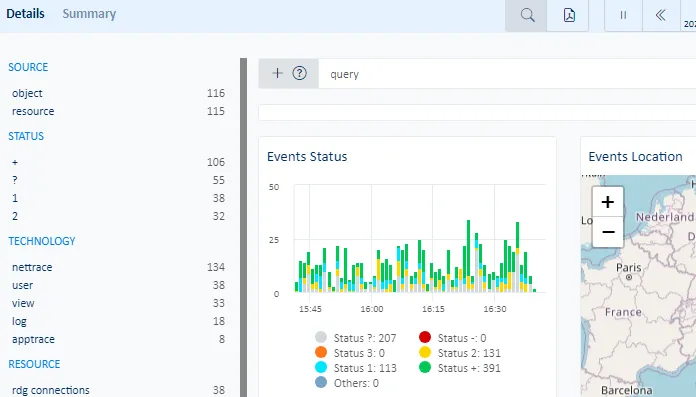 |
| Summary | The Summary sub-menu displays status change counts categorized by different grouping criteria. | 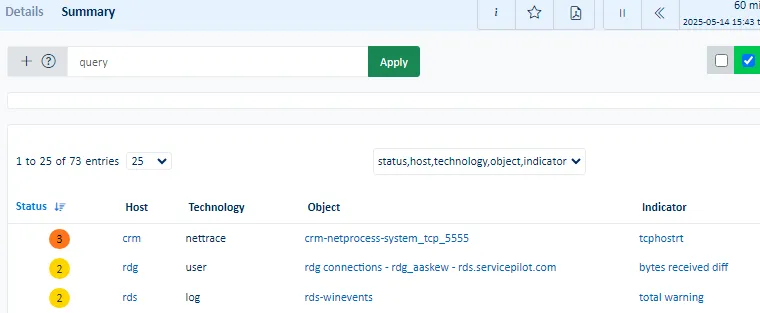 |
Hosts
| Data display | |
|---|---|
| The Hosts sub-menu displays all IP / Hostnames in a hexagonal map. The details provided when clicking on an individual host include host Availability and Performance, Network Performance, Inventory, Processes, Security events and Network tracing capabilities. | 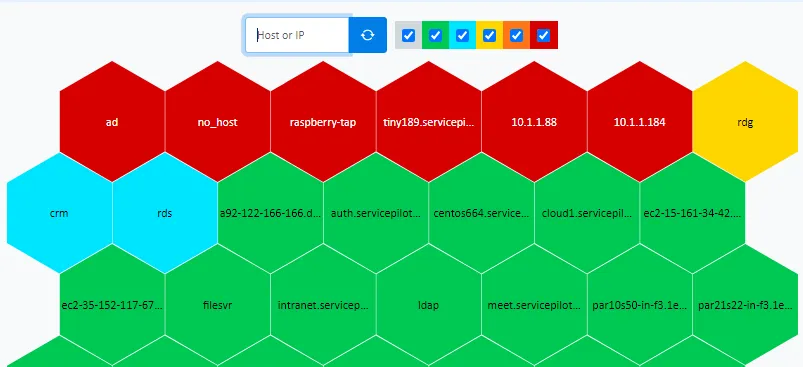 |
Dashboards
ServicePilot provides multiple dashboards that are composed of widgets, each of which querying the ServicePilot database and presenting data in a particular form.
Dashboards may be added to a list of favorites for quicker access.
Custom dashboards can be created, built from existing widgets or from completely new queries into the ServicePilot database.
See the Dashboards documentation for more details.
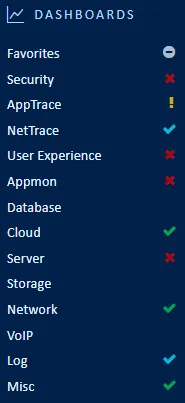
Note that not all dashboard categories will appear initially. Only those with provisioned resources of that category are shown.
| Menu item | Data display | |
|---|---|---|
| Favorites | The Favorites menu displays dashboards bookmarked by the user as well as custom and global dashboards shared across the organization. | 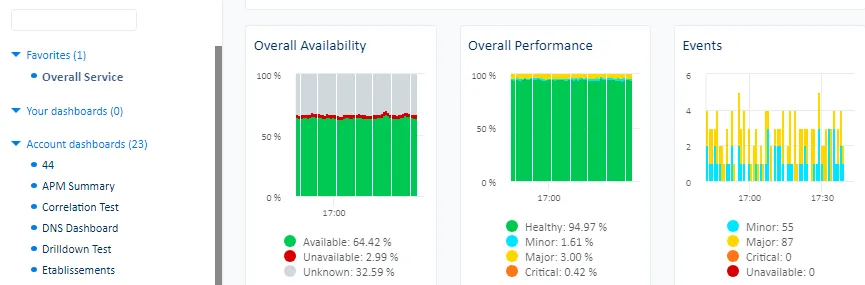 |
| Security | The Security menu displays dashboards for security resources such as firewalls, security appliances, gateways, NDR detected threats, Windows Sysmon events, etc. | 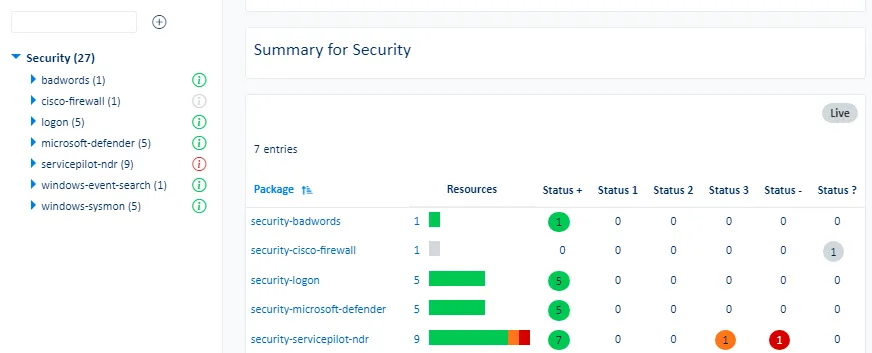 |
| AppTrace | The AppTrace menu displays dashboards for Application Tracing resources, web request traces, database queries collected via APM instrumentation as well as unified application dashboards. | 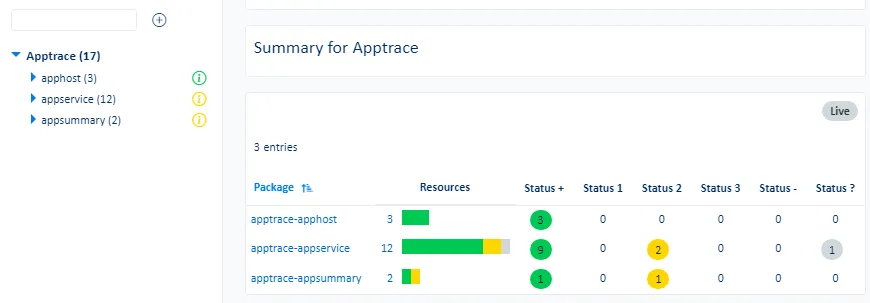 |
| NetTrace | The NetTrace menu displays dashboards for Network Tracing resources, server and application flows, PCAP captures and network device traffic with NetFlow, jFlow or Sflow. | 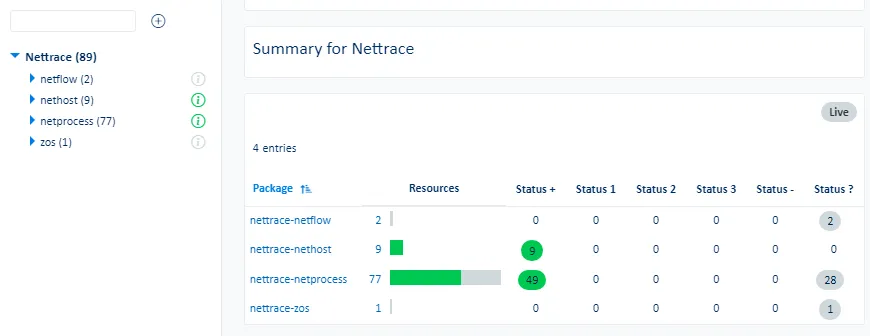 |
| User Experience | The User Experience menu displays dashboards for user resources such as synthetic WebChecks, Web application Real User Monitoring (RUM) and Session Replay data, Remote Desktop Gateway users, Endpoint statistics, etc. | 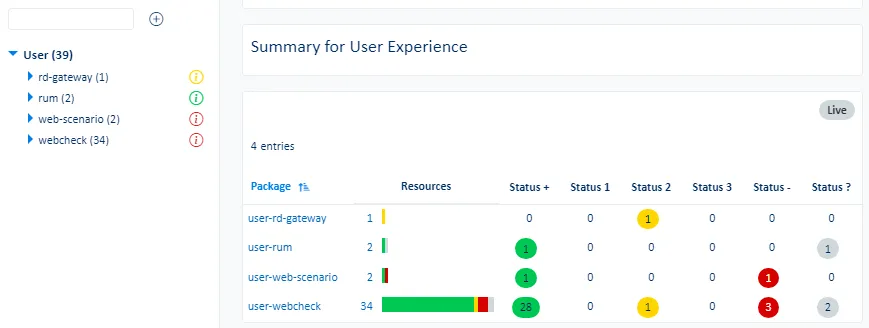 |
| Appmon | The Appmon menu displays dashboards for various software applications resources. | 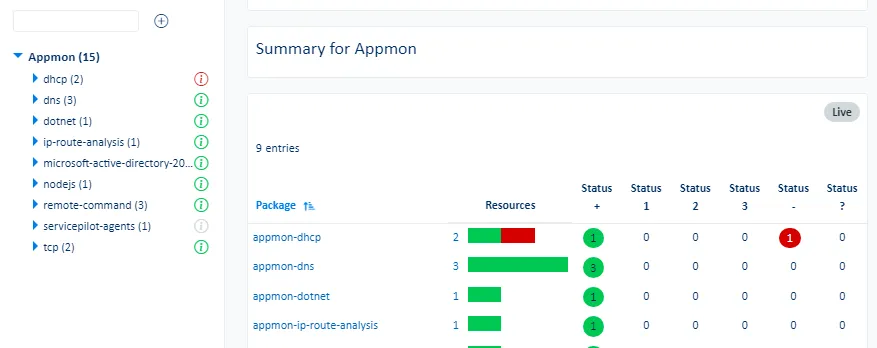 |
| Database | The Database menu displays dashboards for database resources across various supported DB technologies. | 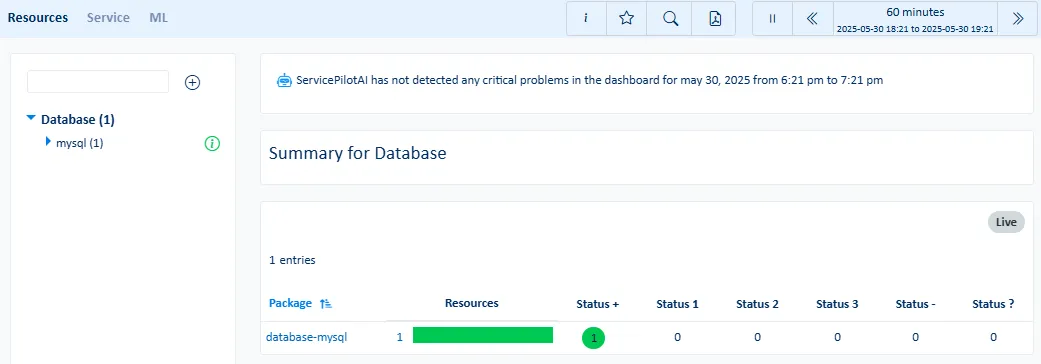 |
| Cloud | The Cloud menu displays dashboards for Cloud resources, infrastructure and services such as AWS, Azure and GCP. | 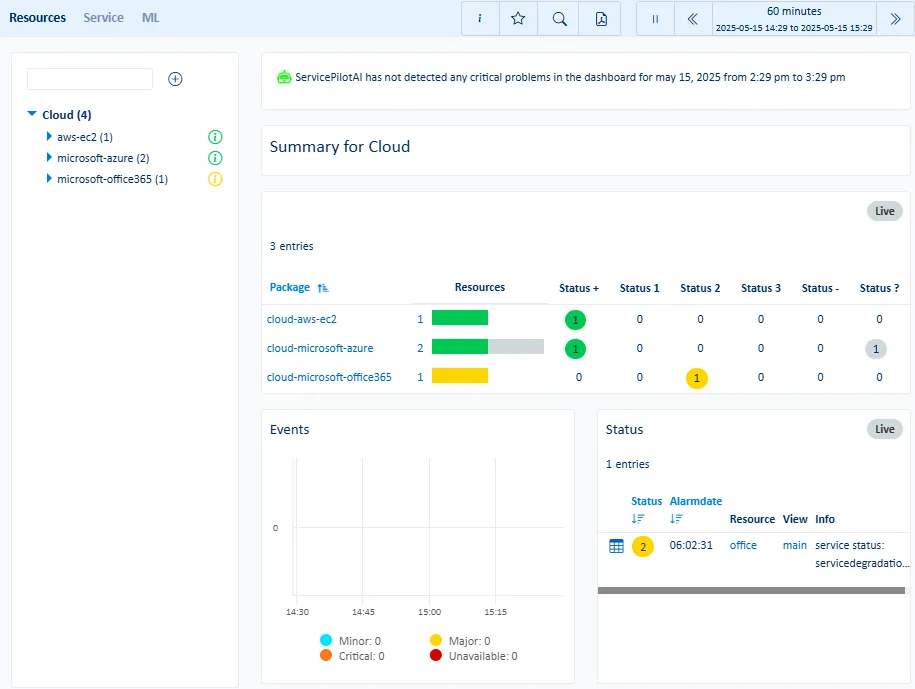 |
| Server | The Server menu displays dashboards for server resources, hypervisors, virtual machines, containers, operating systems, processes, Agent health and asset inventory. | 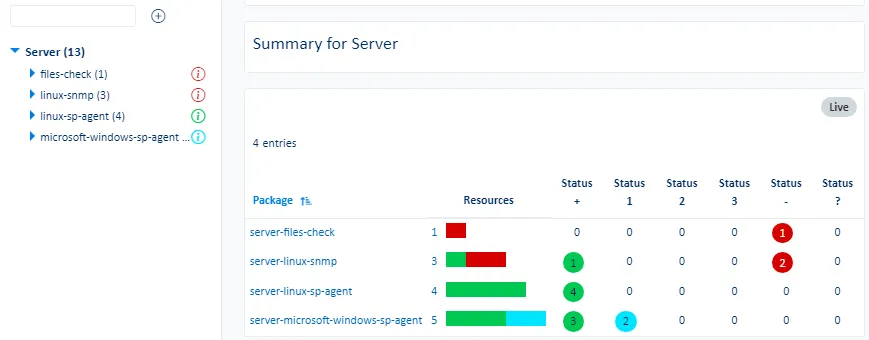 |
| Storage | The Storage menu displays dashboards for storage resources, systems and devices (SAN, NAS, etc.). | 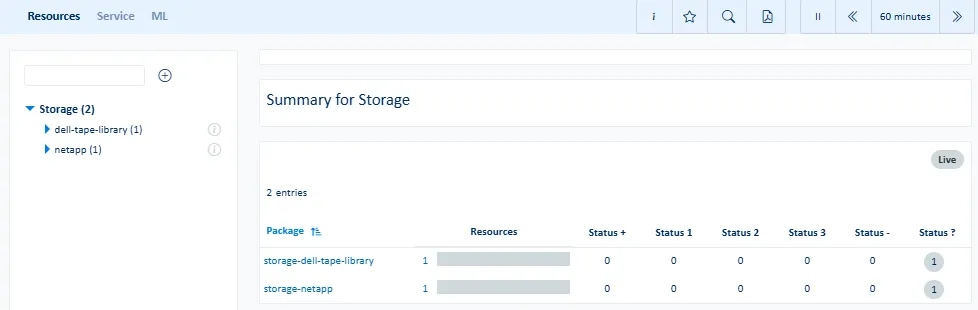 |
| Network | The Network menu displays dashboards for network resources, physical and virtual devices, interfaces, WAN appliances, wireless controllers, network discovery and more. | 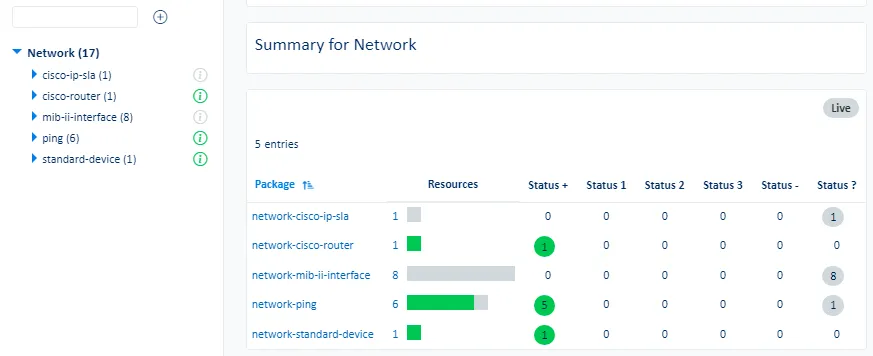 |
| VoIP | The VoIP menu displays dashboards for VoIP resources, UC systems, call quality by zone (MOS), jitter, latency, trunks and SIP/RTP stats. | 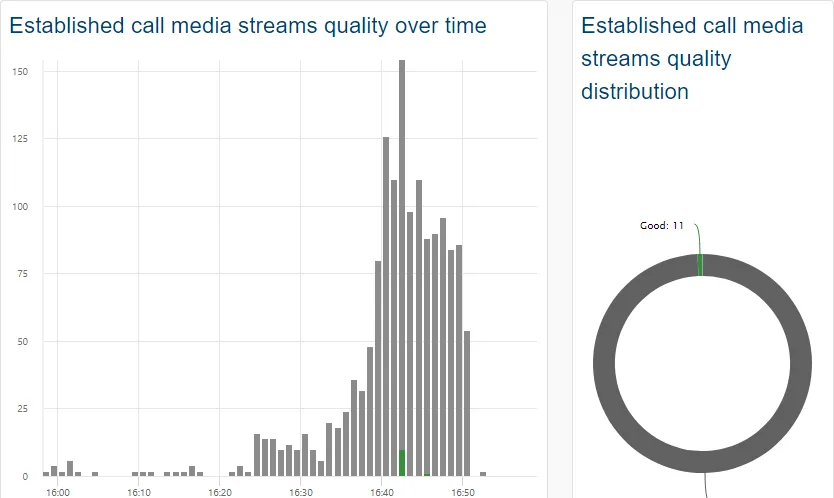 |
| Log | The Log menu displays dashboards for log resources and data, including Syslog, SNMP Traps, files or Windows Events. | 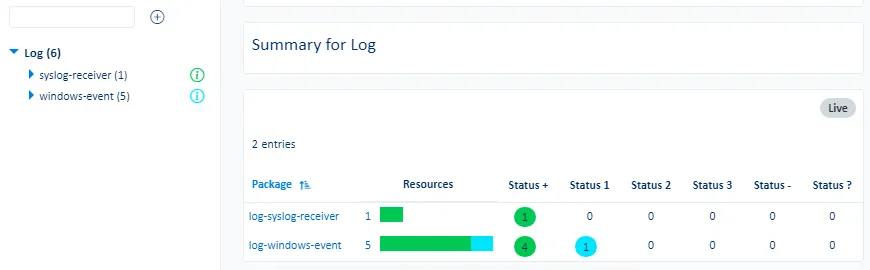 |
| Misc | The Misc menu displays dashboards for miscellaneous resources such as UPS, PDU, sensors or resources that do not fall into other predefined categories. | 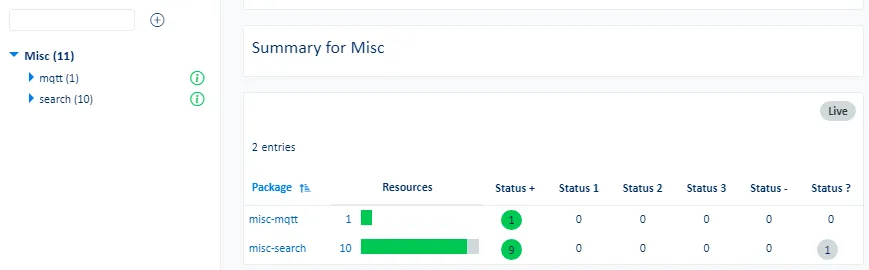 |
Dashboards menu
Favorites
| Menu item | Data display | |
|---|---|---|
| Portal | The Portal sub-menu displays a global view of all the dashboards: Favorites, Your dashboards, Account dashboards, Global dashboards. | 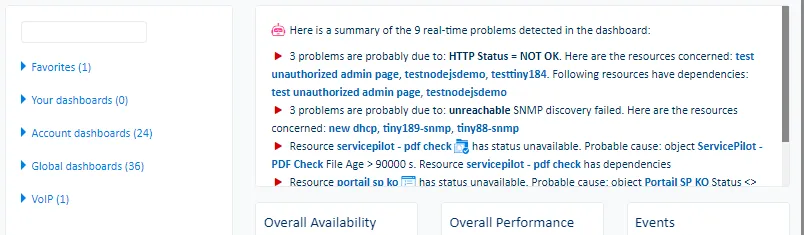 |
| Service | The Service sub-menu displays a global view of performance, availability and alerts. Further tabs also present real-time service states grouped by class, technology, infrastructure and application type. Top events and event duration by class, object, package and resource are show in the Top Events tab. The SLA tab shows service level objectives (SLOs) and if views and resources with SLA profiles set meet the objectives. | 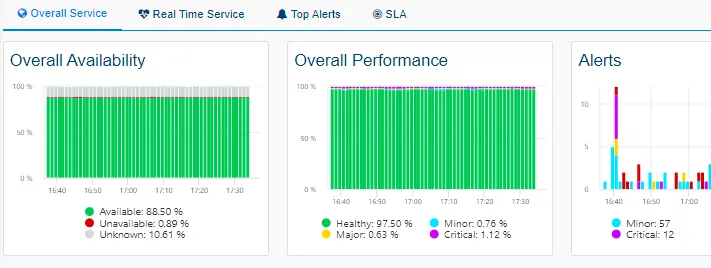 |
| Anomalies | The Anomalies sub-menu displays abnormal peaks, predictions of when indicators pass critical thresholds and trends for all indicators. | |
| Packages | The Packages sub-menu displays a count of resource states by package type. | 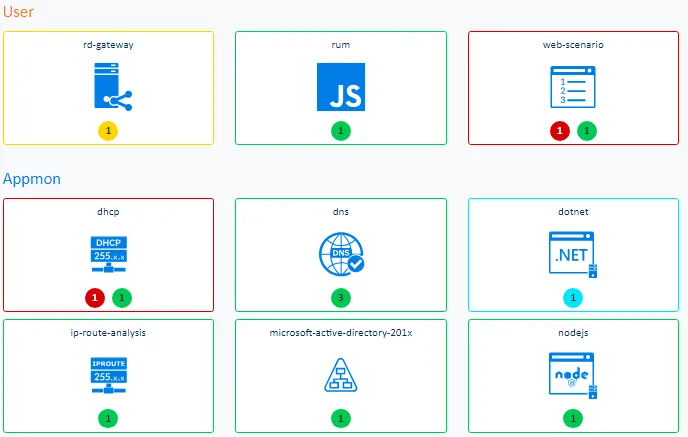 |
| Top Objects | The Top Objects sub-menu ranks all of the same type of indicator’s average, minimum, maximum, first value, last value, 90th percentile and 95th percentile by object. | 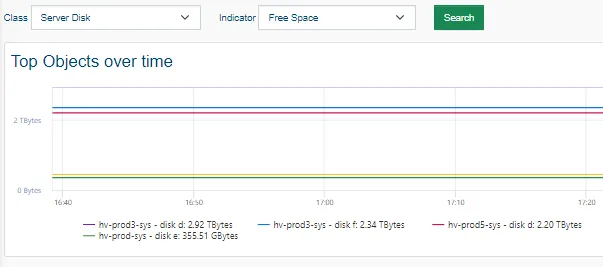 |
| Uptime | The Uptime sub-menu displays the worst availability and performance of objects by class over time with access the details per object. | 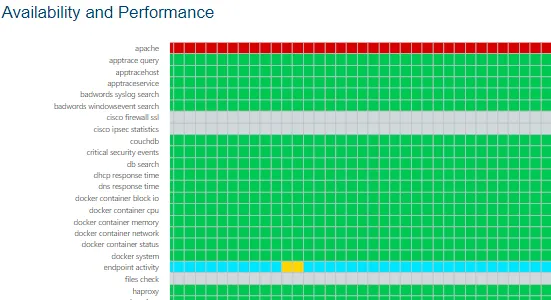 |
| TV | The TV sub-menu displays a dashboard example without any menu for a TV display. | 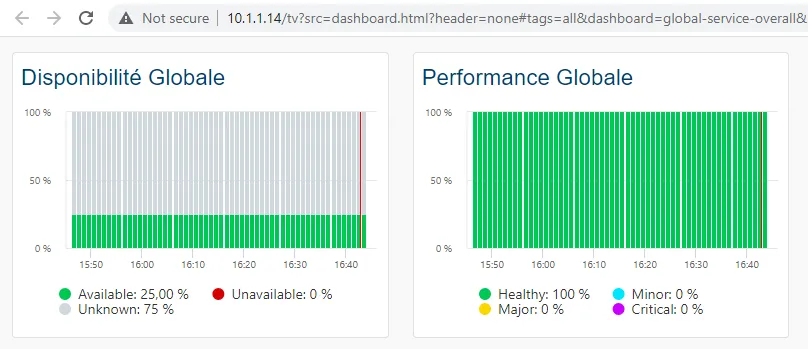 |
Security
| Menu item | Data display | |
|---|---|---|
| Metrics | The Metrics sub-menu displays the main indicators for Security package and resource. | 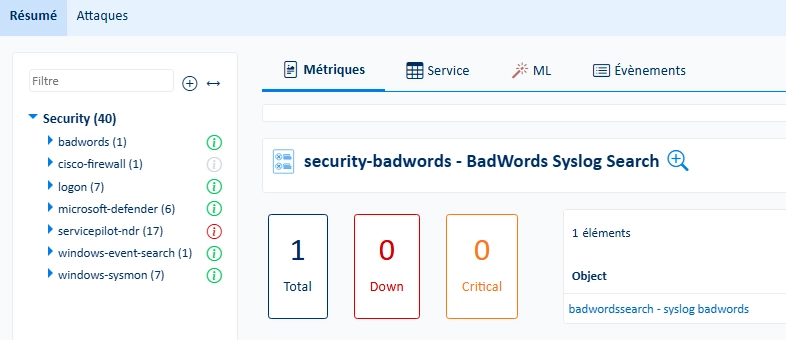 |
| Service | The Service sub-menu displays availability, performance, reliability and maintainability of classes or objects for Security packages and resources. | 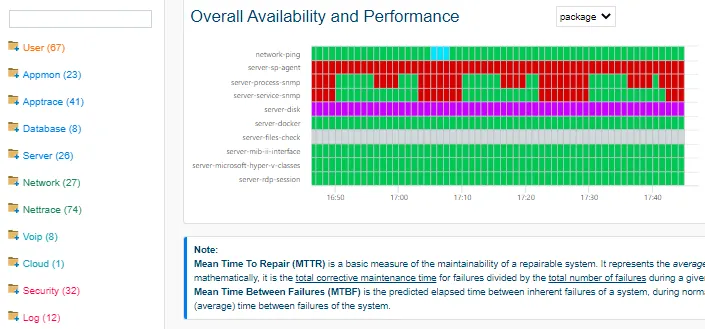 |
| ML | The ML sub-menu displays the largest indicator anomalies, critical indicator predictions and trends for Security packages and resources. | 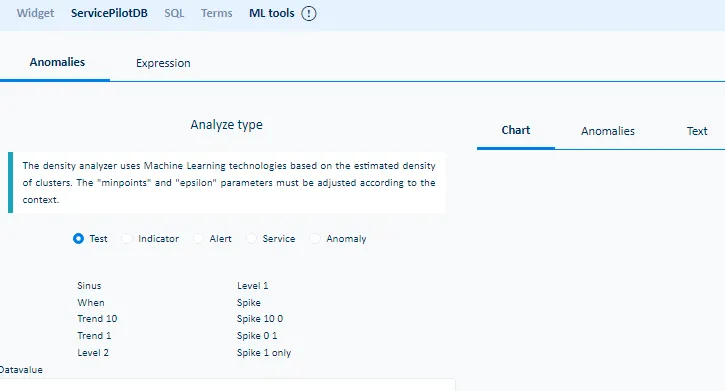 |
| Events | The Events sub-menu displays the ServicePilot events for Security package and resource. | 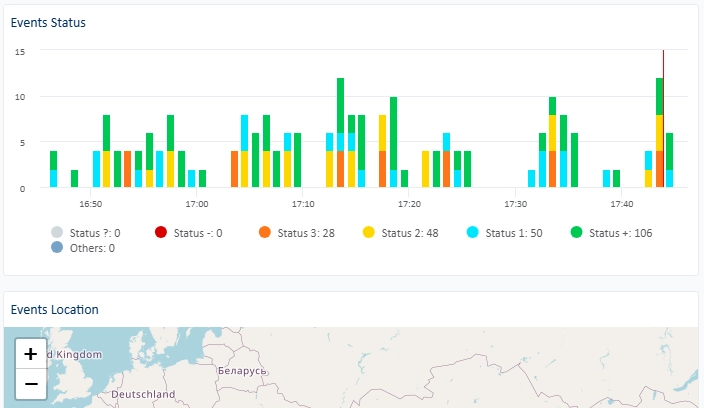 |
| Attacks | The Attacks sub-menu displays detected network and web application attacks. | 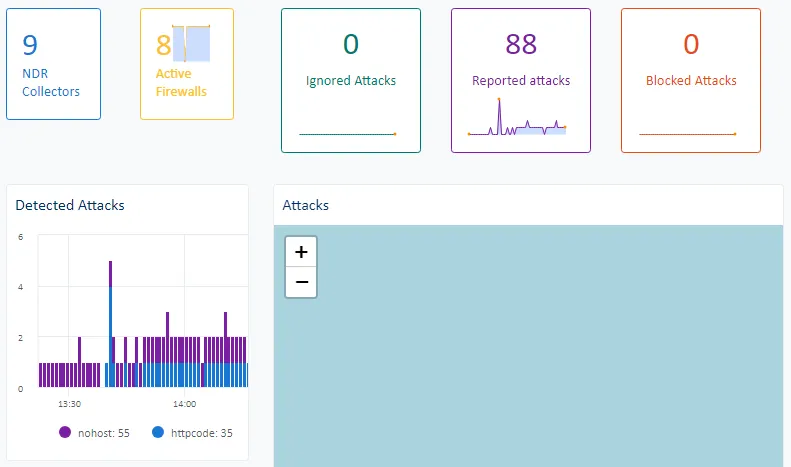 |
AppTrace
| Menu item | Data display | |
|---|---|---|
| Metrics | The Metrics sub-menu displays the main indicators for Appmon package and resource. | 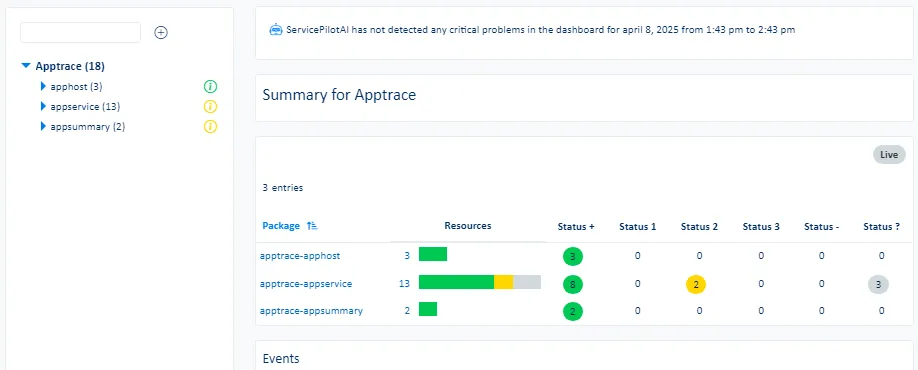 |
| Service | The Service sub-menu displays availability, performance, reliability and maintainability of classes or objects for AppTrace packages and resources. | 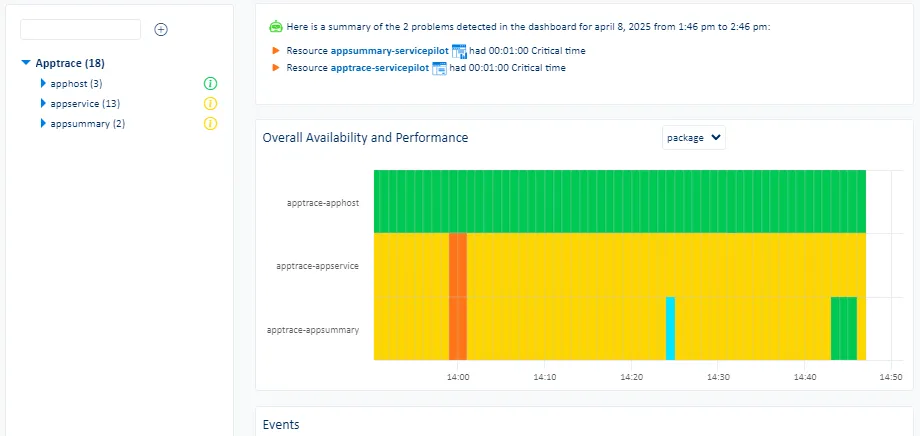 |
| ML | The ML sub-menu displays the largest indicator anomalies, critical indicator predictions and trends for AppTrace packages and resources. | |
| Events | The Events sub-menu displays the ServicePilot events for AppTrace package and resource. | |
| Applications | The Applications sub-menu displays web application, service and host health. | 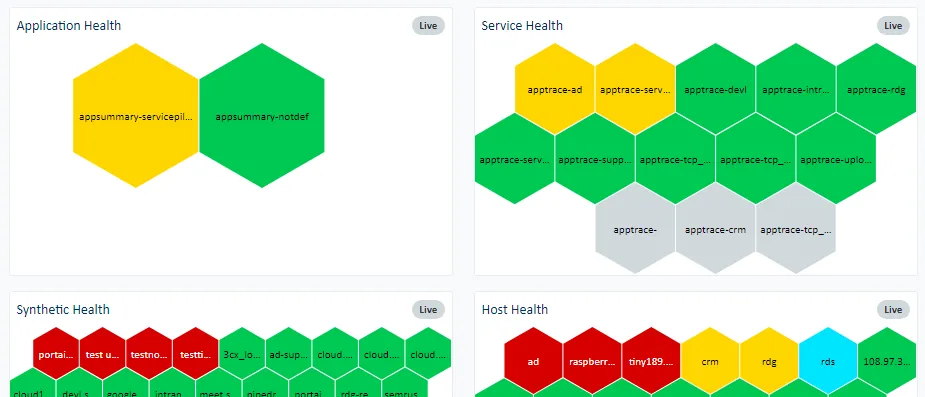 |
| Requests | The Requests sub-menu displays web request details for APM instrumented web applications. | 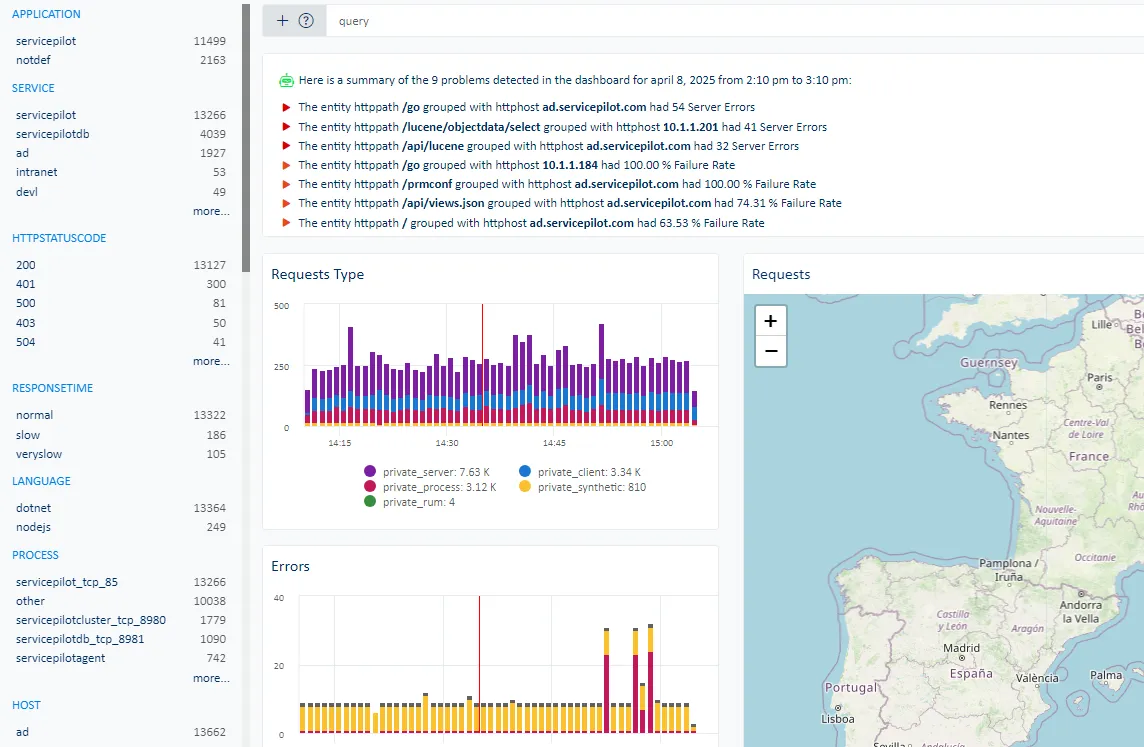 |
| L7 Map | The L7 Map sub-menu displays links between hosts, processes, services and subnets based on collected APM data. | 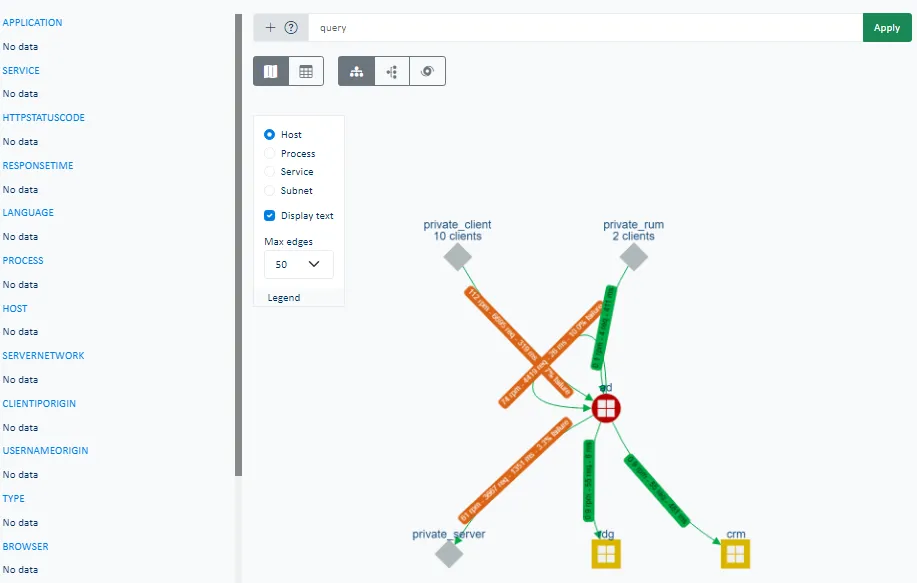 |
| Profiler | The Profiler sub-menu shows results of processes that have been instrumented with profiling enabled. | 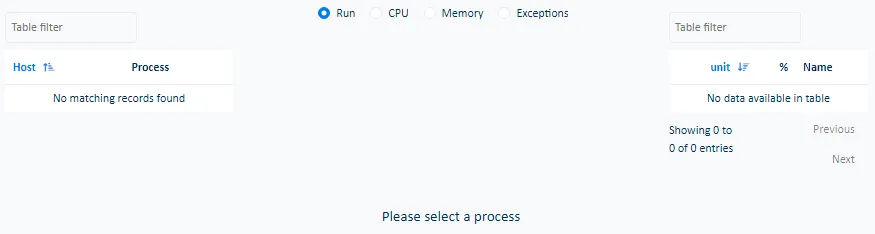 |
NetTrace
| Menu item | Data display | |
|---|---|---|
| Metrics | The Metrics sub-menu displays the main indicators for NetTrace package and resource. | 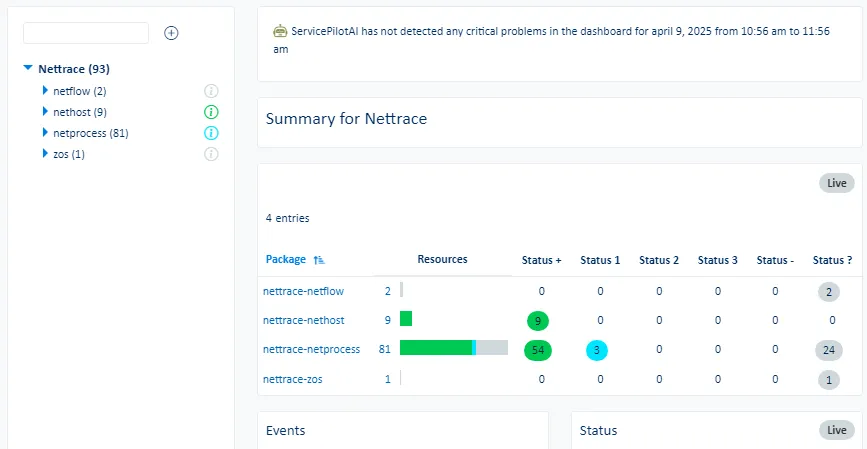 |
| Service | The Service sub-menu displays availability, performance, reliability and maintainability of classes or objects for NetTrace packages and resources. | 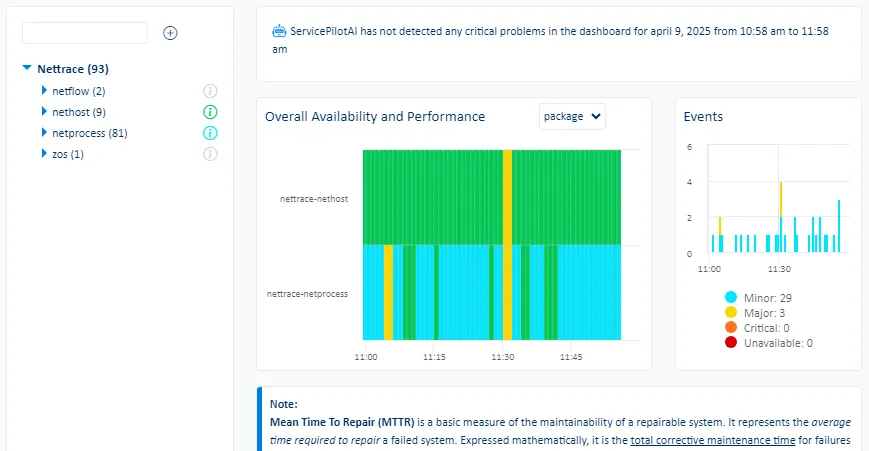 |
| ML | The ML sub-menu displays the largest indicator anomalies, critical indicator predictions and trends for NetTrace packages and resources. | |
| Events | The Events sub-menu displays the ServicePilot events for NetTrace package and resource. | |
| Conversations | The Conversations sub-menu displays UDP and TCP network flows captured on servers by the ServicePilot Agent as well as NetTrace instrumented switches and routers. | 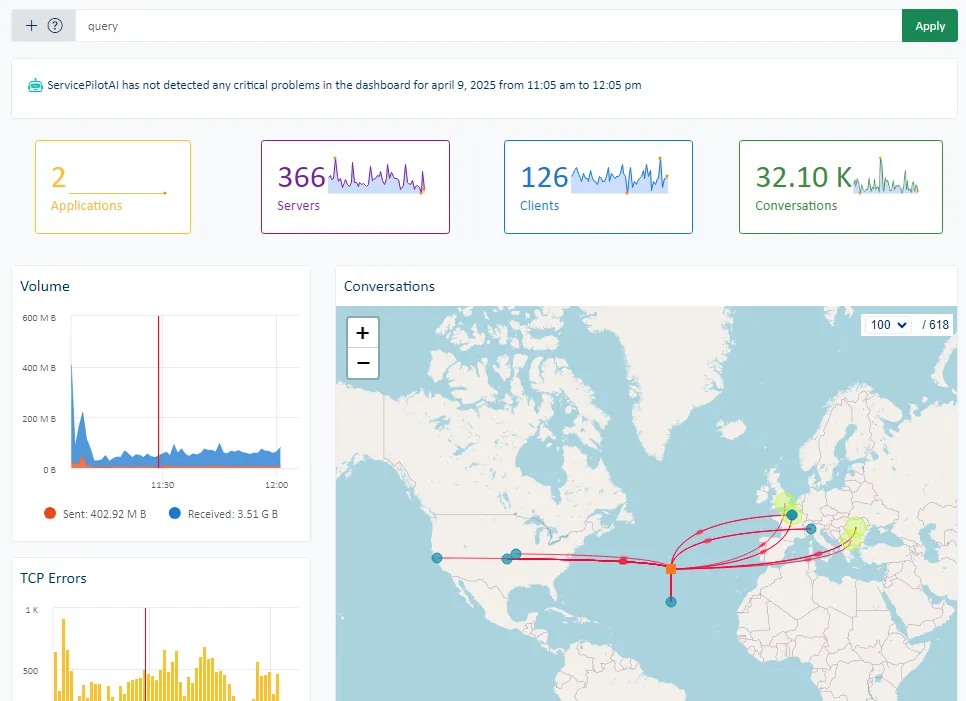 |
| L4 Map | The L4 Map sub-menu displays links between hosts, processes, services and subnets based on collected NPM data. | 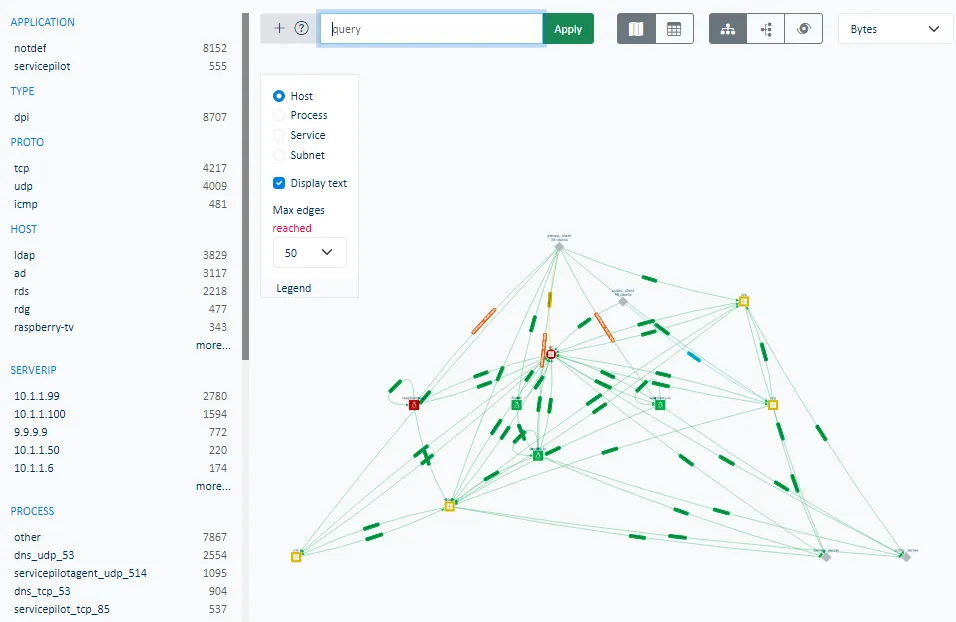 |
| Public | The Public sub-menu displays statistics for the largest network flows using public IP addresses. | 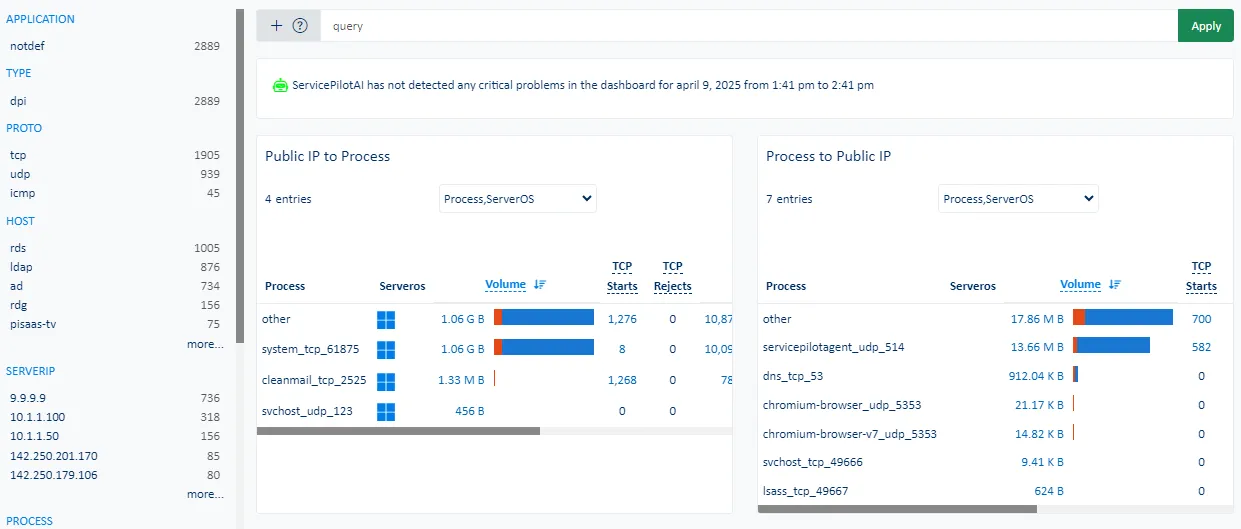 |
| PCAP | The PCAP sub-menu allows for the capture and download of network traffic in PCAP files from hosts on which ServicePilot Agents have been installed. | 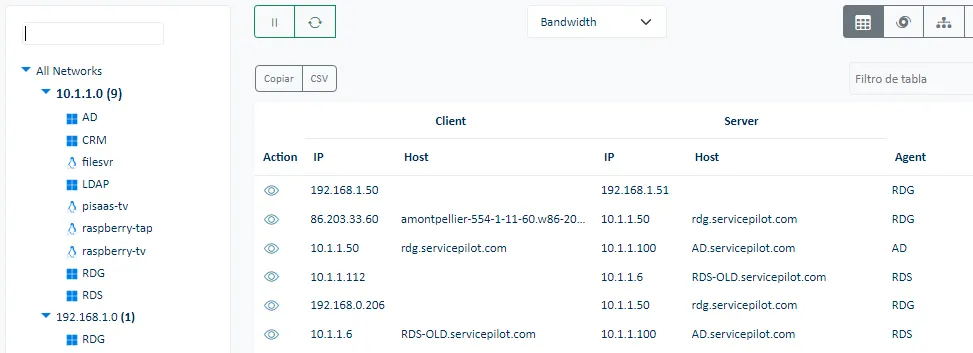 |
User Experience
| Menu item | Data display | |
|---|---|---|
| Metrics | The Metrics sub-menu displays the main indicators for User package and resource. | 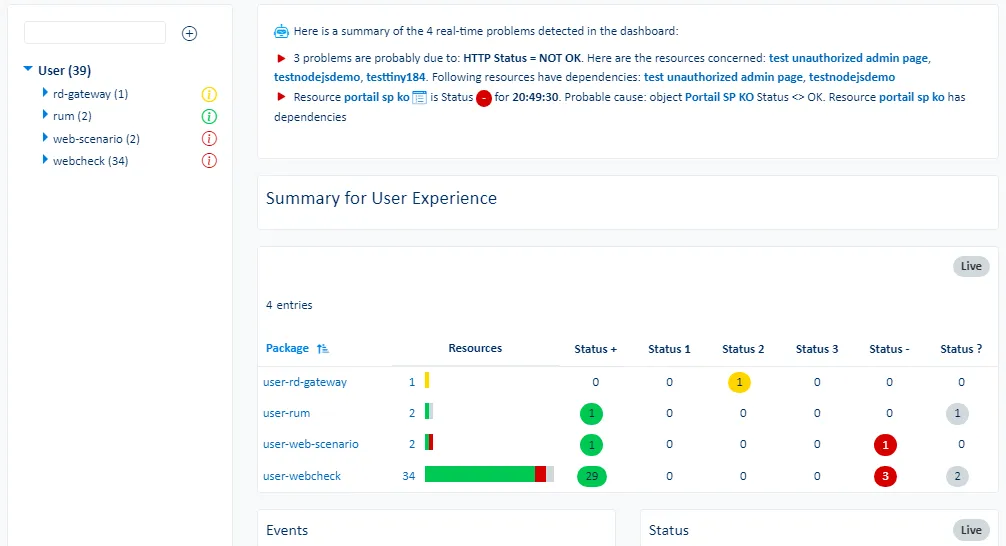 |
| Service | The Service sub-menu displays availability, performance, reliability and maintainability of classes or objects for User packages and resources. | 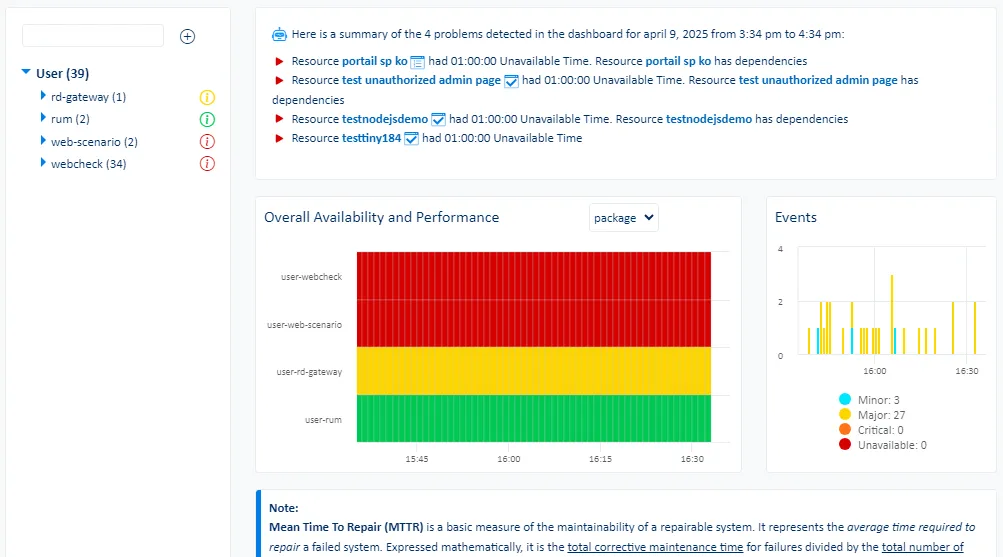 |
| ML | The ML sub-menu displays the largest indicator anomalies, critical indicator predictions and trends for User packages and resources. | |
| Events | The Events sub-menu displays the ServicePilot events for User package and resource. | |
| RUM | The RUM sub-menu displays web application request details for applications that are instrumented with ServicePilot RUM. | 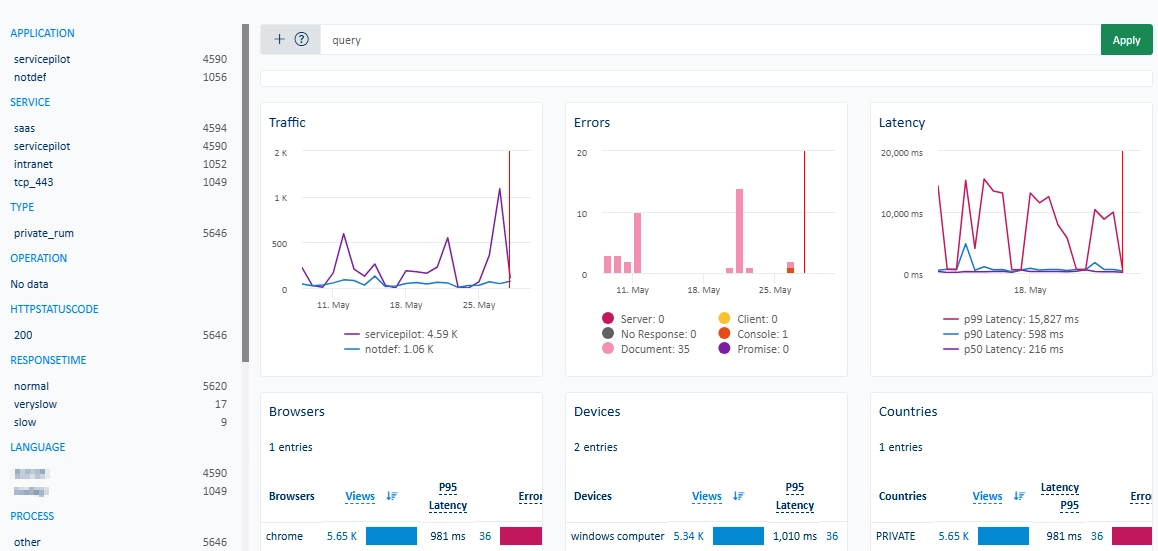 |
| Synthetic | The Synthetic sub-menu displays ServicePilot synthetic web requests. | 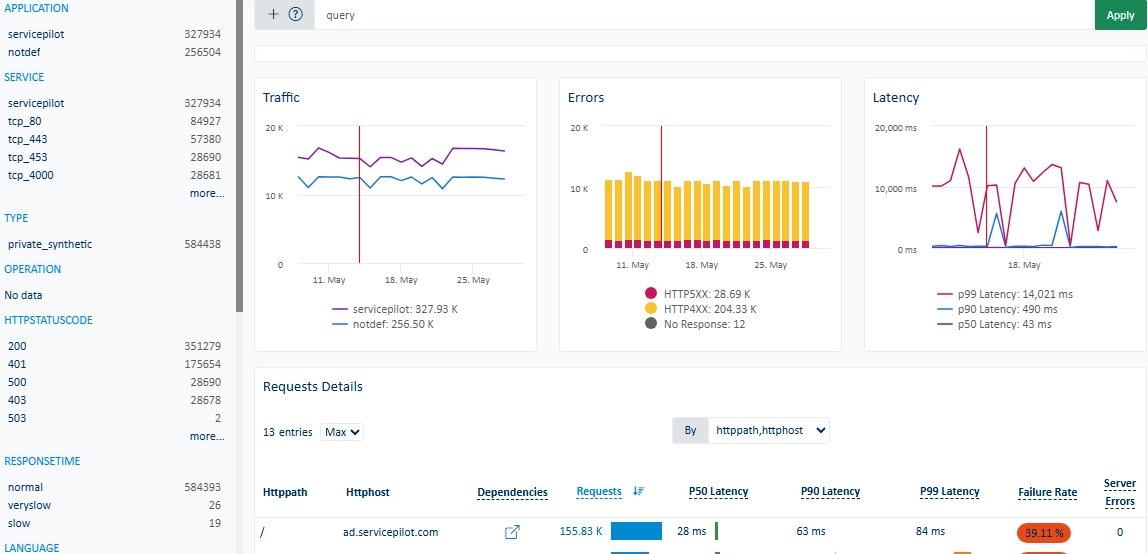 |
Appmon
| Menu item | Data display | |
|---|---|---|
| Metrics | The Metrics sub-menu displays the main indicators for Appmon package and resource. | 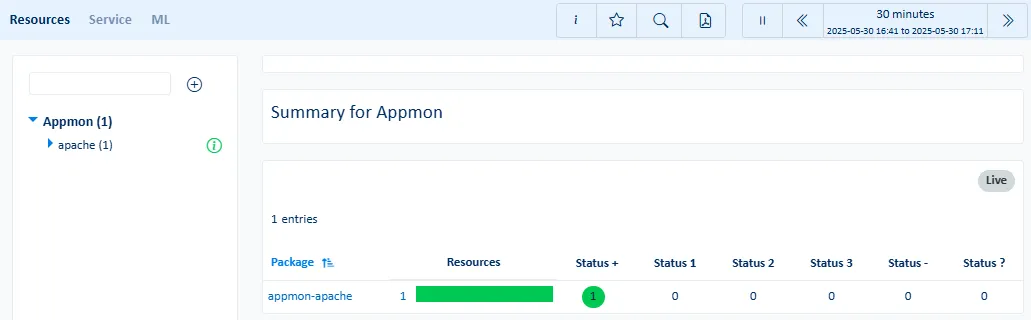 |
| Service | The Service sub-menu displays availability, performance, reliability and maintainability of classes or objects for Appmon packages and resources. | 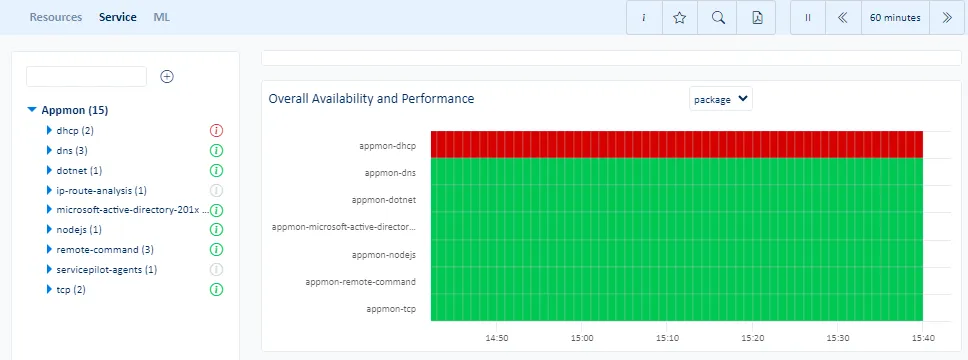 |
| ML | The ML sub-menu displays the largest indicator anomalies, critical indicator predictions and trends for Appmon packages and resources. | 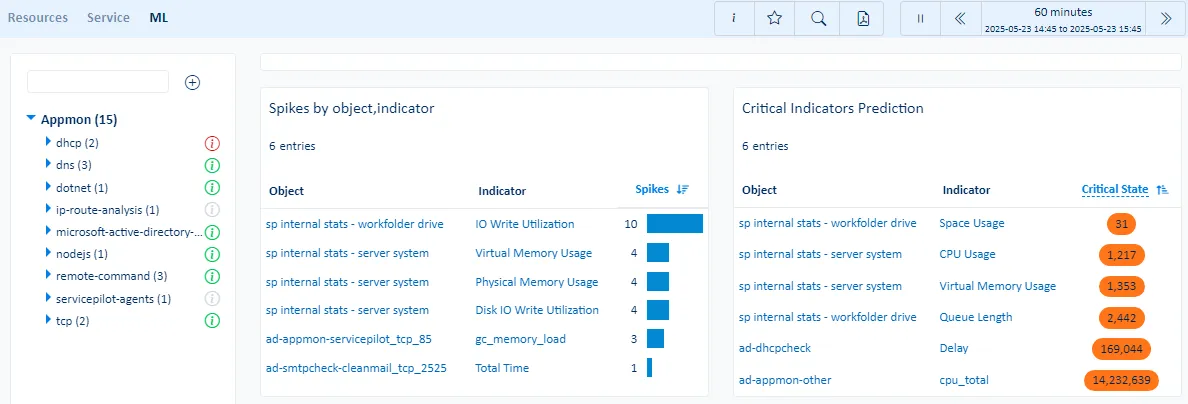 |
| Events | The Events sub-menu displays the ServicePilot events for Appmon package and resource. | |
Database
| Menu item | Data display | |
|---|---|---|
| Metrics | The Metrics sub-menu displays the main indicators for Database package and resource. | |
| Service | The Service sub-menu displays availability, performance, reliability and maintainability of classes or objects for Database packages and resources. | 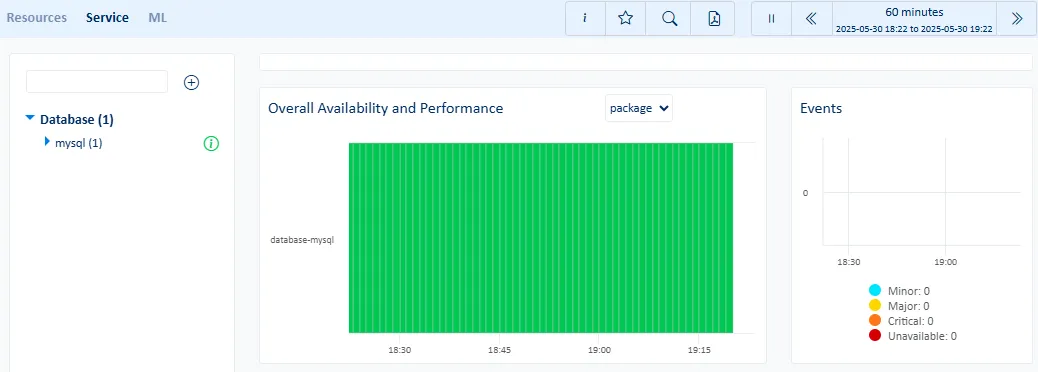 |
| ML | The ML sub-menu displays the largest indicator anomalies, critical indicator predictions and trends for Database packages and resources. | 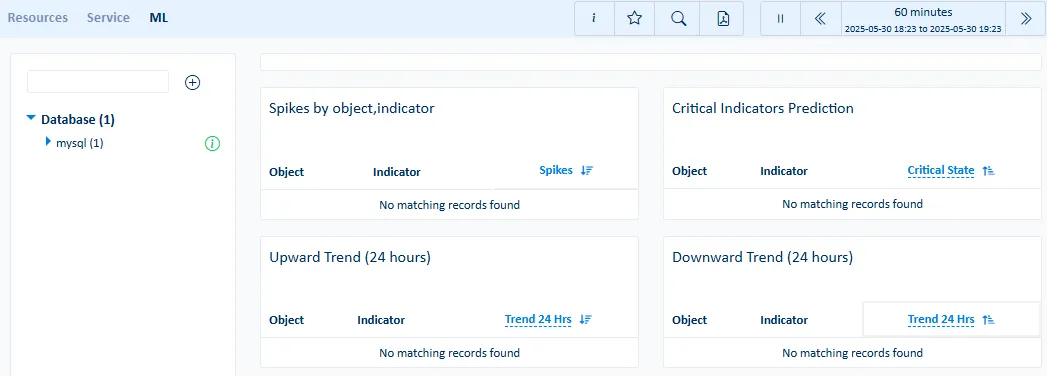 |
| Events | The Events sub-menu displays the ServicePilot events for Database package and resource. | |
Cloud
| Menu item | Data display | |
|---|---|---|
| Metrics | The Metrics sub-menu displays the main indicators for Cloud package and resource. | 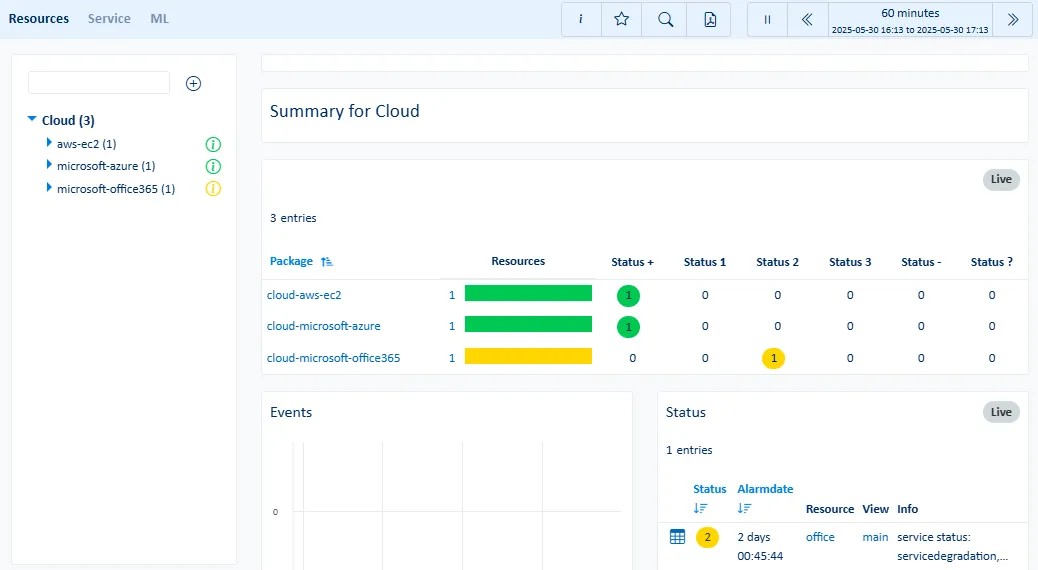 |
| Service | The Service sub-menu displays availability, performance, reliability and maintainability of classes or objects for Cloud packages and resources. | 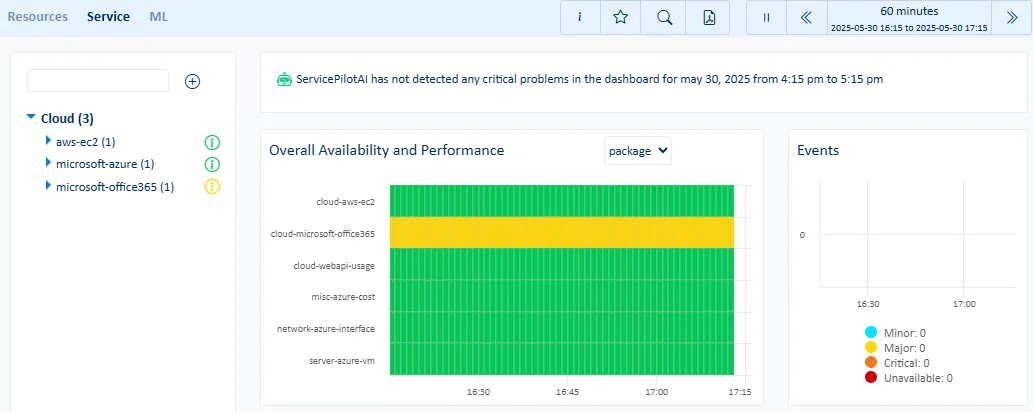 |
| ML | The ML sub-menu displays the largest indicator anomalies, critical indicator predictions and trends for Cloud packages and resources. | 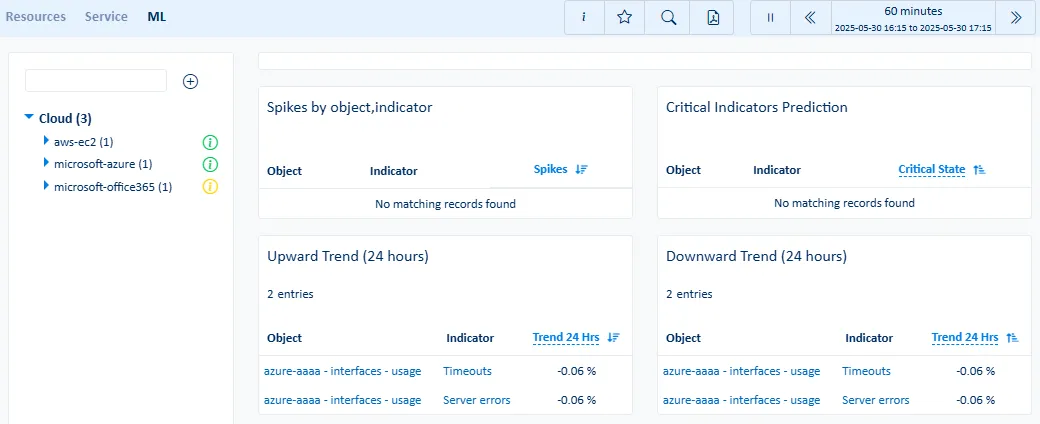 |
| Events | The Events sub-menu displays the ServicePilot events for Cloud package and resource. | |
Server
| Menu item | Data display | |
|---|---|---|
| Metrics | The Metrics sub-menu displays the main indicators for Server package and resource. | 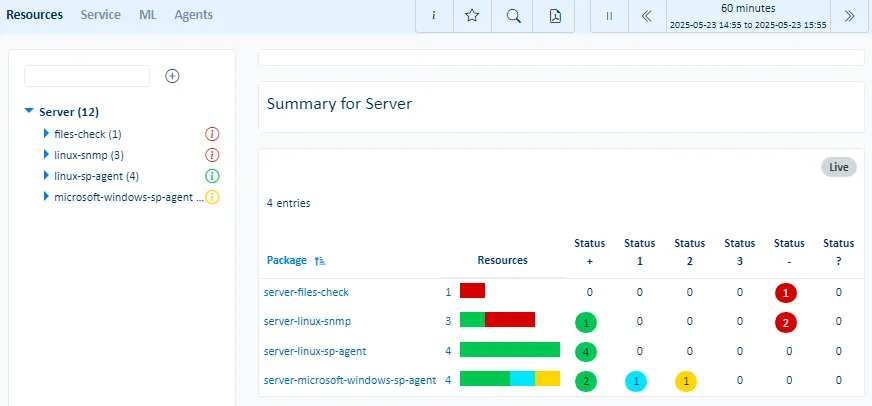 |
| Service | The Service sub-menu displays availability, performance, reliability and maintainability of classes or objects for Server packages and resources. | 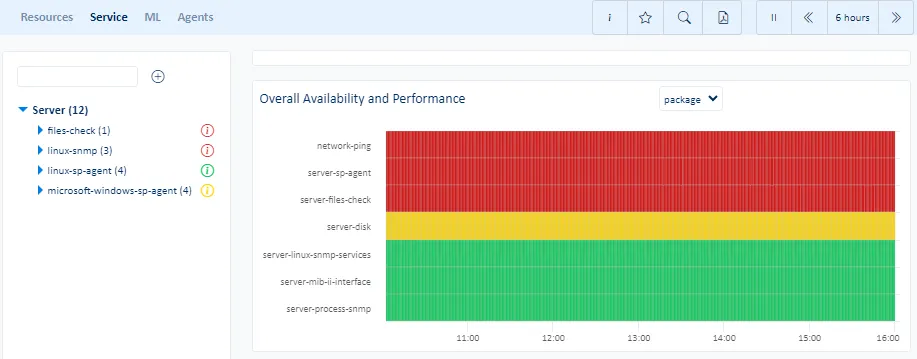 |
| ML | The ML sub-menu displays the largest indicator anomalies, critical indicator predictions and trends for Server packages and resources. | 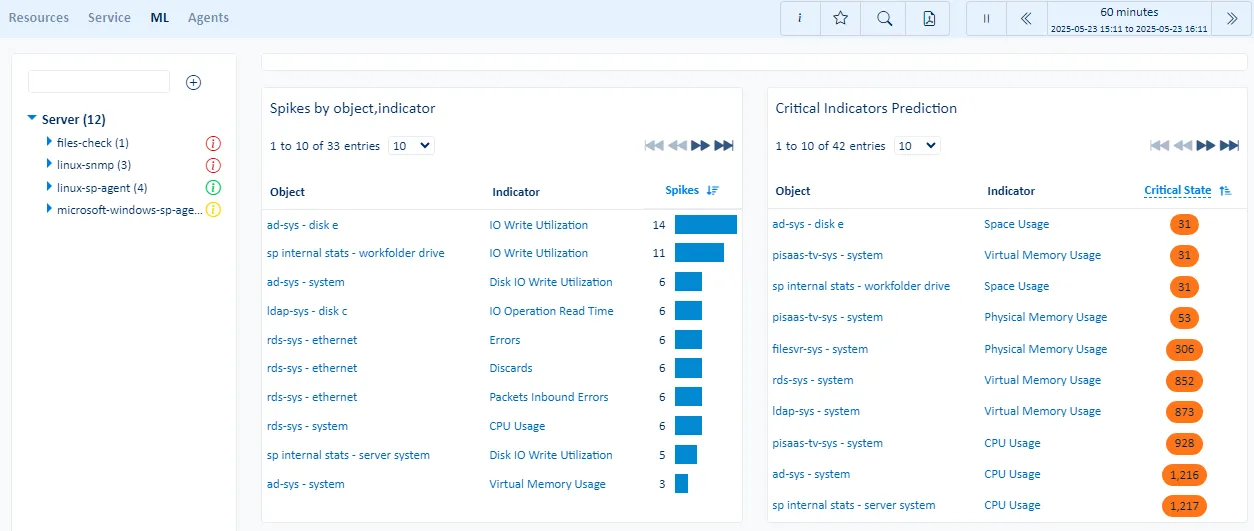 |
| Events | The Events sub-menu displays the ServicePilot events for Server package and resource. | |
| Hosts | The Hosts sub-menu displays per host metrics for monitored hosts. | 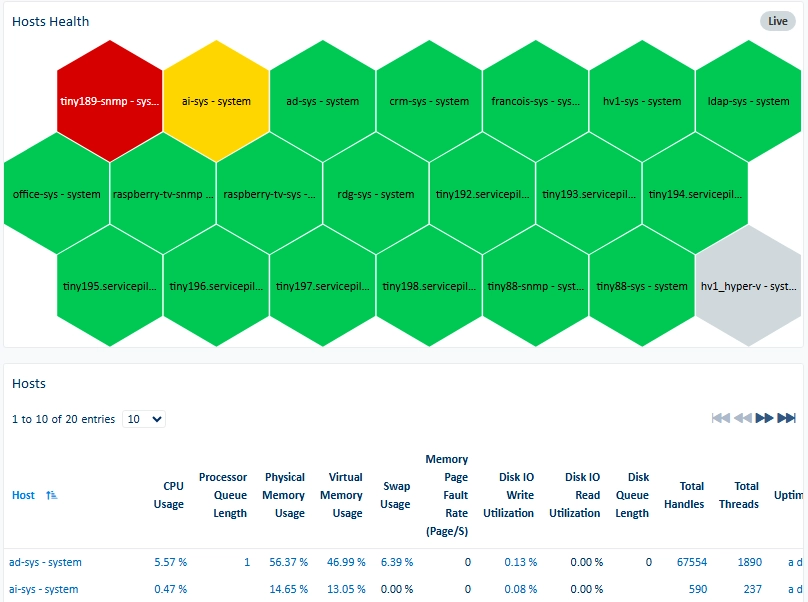 |
| Kubernetes | The Kubernetes sub-menu displays metrics based on reported indicators from Kubernetes environments. | 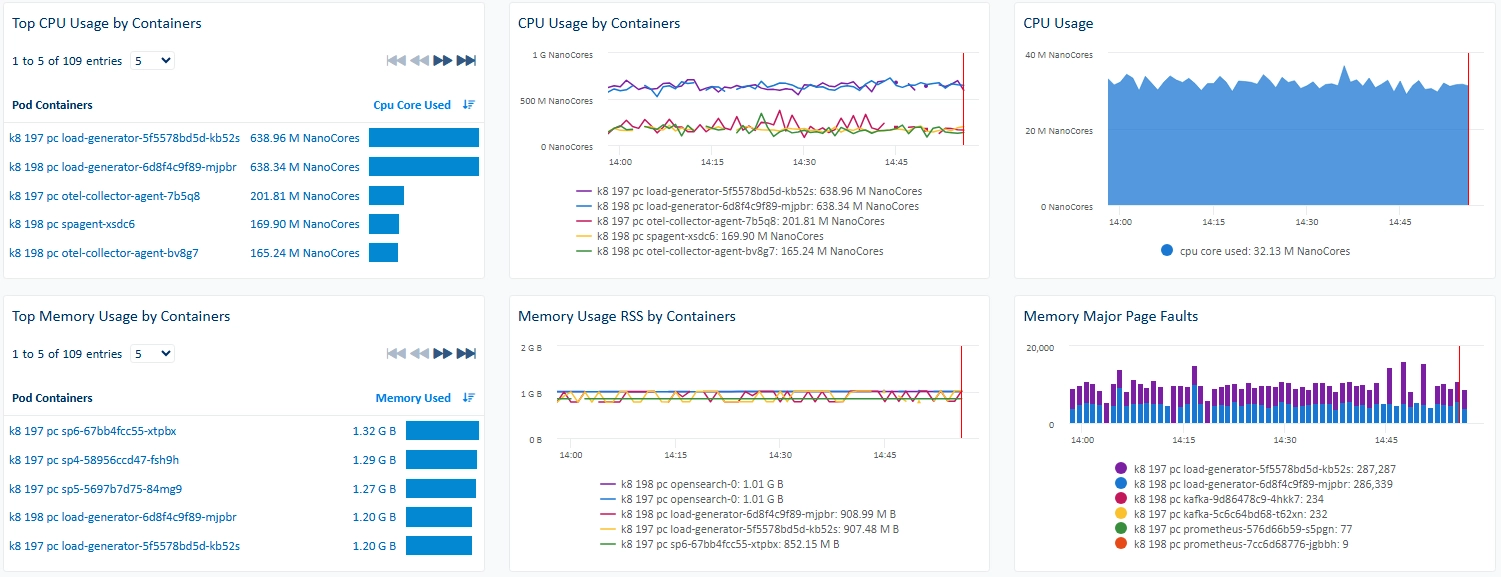 |
Storage
| Menu item | Data display | |
|---|---|---|
| Metrics | The Metrics sub-menu displays the main indicators for Storage package and resource. | |
| Service | The Service sub-menu displays availability, performance, reliability and maintainability of classes or objects for Storage packages and resources. | |
| ML | The ML sub-menu displays the largest indicator anomalies, critical indicator predictions and trends for Storage packages and resources. | |
| Events | The Events sub-menu displays the ServicePilot events for Storage package and resource. | |
Network
| Menu item | Data display | |
|---|---|---|
| Metrics | The Metrics sub-menu displays the main indicators for Network package and resource. | 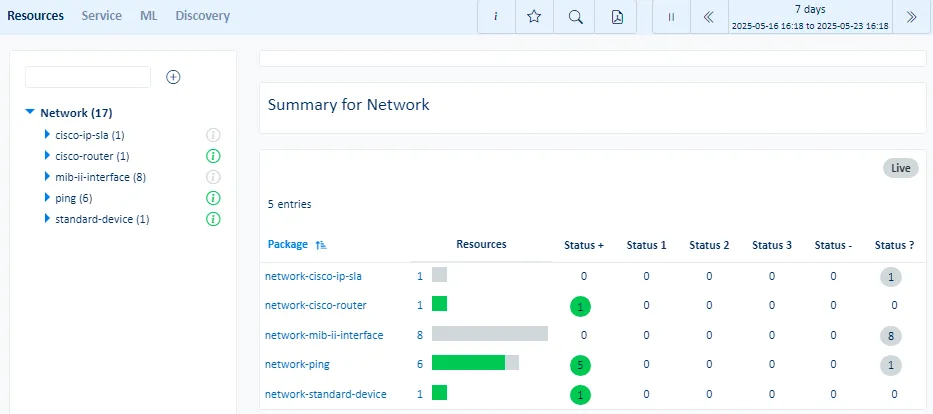 |
| Service | The Service sub-menu displays availability, performance, reliability and maintainability of classes or objects for Network packages and resources. | 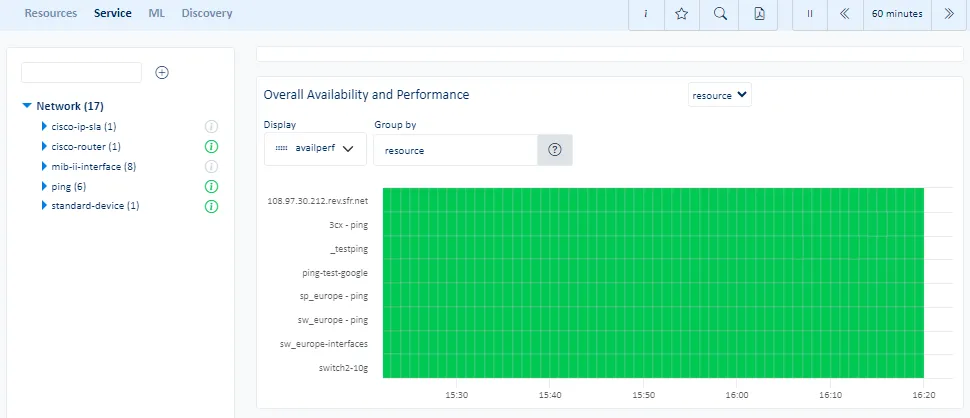 |
| ML | The ML sub-menu displays the largest indicator anomalies, critical indicator predictions and trends for Network packages and resources. | 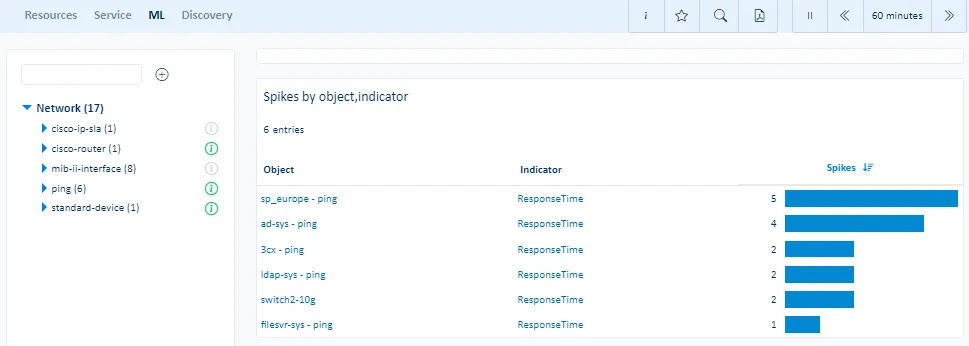 |
| Events | The Events sub-menu displays the ServicePilot events for Network package and resource. | |
VoIP
| Menu item | Data display | |
|---|---|---|
| Metrics | The Metrics sub-menu displays the main indicators for VoIP package and resource. | |
| Service | The Service sub-menu displays availability, performance, reliability and maintainability of classes or objects for VoIP packages and resources. | |
| ML | The ML sub-menu displays the largest indicator anomalies, critical indicator predictions and trends for VoIP packages and resources. | |
| Events | The Events sub-menu displays the ServicePilot events for VoIP package and resource. | |
Log
| Menu item | Data display | |
|---|---|---|
| Metrics | The Metrics sub-menu displays the main indicators for Log package and resource. | 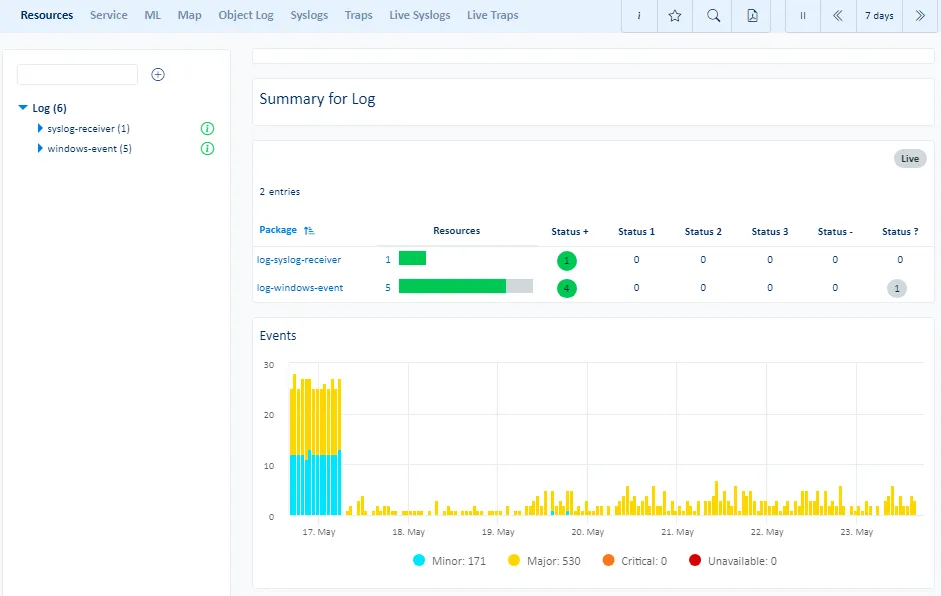 |
| Service | The Service sub-menu displays availability, performance, reliability and maintainability of classes or objects for Log packages and resources. | 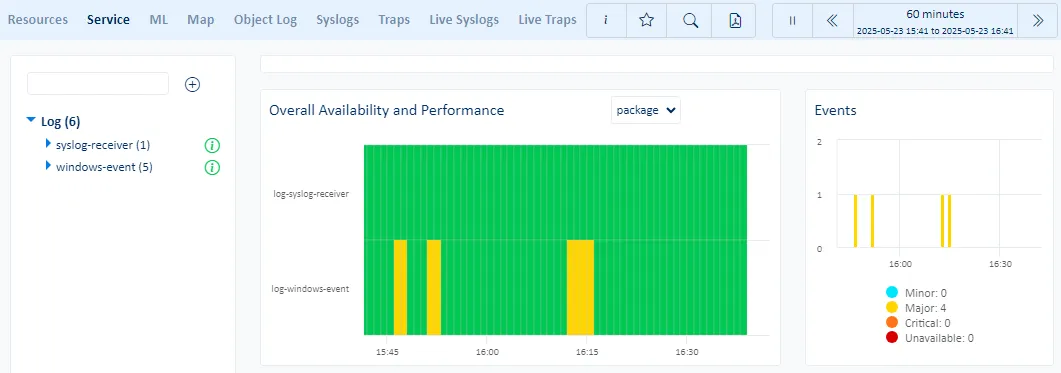 |
| ML | The ML sub-menu displays the largest indicator anomalies, critical indicator predictions and trends for Log packages and resources. | 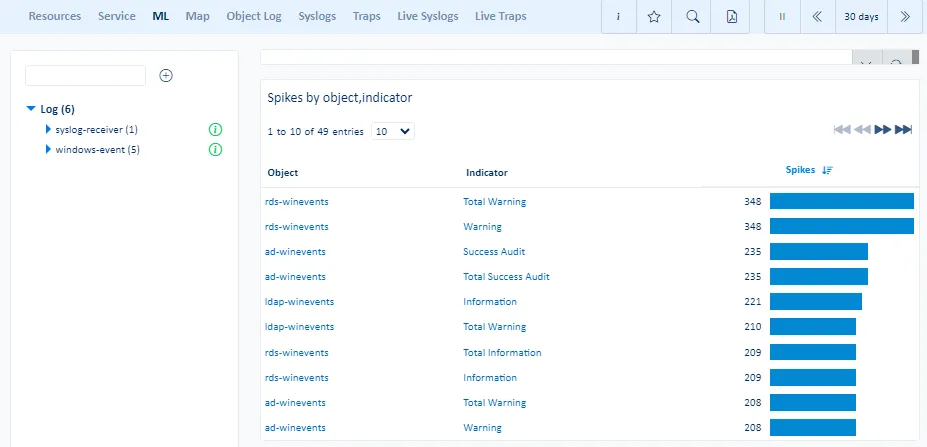 |
| Events | The Events sub-menu displays the ServicePilot events for Log package and resource. | |
| Dependencies | The Dependencies sub-menu displays different logs based on their source IP Address location. | |
| Object Log | The Object Log allows for the analysis of object logs in a filterable dashboard. | 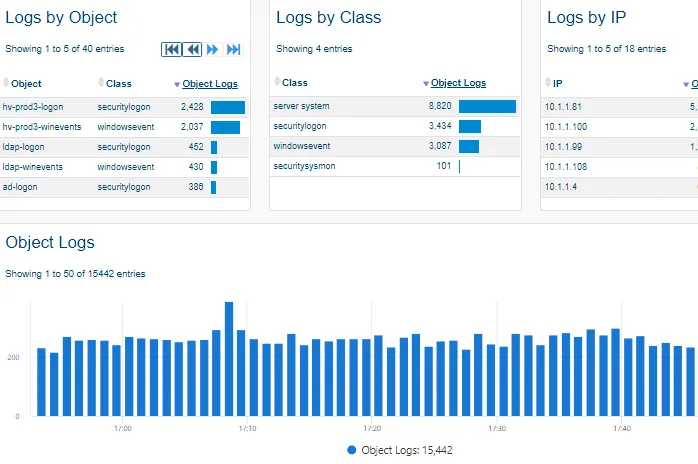 |
| Syslogs | The Syslogs sub-menu allows for the analysis of syslogs in a filterable dashboard. | 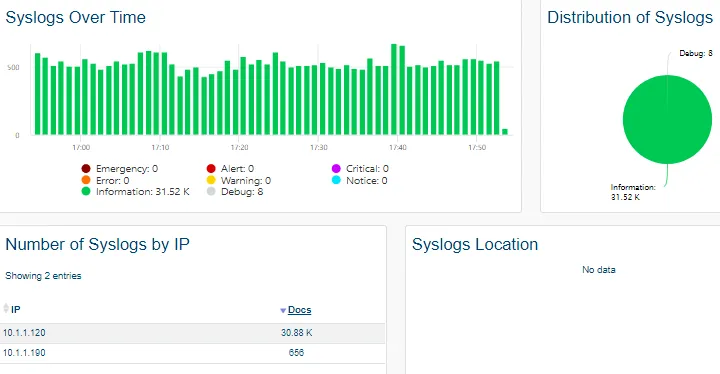 |
| Traps | The Traps sub-menu allows for the analysis of SNMP traps in a filterable dashboard. | 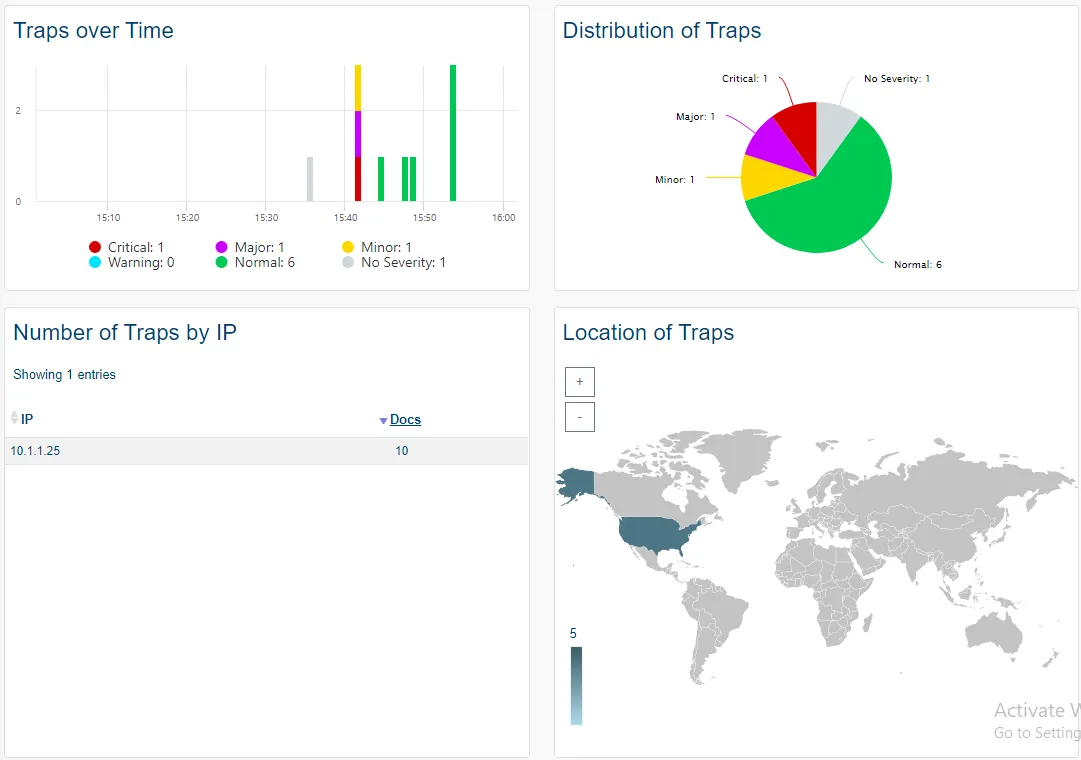 |
| Live Syslogs | The Live Syslogs sub-menu displays the details of received syslogs in real-time. | 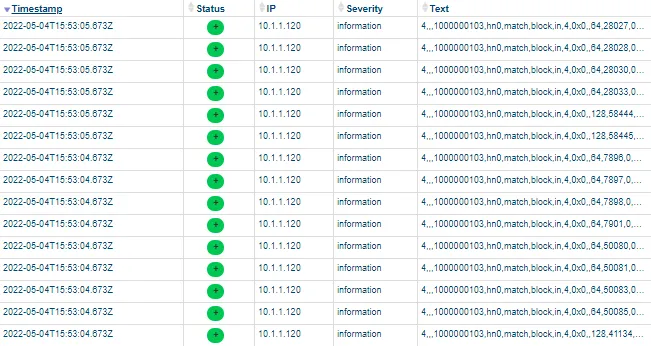 |
| Live Traps | The Live Traps sub-menu displays the details of received SNMP Traps in real-time. | 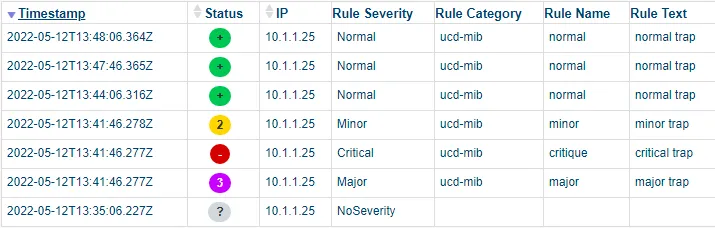 |
Misc
| Menu item | Data display | |
|---|---|---|
| Metrics | The Metrics sub-menu displays the main indicators for Misc package and resource. | 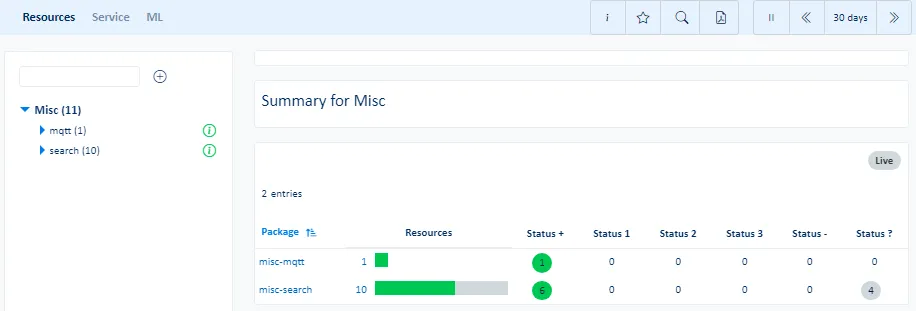 |
| Service | The Service sub-menu displays availability, performance, reliability and maintainability of classes or objects for Misc packages and resources. | |
| ML | The ML sub-menu displays the largest indicator anomalies, critical indicator predictions and trends for Misc packages and resources. | |
| Events | The Events sub-menu displays the ServicePilot events for Misc package and resource. | |
Tools
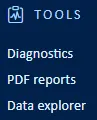
The Tools menu contains all the features needed to search the database to build custom widgets, diagnose why a device is unreachable and generate or view the history of PDF reports.
See the Data explorer documentation for details on custom searches.
| Menu item | Data display |
|---|---|
| Inventory | Server and Windows desktop inventory based on machines where ServicePilot Agent is installed. |
| Diagnostics | Check connectivity between ServicePilot Agents and devices as well ServicePilot Agent host inventory. |
| PDF reports | The PDF reports view allows for the generation of PDF reports based on templates built-in or generated by ServicePilot administrators. Scheduled reports might also be retrieved. |
| Data explorer | Perform custom ServicePilot database searches and save them for later inclusion in dashboards and PDF reports. |
Tools menu
Inventory
| Menu item | Data display | |
|---|---|---|
| Agents | The Agents sub-menu displays an overview of servers that have been provisioned with ServicePilot Agents. | 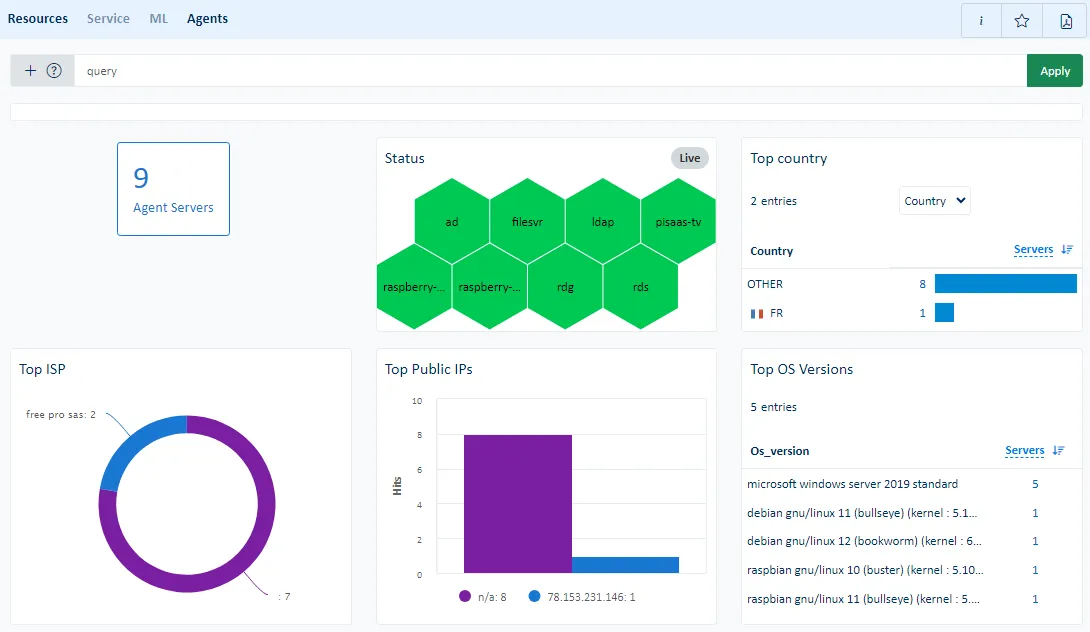 |
| Network | The Network sub-menu displays the latest results of network scans performed by ServicePilot Agents. | 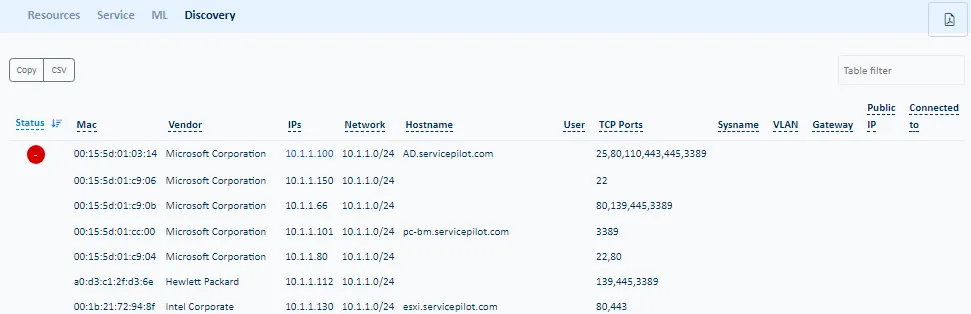 |
| Endpoints | The Endpoints sub-menu displays an overview of Windows workstations that have been provisioned with ServicePilot Endpoint Agents. |
Diagnostics
| Menu item | Data display | |
|---|---|---|
| Diagnostics | The Diagnostics sub-menu provides tests to make sure equipment communicates correctly using Ping and SNMP. | 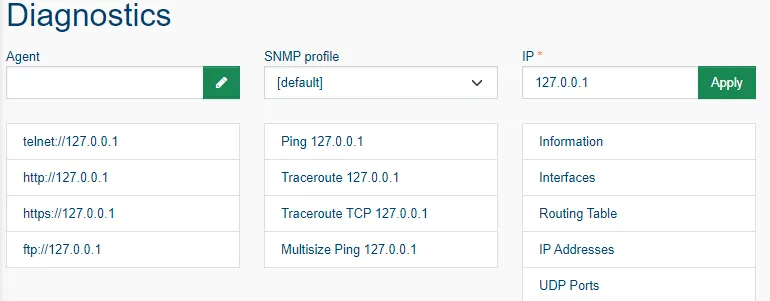 |
| Operations | The Operations sub-menu displays acknowledged objects, objects with SNMP indicies that have been shifted and the ability to manage and unmanage objects. | 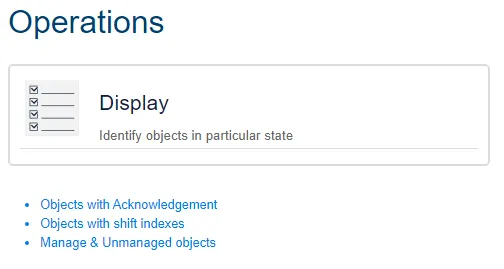 |
PDF reports
| The list of generated PDF reports that the user has rights to view are shown as well as the ability to generate an ad-hock PDF report based on existing PDF report templates. | 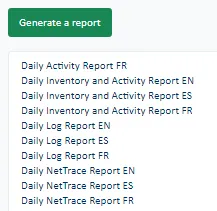 |
Data explorer
| Menu item | Data display | |
|---|---|---|
| Widget | The Widget sub-menu allows for the building and management of custom dashboard and PDF report widgets. | 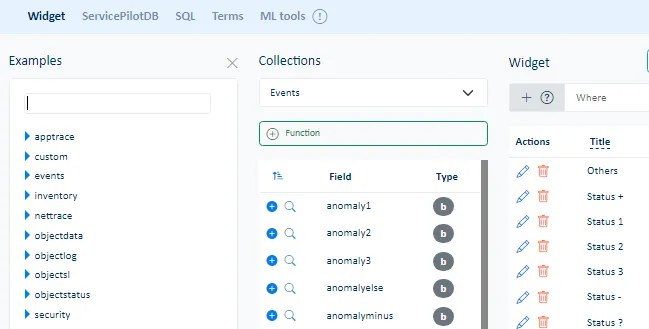 |
| ServicePilotDB | The ServicePilotDB sub-menu shows the current status of the ServicePilot NoSQL database and allows raw Lucene queries of the data. | 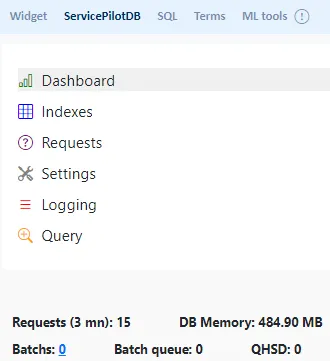 |
| SQL | The SQL sub-menu allows building and making custom SQL requests. These SQL requests can be run as Web API queries. | 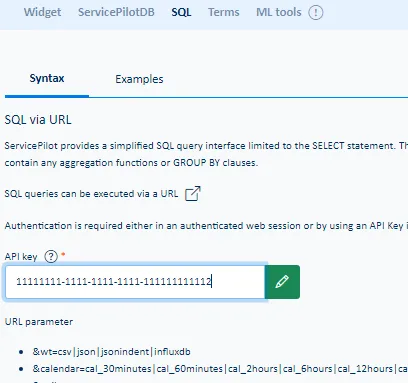 |
| Terms | The Terms sub-menu presents a list of pre-defined queries to the ServicePilot database. | 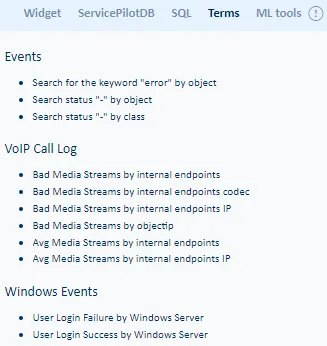 |
