What is Jolokia?
Jolokia is a lightweight and versatile Java-based agent that enables remote management and monitoring of Java Virtual Machine (JVM) applications. It provides a convenient way to access JVM internals and retrieve valuable runtime information through simple and standardized APIs.
Jolokia enables the remote monitoring and management JVM-based applications without the need for complex configurations or direct access to the target JVM process. It allows for the collection of detailed insights into thread states, memory usage, class loading, and other crucial metrics.
The agent's lightweight design and low overhead make it ideal for production environments where resource consumption is a concern. It can be seamlessly integrated into existing JVM-based applications or deployed as a standalone agent, allowing for flexible and non-intrusive monitoring and management.
How to monitor Java applications with Jolokia?
ServicePilot makes it easy to monitor Jolokia by simply adding a Jolokia agent plugin on the target machine. A corresponding resource of the appmon-jolokia package then needs to be added via the ServicePilot web interface to receive information from the Jolokia Agent.
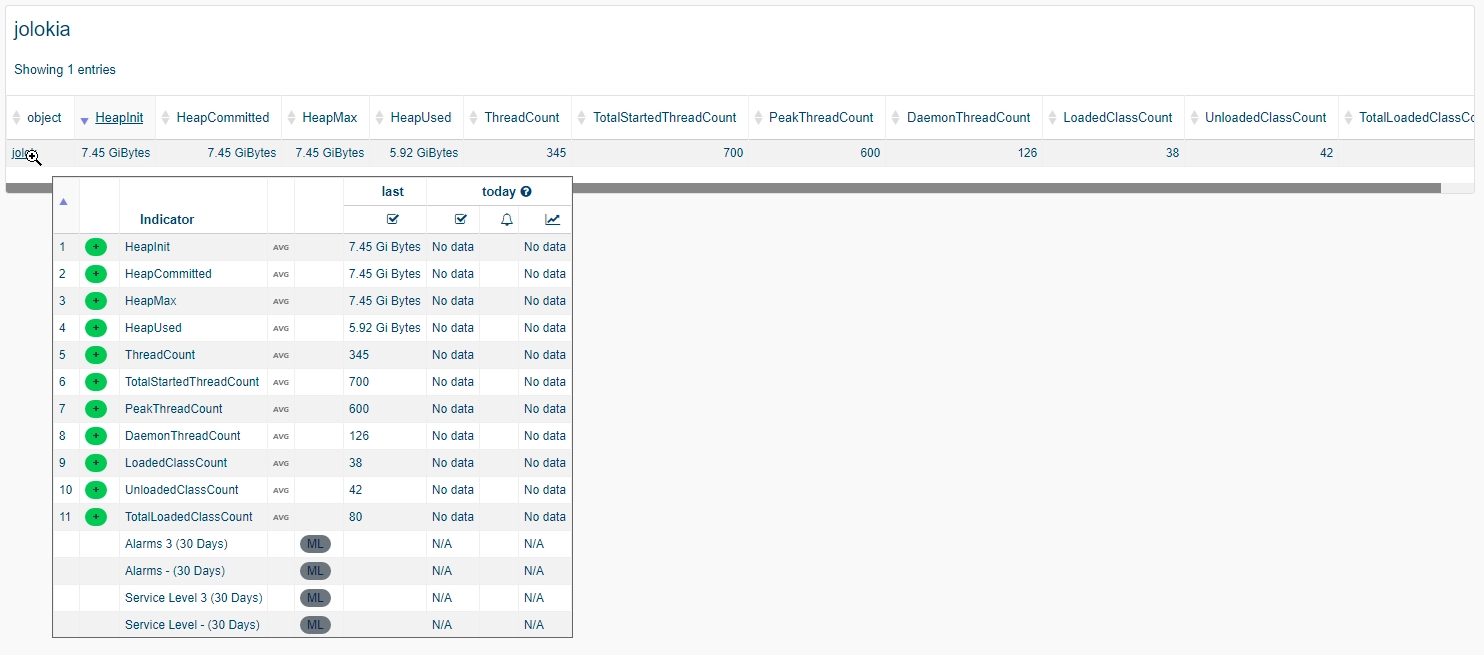
The statistics gathered in this way are:
- Memory
- Heap Memory Usage
- Heap Memory Max
- Heap Memory Committed
- Threading
- Thread Count
- Total Started Thread Count
- Peak Thread Count
- Daemon Thread Count
- Class Loading
- Loaded Class Count
- Unloaded Class Count
- Total Loaded Class Count
How to install a jolokia resource?
- Use your ServicePilot OnPremise installation or a SaaS account.
- Add a new jolokia resource via the web interface (
/prmviewsor/prmresources) or via API (/prmpackagespage), the default ServicePilot agent or another agent will be provisioned automatically.
Details of the jolokia package are located in the
/prmpackagespage of the software.
Benefits
ServicePilot enables you to deliver IT services faster and more securely with automated discovery and advanced monitoring features.
By correlating the technology JOLOKIA with APM and infrastructure monitoring, ServicePilot is able to provide a more comprehensive view of an organization's IT environment.
This allows IT teams to quickly identify and diagnose issues that may be impacting application performance, and take corrective action before end-users are affected.
Start with a free trial of our SaaS solution. Explore our plans or contact us to find what works best for you.