What is RabbitMQ?
RabbitMQ is an open-source message broker software that implements the Advanced Message Queuing Protocol (AMQP). Developed in Erlang, RabbitMQ provides robust messaging for applications and is easy to deploy on premises and in the cloud.
RabbitMQ is released under the Mozilla Public License. It's known for its robustness, ease of use, and support for a wide range of messaging patterns, including but not limited to publish/subscribe, request/reply, and point-to-point.
How to monitor RabbitMQ?
ServicePilot makes it very easy to monitor RabbitMQ with minimal configuration required on the RabbitMQ host to enable the RabbitMQ Management Plugin. Then add a appmon-rabbitmq resource via the ServicePilot web interface and specify the URL to the RabbitMQ Management Plugin web API from which ServicePilot will collect statistics.
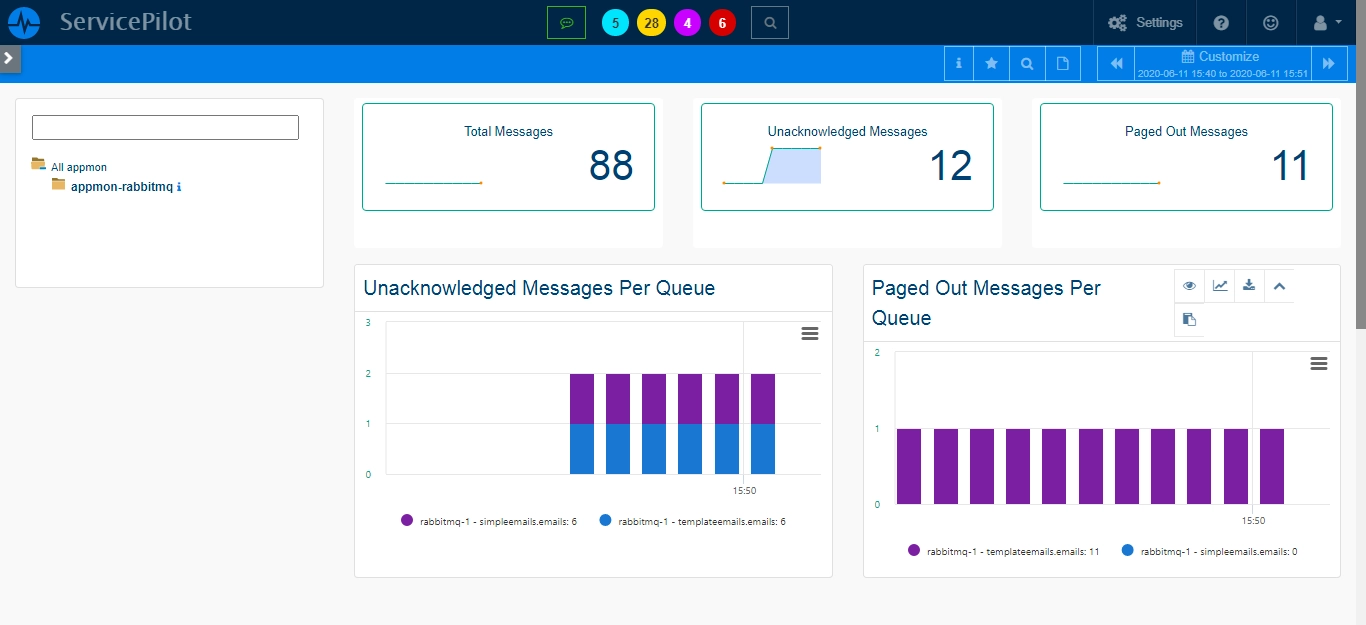
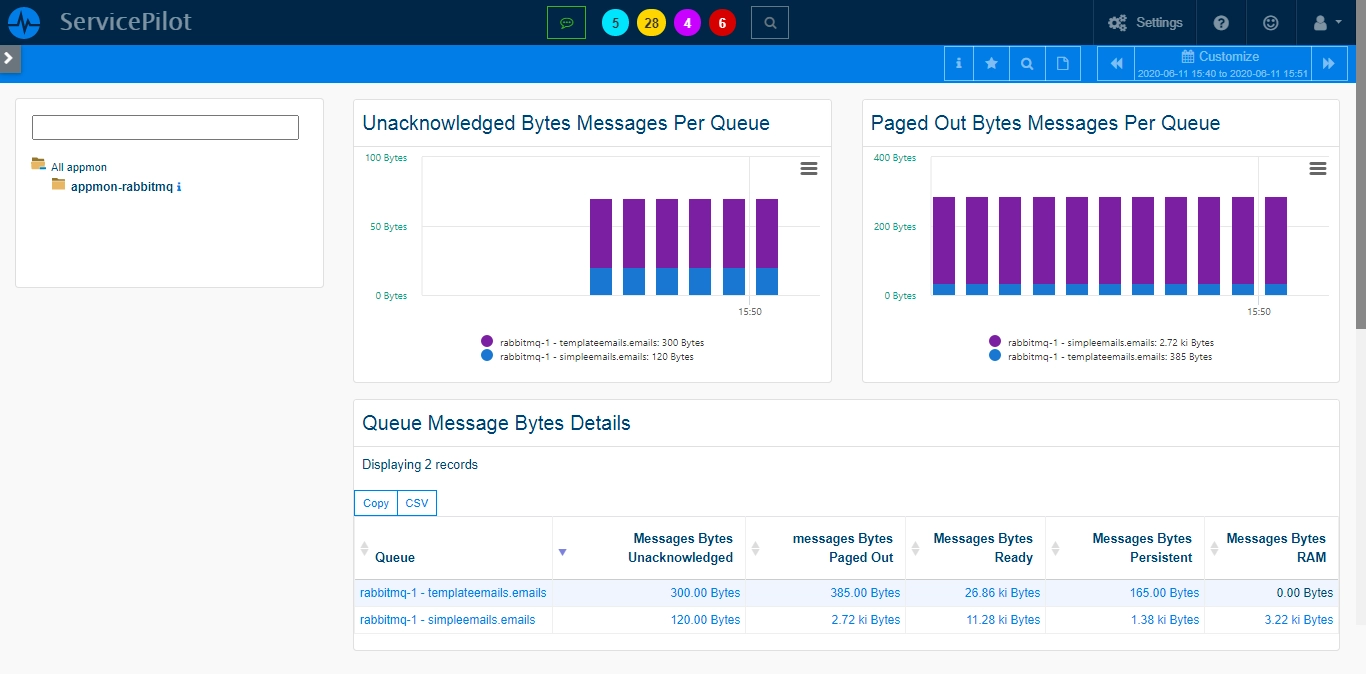
For each RabbitMQ resource, the following statistics are gathered:
RabbitMQ deployment overview:
- Connections: The number of connections to the RabbitMQ cluster. Any drop in this number means that some consumers might be down.
- Channels: Channels currently open
- Queues: The number of queues that are created across the node in the cluster. It helps in identifying if there are queues going down in the cluster or if there are new queues being created.
- Exchanges: message routing agents, defined by the virtual host within RabbitMQ
- Consumers: Number of customers
- Listeners: Number of listeners listening to RabbitMQ Queue for any incoming messages
Per node details:
- Uptime: Time since the Erlang VM started, in milliseconds
- Memory: Memory used in bytes and point at which the memory alarm will go off
- File descriptors: File descriptors used and available
- Sockets: Number of file descriptors used and available for use as sockets
- Processes: Number of Erlang processes in use and Maximum
- Disk: Disk free space and alarm threshold
- Connections: Current connections usage
- Channels: Current channels usage
- Queues: Number of queues declared, created and deleted
- Garbage collection: GC run and space reclaimed by GC
- I/O usage: Disk I/O statistics
Per exchange:
- Publishes in: Count of messages published "in" to an exchange
- Publishes out: Count of messages published "out" of an exchange
Per queue:
- Consumers: Number of queue consumers (total count)
- Memory: Queue memory utilisation
- Nodes: Number of follower replicas if the queue is mirrored
- Messages: Sum of ready and unacknowledged messages
How to install a rabbitmq resource?
- Use your ServicePilot OnPremise installation or a SaaS account.
- Add a new rabbitmq resource via the web interface (
/prmviewsor/prmresources) or via API (/prmpackagespage), the default ServicePilot agent or another agent will be provisioned automatically.
Details of the rabbitmq package are located in the
/prmpackagespage of the software.
Benefits
ServicePilot enables you to deliver IT services faster and more securely with automated discovery and advanced monitoring features.
By correlating the technology RABBITMQ with APM and infrastructure monitoring, ServicePilot is able to provide a more comprehensive view of an organization's IT environment.
This allows IT teams to quickly identify and diagnose issues that may be impacting application performance, and take corrective action before end-users are affected.
Start with a free trial of our SaaS solution. Explore our plans or contact us to find what works best for you.